Hydrol. Earth Syst. Sci., 20, 4757–4773, 2016 www.hydrol-earth-syst-sci.net/20/4757/2016/ doi:10.5194/hess-20-4757-2016
© Author(s) 2016. CC Attribution 3.0 License.
Contrasting transit times of water from peatlands and eucalypt
forests in the Australian Alps determined by tritium: implications
for vulnerability and the source of water in upland catchments
Ian Cartwright1,2and Uwe Morgenstern3
1School of Earth, Atmosphere and Environment, Monash University, Clayton, Victoria 3800, Australia 2National Centre for Groundwater Research and Training, G.P.O. box 2100, Flinders University,
Adelaide, SA 5001, Australia
3Isotope Hydrology & Water Dating Lab, GNS Science, Lower Hutt 5040, New Zealand
Correspondence to:Ian Cartwright ([email protected])
Received: 19 July 2016 – Published in Hydrol. Earth Syst. Sci. Discuss.: 1 August 2016 Revised: 14 November 2016 – Accepted: 14 November 2016 – Published: 1 December 2016
Abstract. Peatlands are a distinctive and important compo-nent of many upland regions that commonly contain distinc-tive flora and fauna which are different from those of adjacent forests and grasslands. Peatlands also represent a significant long-term store of organic carbon. While their environmen-tal importance has long since been recognised, water transit times within peatlands are not well understood. This study uses tritium (3H) to estimate the mean transit times of water
from peatlands and from adjacent gullies that contain euca-lypt forests in the Victorian Alps (Australia). The3H
activi-ties of the peatland water range from 2.7 to 3.3 tritium units (TUs), which overlap the measured (2.9 to 3.0 TU) and ex-pected (2.8 to 3.2 TU) average 3H activities of rainfall in
this region. Even accounting for seasonal recharge by rain-fall with higher3H activities, the mean transit times of the
peatland waters are < 6.5 years and may be less than 2 years. Water from adjacent eucalypt forest streams has3H activities
of 1.6 to 2.1 TU, implying much longer mean transit times of 5 to 29 years. Cation/Cl and Si/Cl ratios are higher in the
eucalypt forest streams than the peatland waters and both of these water stores have higher cation/Cl and Si/Cl ratios
than rainfall. The major ion geochemistry reflects the degree of silicate weathering in these catchments that is controlled by both transit times and aquifer lithology. The short transit times imply that, unlike the eucalypt forests, the peatlands do not represent a long-lived store of water for the local river systems. Additionally, the peatlands are susceptible to drying
out during drought, which renders them vulnerable to dam-age by the periodic bushfires that occur in this region.
1 Introduction
Globally, peatlands occupy parts of the upland areas of many river catchments and provide water to the headwater streams in those catchments. It is estimated that peatlands cover
∼4×10⁶km2or ∼3 % of the world’s land area (Dixon et
al., 1994). Peatlands have received much attention because they represent a major (1.8 to 4.5×10¹¹t) long-lived store of
terrestrial organic carbon (Gorham, 1991; Page et al., 2002). Peatlands commonly contain distinctive flora such as sphag-num moss, sedges, and orchids that may not occur in sur-rounding forests or grasslands (Grover and Baldock, 2013; Grover et al., 2005; McDougall, 1982). Due to their unique flora, there may be also differences in fauna between the peatlands and the surrounding regions.
Draining of peatlands is a major environmental concern. This can occur directly due to anthropogenic activities such as peat extraction and the conversion of peatland to agri-cultural land or forest. Additionally, since peatlands form in high rainfall environments, drainage can occur due to a re-duction in rainfall. Draining of peatlands destroys the habi-tats of flora and fauna and also causes oxidation of the or-ganic matter, which in turn releases CO2to the atmosphere
(Gorham, 1991; Grover and Baldock, 2010). In addition, the
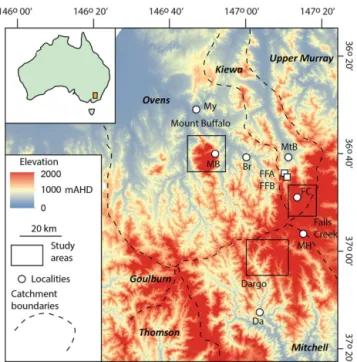
Figure 1.Location of study sites in northeast Victoria superimposed on the digital elevation model. Places: Br indicates Bright; Da indi-cates Dargo; MB indiindi-cates Mount Buffalo; MtB indiindi-cates Mount Beauty; MH indicates Mount Hotham; My indicates Myrtleford. FFA and FFB are the Falls Forest sampling sites A and B, other sampling sites are in the indicated study areas (see the Supplement Fig. S1). Catchment boundaries from Department of Environment, Land, Water and Planning (2016); elevations are relative to the Aus-tralian Height Datum (AHD).
dried peat is susceptible to bushfires that commonly occur during droughts and which can destroy the peatlands (van der Werf et al., 2010).
Peatlands comprise∼520 km2or
∼2.5 % of the alpine
re-gion of the southeast Australian mainland (Fig. 1) (Costin, 1972; Grover et al., 2005; Western et al., 2009). The peat gen-erally occupies shallowly sloping areas in the upland plains that are poorly drained. While it forms only a minor part of the Australian landscape, understanding the water balance in the Australian peatlands is important for assessing the poten-tial impacts of environmental change. If water transit times are short, then the peatlands may dry significantly during droughts, making them prone to degradation and vulnerable to bushfires. Additionally, the peatlands provide water to nu-merous small upland streams. Most of the upland peatlands are flanked by eucalypt forests that occupy steeper slopes and gullies. Eucalypts have high transpiration rates, and ground-water recharge rates in eucalypt-dominated areas are low (Allison et al., 1990), which results in relatively long water transit times (on the order of years to decades) in eucalypt-dominated catchments (Cartwright and Morgenstern, 2015).
1.1 Determining mean transit times
The mean transit time represents the average time required for water to flow through the aquifer or soil from where it recharges to where it discharges at the surface (e.g. at a spring, stream, or lake) or is sampled from a bore (Cook and Bohlke, 2000; Małoszewski and Zuber, 1982; McDon-nell et al., 2010). Documenting mean transit times is impor-tant for understanding and managing catchments. The time required for nutrients or contaminants to be transported from recharge areas to streams is a direct function of the tran-sit time (Morgenstern and Daughney, 2012). Additionally, catchments with long transit times are more likely to be re-silient to short-term (years to decades) variations in rainfall but will respond to climate or land use changes that cause longer-term (decades to centuries) changes in groundwater recharge and flow.
Tritium (3H) has a half-life of 12.32 years which, together
with the fact that it is part of the water molecule, makes it an ideal tracer for determining transit times of young shal-low groundwater, soil water, or surface water (Clark and Fr-tiz, 1997; Cook and Bohlke, 2000; Morgenstern et al., 2010). Other potential tracers for determining transit times of young waters, such as3He, chlorofluorocarbons, and SF6, are gases
that degas to the atmosphere and are thus difficult to use for water sampled from streams. Because the seasonal vari-ation of stable isotope ratios or major ion concentrvari-ations in recharge is attenuated with increasing transit times, time se-ries of stable isotope ratios or Cl concentrations are also com-monly used to estimate mean transit times (e.g. McGuire and McDonnell, 2006; Hrachowitz et al., 2010, 2013; Kirchner et al., 2010). However, this is only practicable where mean tran-sit times are shorter than∼5 years, as longer transit times attenuate the seasonal variation of these tracers (Stewart et al., 2010). Additionally, the use of these tracers requires a detailed (preferably at least weekly) record of stable isotope and/or major ion geochemistry in rainfall for a period which exceeds that of the transit times of water in the catchment (e.g. Timbe et al., 2015).
Coupled with models that describe the distribution of flow paths within an aquifer, commonly referred to as lumped parameter models (Cook and Bohlke, 2000; Małoszewski, 2000; McGuire and McDonnell, 2006),3H may be used to determine transit times of waters that are up to∼100 years old. The3H activities in rainfall over the last several decades
have been measured globally (e.g. International Atomic En-ergy Association, 2016; Tadros et al., 2014), which allows the3H input to catchments over time to be estimated.
Rain-fall3H activities peaked in the 1950s to 1960s due to the
production of3H in atmospheric thermonuclear tests
(com-monly termed “bomb-pulse”3H).
There are two different approaches in using3H to estimate
mean transit times. In the Northern Hemisphere, the3H
mea-I. Cartwright and U. Morgenstern: Transit times in the Australian Alps 4759 surements of 3H activities in groundwater or surface water
yielding non-unique estimates of transit times (Morgenstern et al., 2010). Mean transit times may, however, be determined using time series of3H measurements (e.g. Małoszewski and
Zuber, 1982; Michel, 1992; McGuire and McDonnell, 2006). The use of time series measurements is potentially advanta-geous as, in addition to determining a mean transit time, it al-lows the most appropriate lumped parameter model to be as-sessed by comparison of the predicted and observed changes to 3H activities over time (Małoszewski and Zuber, 1982).
However, constraining lumped parameter models using se-quential3H data collected over several years has commonly made the assumption that the data can be described by a sin-gle lumped parameter model and that the flow system is time invariant, which may not be the case in reality (e.g. Kirchner, 2016b).
The bomb-pulse3H activities in the Southern Hemisphere
were several orders of magnitude lower than in the North-ern Hemisphere (Clark and Fritz, 1997; Tadros et al., 2014) and the3H activities of the remnant bomb-pulse waters have
now decayed below those of modern rainfall. This permits
3H to be used in a similar manner to other radioactive
iso-tope tracers, such as 14C or 36C, whereby a residence or
transit time may be estimated from individual3H activities
(Morgenstern et al., 2010). Since the3H activities reflect the
net residence time in the catchment, there is no requirement for the flow system to be time invariant. However, this ap-proach to determining mean transit times does not permit the optimal lumped parameter model to be determined, as is the case when time series3H measurements at similar flow
conditions are available. The attenuation of the bomb-pulse
3H in the Southern Hemisphere is such that constraining the
lumped parameter models using time series measurements of 3H is probably no longer practicable. For example, the
predicted decrease in3H activities for a water with a mean
transit time of 10 years between 2016 and 2026 calculated using the lumped parameter models and3H input employed
in this study is only∼0.2 TU, and the predicted3H vs. time
trends is similar for the different models. Instead, a plausible lumped parameter model must be proposed based on factors such as the geometry of the flow system or information from previous time series studies. Given that the different lumped parameter models yield different mean transit times for the same3H activity, this introduces uncertainties. However, be-cause the3H activities of the remnant bomb-pulse waters are
below those of modern rainfall, the relative transit times of Southern Hemisphere waters are largely independent of as-sumed flow models (i.e. water with a low3H activity has a
longer mean transit time than water with a high3H activity).
Rivers aggregate water from different flow systems and the mean transit times of water contributed by individual trib-utaries may vary considerably. Kirchner (2016a) discussed the impacts of aggregation for mean transit times calculated from time series major ion and stable isotope data. That study demonstrated that the mean transit time calculated from the
aggregated water was generally lower than the actual mean transit time (i.e. that which would be calculated from the weighted average of each of the end-members contributing to the mixture). Aggregation also affects mean transit times calculated from individual3H activities. Mean transit times
calculated from the3H activity of the aggregated water are
again generally lower than the actual mean transit times with the error increasing as the difference between the mean tran-sit time of the individual end-members increases (Stewart et al., 2016).
1.2 Transit times in upland peat
Compared with catchments developed on other vegetation types, the transit time of peatland water, especially upland or mountain peat, is less well known. Due to peatlands con-taining poorly drained organic-rich soils and occupying shal-low slopes, it is sometimes assumed that peatland waters have long transit times. However, there has been little assess-ment of that assumption (e.g. as discussed by Western et al., 2009). Using3H activities, transit times of years to decades
were proposed for water from metre- to tens-of-metres-thick peat deposits in Quebec, Canada (Dever et al., 1984), Dart-moor, UK (Charman et al., 1999), Lithuania (Mažeika et al., 2009), and Minnesota, USA (Siegel et al., 2001). From the preservation of seasonalδ18O andδ2H values, Aravena
and Warner (1992) estimated that the water from the up-per∼0.1 m of peat from Ontario, Canada, was < 1 year old. Mean transit times from an upland peat-bearing catchment in Zhurucay, Ecuador, were estimated at < 1 year using oxygen isotopes (Mosquera et al., 2016). Mean transit times from the extensively studied upland catchments in the United King-dom, which include extensive regions of peat, were estimated using time series of stable isotopes and Cl as < 5 years (e.g. Soulsby et al., 2006; Kirchner et al., 2010; Hrachowitz et al., 2013; Tetzlaff et al., 2014; Benettin et al., 2015). However, the mean transit times of the water specifically draining the peat in those catchments are generally not known. Morris and Waddington (2011) modelled water transit times in peat and suggested that they vary from < 1 year for the upper 0.1 m to several years in deeper layers, which is broadly consis-tent with the above estimates. While not estimating transit times, Western et al. (2009) concluded, on the basis of hydro-graph analysis and water balance calculations, that peatlands in southeast Australia did not act as long-term water stores for the local streams.
1.3 Objectives
This study was designed to test the hypothesis that peatlands in the Victorian Alps, southeast Australia, represent a rela-tively long-lived store of water. Specifically, we utilise3H to
provide the first estimates of the mean transit times of water draining Australian peatlands during summer baseflow con-ditions and compare these with mean transit times of streams
that drain adjacent eucalypt forests. Documenting mean tran-sit times is important for determining the relative importance of the peatlands and eucalypt forests in providing water to the local rivers and also in assessing potential environmental im-pacts resulting from land use or climate change. In addition, we assess whether the major ion geochemistry of the water may be used as a first-order proxy for mean transit times and discuss the controls on mean transit times in these upland areas.
2 Methods 2.1 Setting
Water from streams draining peatlands and eucalypt forests was sampled in the Mount Buffalo (Ovens catchment: Fig. S1a), Falls Creek (Kiewa and Upper Murray catchments: Fig. S1b), and Dargo (Mitchell catchment: Fig. S1c) regions of the Victorian Alps (Fig. 1). Catchment areas in the peat-lands and eucalypt forests are similar, ranging from 0.5 to 6.4 km2(Table 1). The Falls Creek and Dargo areas consist
of indurated Ordovician metasedimentary rocks, Devonian granites, and minor Tertiary basalts, whereas the Mount Buf-falo plateau comprises Devonian granite (van den Berg et al., 2004; Energy and Earth Resources, 2016).
Peatlands are developed in poorly drained low-relief up-land areas of the Victorian Alps with eucalyptus forests occupying steeper valleys that dissect the uplands and the higher better-drained areas at the margins of the peatland (Grover and Baldock, 2013; Grover et al., 2005; McDougall, 1982; Western et al., 2009). The peatlands are characterised by sphagnum mosses (Sphagnum cristatum), rushes (
Em-podisma minusandBaloskion australe), and heaths (Epacris
paludosaandRichea continentis) (McDougall, 1982). Most
of the peatlands in the Alpine region are < 2 m thick. The upper few centimetres comprise little decomposed plant ma-terial (the fibric zone). The fibric zone grades downwards through the hemic zone (typically 50 cm to 1 m thick) where the soils are organic rich and fibrous, with abundant dis-cernible roots into a denser soil (the sapric zone) compris-ing mainly decomposed organic matter with clays and frag-ments of rock. The peat typically has a thin (< 20 cm thick) layer of weathered rocks at its base but mainly overlies little-weathered basement rocks. The hydrology of the peat com-prises the upper acrotelm, which alternates between satu-rated and unsatusatu-rated as the water table rises and falls, and the lower permanently saturated catotelm (e.g. Grover et al., 2005). The boundary between the acrotelm and catotelm is generally in the hemic zone.
In the alpine regions of southeast Australia, the dominant eucalypt species include mountain ash (Eucalyptus regnans)
at altitudes of <1000 m and alpine ash (Eucalyptus delegaten-sis) and snow gum (Eucalyptus pauciflora) at higher altitudes
(McDougall, 1982). The soils of the eucalypt forests include
sandy lithosols; these are thin, well-drained, and poor in or-ganic matter and largely occur on the upper slopes of the gullies and on the elevated areas surrounding the peatlands. In the centres of the gullies, the soils also include alpine humus loams that contain higher contents of organic mat-ter and which are less well drained. The soils overlie weath-ered regolith that is a few tens of centimetres to a few metres thick. There are also minor deposits of colluvium and allu-vium along the streams (Shugg, 1987). Groundwater flow is restricted to the weathered zones and fractures in the gran-ites and metasediments; the minor alluvial and colluvial sed-iments are more permeable but represent only a minor part of the landscape.
Average precipitation is 1250 mm yr−1 at Falls Creek,
1650 mm yr−1 at Mount Hotham (near Dargo), and
1790 mm yr−1 at Mount Buffalo (Bureau of Meteorology,
2016) (Fig. 1). Approximately 60 to 70 % of the precipita-tion occurs in the austral autumn to winter (May to Septem-ber) with a proportion of the winter precipitation occurring as snow. February and March have the lowest precipitation (4 to 6 % of the annual total in each month). No currently active river gauges exist in these upland areas and previous flow measurements were only from a few streams at Falls Creek (Department of Environment, Land, Water, and Plan-ning, 2016). These limited records show that river flow varies seasonally with the majority of streamflow occurring in the winter months; however, flows persist over summer (Fig. 2a) and the streams generally do not record zero flows (Fig. 2b). Water from some of the peatlands at Falls Creek drains into the Rocky Valley Reservoir (∼2.8×10⁷m3), which is used
to provide water to the Falls Creek resort and the Kiewa Val-ley hydroelectric system. Water from some of the peatlands at Mount Buffalo feeds Lake Catani, which is an artificial recreational lake with a volume of∼2×10⁶m3.
Mean transit times in the Ovens Valley, which is domi-nated by eucalypt forests (Fig. 1), were estimated using3H as
being between 4 and 30 years, with higher mean transit times recorded during summer low flow conditions (Cartwright and Morgenstern, 2015). That study focused on the major tribu-taries to the Ovens River that had catchment areas between 6 and 435 km2, and the transit times in the upper reaches of the
catchments where streamflow commences remain unknown. Additionally, it was not established whether there are differ-ences between mean transit times for water draining the peat-lands and the eucalypt forests in those upper catchments. 2.2 Sampling and analytical techniques
diam-I.
Cartwright
and
U
.
Mor
genster
n:
T
ransit
times
in
the
A
ustralian
Alps
4761
Table 1.Geochemistry of water samples from the Australian Alps.
Sitea Date Areab 3H δ2H δ18O EC Na Mg K Ca Si Cl Br NO
3 SO4
km2 TU ‰ V-SMOW ‰ V-SMOW µS cm−1 mg L−1 mg L−1 mg L−1 mg L−1 mg L−1 mg L−1 mg L−1 mg L−1 mg L−1
Peatlands
Mount Buffalo
Buffalo Cresta A 26/11/2015 1.5 3.32±0.053 −26 −5.0 19.12 1.12 0.125 0.192 0.621 2.714 0.94 0.0031 0.040 0.072 Buffalo Cresta A 23/02/2015 1.5 2.84±0.058 −41 −7.7 13.72 2.06 0.125 0.168 0.645 2.831 0.95 0.0039 0.048 0.185 Buffalo Cresta B(P)b 23/02/2015 2.75±0.055 −41 −7.7 22.33 1.96 0.152 0.273 1.123 3.244 1.08 0.0037 0.285 0.304 Buffalo Cresta C 23/02/2015 2.1 2.75±0.056 −40 −7.5 19.92 1.06 0.121 0.160 0.432 1.632 0.95 0.0036 0.063 0.080 Buffalo Cresta D(P) 26/11/2015 2.70±0.048 −37 −7.3 15.21 1.79 0.131 0.184 0.653 2.601 1.14 0.0038 0.073 0.194 Buffalo Crystal A 23/02/2015 3.5 2.74±0.055 −35 −6.6 12.01 1.97 0.153 0.178 0.684 2.031 1.01 0.0038 0.066 0.207 Buffalo Crystal B 23/02/2015 0.2 2.93±0.058 −30 −5.7 12.65 2.06 0.130 0.250 0.354 3.466 0.99 0.0037 0.320 0.245
Falls Creek
Falls Cope 24/02/2015 1.9 3.14±0.061 −41 −7.2 9.62 0.92 0.247 0.119 0.519 1.417 0.47 0.0031 0.084 0.076 Falls Langford A 24/02/2015 0.5 3.10±0.060 −39 −7.1 21.42 1.43 0.512 0.203 0.882 2.496 0.64 0.0035 0.250 0.271 Falls Langford B(P) 24/02/2015 2.98±0.059 −43 −8.3 8.52 0.88 0.223 0.160 0.490 0.812 0.70 0.0033 0.165 0.167 Falls Rocky A 24/02/2015 3.5 2.96±0.059 −42 −8.0 7.65 0.79 0.194 0.057 0.463 1.097 0.55 0.0026 0.307 0.111 Falls Rocky A 25/11/2015 3.5 2.90±0.050 −42 −8.1 11.25 0.78 0.149 0.075 0.318 2.103 0.51 0.0018 0.164 0.163 Falls Rocky B(P) 25/11/2015 2.86±0.049 −42 −8.2 7.47 0.62 0.136 0.118 0.255 1.029 0.54 0.0023 0.035 0.130 Falls Rocky C(P) 25/11/2015 3.17±0.055 −35 −6.5 9.54 0.79 0.257 0.245 0.540 1.125 0.51 0.0025 2.097 0.185 Falls Rocky D 25/11/2015 2.6 3.14±0.059 −33 −6.5 16.47 1.04 0.227 0.223 0.403 1.113 0.93 0.0033 0.087 0.079
Dargo
Dargo A 25/11/2015 5.5 2.84±0.048 −40 −7.7 21.17 1.15 0.930 0.133 1.427 3.259 1.10 0.0040 0.804 0.142 Dargo B 25/11/2015 1.2 2.69±0.043 −43 −8.1 31.9 1.34 1.381 0.334 2.112 2.147 0.91 0.0038 0.493 0.050 Dargo C(P) 25/11/2015 2.47±0.040 −39 −7.0 29.2 1.56 1.667 0.308 1.900 3.012 0.93 0.0038 0.388 0.063 Dargo D 25/11/2015 2.7 3.36±0.053 −35 −6.9 13.9 0.77 0.343 0.097 1.095 2.788 0.83 0.0025 1.845 0.192
Eucalypt forest
Buffalo Forest A 24/02/2015 3.3 2.21±0.048 −35 −6.3 42.7 3.89 2.056 0.618 1.727 4.433 1.16 0.0045 0.052 0.740 Buffalo Forest A 26/11/2015 3.3 2.35±0.042 −34 −6.4 39.5 3.27 1.878 0.470 1.536 4.844 1.30 0.0048 0.038 0.763 Falls Forest A 24/02/2015 3.3 1.56±0.037 −38 −7.4 65.2 5.70 3.230 0.543 3.686 5.060 2.60 0.0097 0.104 0.499 Falls Forest B 24/02/2015 1.5 2.10±0.047 −37 −7.5 45.7 3.24 2.092 0.445 2.149 4.233 1.09 0.0045 0.038 0.608 Falls Forest C 25/11/2015 6.4 2.26±0.040 −31 −6.2 45.3 3.41 1.855 0.566 1.623 6.236 1.20 0.0048 0.418 0.901 Falls Forest D 25/11/2015 5.8 1.70±0.035 −37 −7.3 56.0 4.78 2.793 0.400 3.092 9.540 1.22 0.0045 0.022 0.581 Dargo Forest A 25/11/2015 6.1 2.00±0.036 −29 −5.7 44.1 4.12 1.898 0.542 1.654 5.328 1.24 0.0045 0.240 0.408
Rainfall
Buffalo Feb 2015 (12)d 2.85±0.057 −36 −7.0 11.58 0.68 0.011 0.058 0.214 0.081 0.98 0.0039 0.015 0.081
Buffalo Nov 2015 (9) 2.88±0.051 −35 −6.5 12.20 0.53 0.117 0.108 0.361 0.077 0.80 0.0028 0.106 0.171
Buffalo Dec 2013 (17) 2.99±0.046 −38 −7.3 0.87 1.10
Buffalo Feb 2014 (2) 2.90±0.049 −37 −7.1 Buffalo Jul 2014 (< 1) 2.52±0.043 −40 −7.9 Buffalo Sep 2014 (3) 2.71±0.044 −34 −6.8 Melbournee Jul 2013 (12) 2.72±0.045 −33 −6.3 Otwayse Sep 2014 (6) 2.45±0.041 −22 −4.4 La Trobee Aug 2015 (12) 2.76
±0.043 −36 −6.8
Notes:aSampling regions in Fig. 1.bCatchment area.cP indicates piezometer sample.dMonth collected and number of months represented by the sample.eOther rainfall from southeast Australia. The rainfall samples represent aggregated samples collected over the number
of months indicated; all other samples are individual samples.
www
.h
ydr
ol-earth-syst-sci.net/20/4757/2016/
Hydr
ol.
Earth
Syst.
Sci.,
20,
4757–
4773
,
Figure 2. (a)Streamflow at Watchbed Creek, which drains
peat-lands at Falls Creek (Fig. 1), between 1984 and 1987.(b)Flow
dura-tion curves for Watchbed Creek and Simmons Creek, which drains the eucalyptus forest in the Upper Ovens (Fig. 1). Data are from the Department of Environment, Land, Water and Planning (2016).
eter PVC piezometer with a∼20 cm screen pushed directly into the peat. The piezometer was inserted to the maximum possible extent (i.e. until resistance prevented it from being pushed deeper). Field observations indicated that this was at or close to the base of the peat and within the hemic zone and catotelm. At least three bore volumes of water were extracted prior to sampling.
Tritium activities (Table 1) were measured on water sam-ples that had been vacuum distilled and electrolytically en-riched using liquid scintillation spectrometry (Quantulus ultra-low-level counters) at Geological and Nuclear Sci-ences, New Zealand (Morgenstern and Taylor, 2009). The3H
activities are expressed in tritium units (TUs) where 1 TU represents a 3H/1H ratio of 1
×10−18. Enrichment of 3H
was by a factor of 95, which results in a detection limit of 0.02 TU, while the use of deuterium calibration for each sam-ple results in a 1 % reproducibility of the tritium enrichment. Precision (1σ )is∼1.8 % at 2 TU.
Major ion concentrations (Table 1) were measured at Monash University using a Thermo Finnigan ICP-OES (cations), Thermo Finnigan ICP-MS (Si), and a Thermo Fisher ion chromatograph (anions). Samples for cation and
Si analysis were filtered through 0.45 µm cellulose nitrate filters and acidified to pH < 2 using double-distilled 16M HNO3. Samples for anion analysis were filtered but unacid-ified. The precision of the major ion concentrations deter-mined by replicate analyses of samples is±2 % and the ac-curacy as determined by analysis of certified water standards is±5 %.
Stable isotope ratios of water (Table 1) were determined using a Thermo Finnigan DeltaPlus Advantage mass spec-trometer at Monash University. A Thermo Finnigan Gas Bench was used for the18O analyses. Waters were
equili-brated with He-CO2at 32◦C for 24 to 48 h and the gas
subse-quently analysed by continuous flow. A Thermo Finnigan H-Device was used for the2H analyses. H was produced from water via reaction with Cr at 850◦C and analysed by
dual-inlet measurement. Internal standards that have been cali-brated using IAEA SMOW, GISP, and SLAP standards were employed to normalise theδ18O andδ2H values (following
Coplen, 1988). Theδ18O andδ2H values are expressed in ‰
relative to V-SMOW with a precision (1σ )determined from
replicate analyses of samples of±0.1 ‰ (δ18O) and ±1 ‰
(δ2H). The deuterium (D) excess is defined asδ2H – 8δ18O
(Clark and Fritz, 1997).
Catchment areas (Table 1) were estimated from Google Earth satellite images (Fig. S1a to c) and 1 : 30 000 topo-graphic map sheets on which the streams are clearly distin-guished. Attempts to define catchment areas using a digital elevation model (DEM) did not reproduce the drainage pat-tern in the peatlands due to the low topography relative to the DEM resolution.
2.3 Estimating mean transit times using3H
Water flowing through aquifers or soils follows flow paths of varying length, and thus the water discharging into streams or sampled from bores has a range of transit times (McGuire and McDonnell, 2006). Mean transit times were calcu-lated using lumped parameter models (Małoszewski, 2000; Małoszewski and Zuber, 1982; Zuber et al., 2005) as imple-mented in the TracerLPM Excel workbook (Jurgens et al., 2012). For steady-state groundwater flow, the3H activity in
water at the catchment outlet at the time of sampling (Co(t))
may be estimated using the convolution integral:
Co(t )= ∞ Z
0
Ci(t−τ )g (τ ) e−λτdτ. (1)
In Eq. (1),Ci is the3H activity of recharge,τ is the transit
time,t–τ is the time when water entered the catchment,λis
the3H decay constant (0.0563 yr−1), andg(τ) is the response
function that describes the distribution of transit times in the flow system.
As discussed above, the use of single3H activities to
I. Cartwright and U. Morgenstern: Transit times in the Australian Alps 4763 were considered in this study: the exponential flow model,
the exponential-piston flow model, and the dispersion model. Together these represent the most commonly used lumped parameter models in determining mean transit times (e.g. as reviewed by McGuire and McDonnell, 2006). In catchments where time series data are available, these models gener-ally reproduce the predicted variation in 3H activities over
time (e.g. Małoszewski and Zuber, 1982; Małoszewski et al., 1983; Zuber et al., 2005; Stewart et al., 2007; Morgenstern et al., 2015).
The exponential flow model predicts transit times in ho-mogeneous unconfined aquifers of constant thickness with uniform recharge where water from the entire aquifer dis-charges to the stream or is sampled by a bore. Flow through aquifers where flow paths are the same length and no mixing occurs results in all water discharging to the stream at any given time having the same transit time and is described by the piston flow model. Transit times in aquifers that have re-gions of both piston and exponential flow are described by the exponential-piston flow model, for which the response function is
g (τ )=0 forτ <τm(1−f ) (2a) g (τ )=(f τm)−1e−τ/f τm+1/f−1 forτ >τm(1−f ), (2b)
whereτmis the mean transit time andf is the proportion of
the aquifer volume that exhibits exponential flow. Atf =1,
this model becomes the exponential flow model, while at
f =0, it becomes the piston flow model. TracerLPM
speci-fies the ratio of exponential to piston flow as the EPM ratio (equivalent to 1/f−1).
The dispersion model is based on the solution to the one-dimensional advection–dispersion transport equation. The response function for the dispersion model is
g (τ )= 1
τ√4π DPτ/τme −
(1−τ/τm)2
4DPτ/τm
, (3)
where DP is the dispersion parameter defined as DP=D /(vx), where D is the dispersion coefficient
(m2day−1),v is velocity (m day−1), andx is distance (m).
This model is generally considered to be a less realistic representation of flow systems; however, it does commonly reproduce the observed distribution of tracers (Małoszewski, 2000).
In this study, mean transit times were calculated by match-ing the predicted3H from the lumped parameter model to the measured value at the time of collection using TracerLPM. For these calculations, the form of the lumped parameter model and its parameters (i.e. the EPM ratio orDP)and the 3H input function were specified.
3 Results
This section presents the streamflow and geochemistry data (Table 1) from the Victorian Alps; interpretation of these data appears in later sections.
3.1 Streamflow
As noted above, very few streamflow measurements exist in these catchments. Watchbed Creek drains the peatlands at Falls Rocky A (Fig. S1b) and there is a near-complete streamflow record for this site between 1940 and 1986. The average discharge for Watchbed Creek over that time period was 5.64×10⁶m3yr−1(Department of Environment, Land,
Water and Planning, 2016). For the average annual rainfall of 1.25 m yr−1 (Bureau of Meteorology, 2016), the runoff
co-efficient (i.e. the volume of rainfall that is exported by the stream) was 78 %. This is much higher than the runoff co-efficients in the eucalypt-dominated catchments of the up-per Ovens Valley which range from 6 to 64 % (Cartwright and Morgenstern, 2015). That Watchbed Creek exports more rainfall than streams from the eucalypt forests is also ap-parent in the flow duration curves (Fig. 2b). Relative dis-charges from Watchbed Creek are around an order of mag-nitude higher than those from Simmons Creek in the upper Ovens catchment. Simmons Creek has a slightly larger catch-ment area (6 km2 vs. 3.5 km2)and receives similar rainfall
but drains eucalypt forest. 3.2 Stable isotope ratios
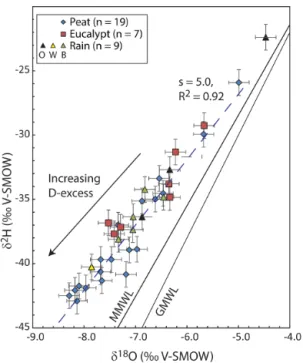
Stable isotope ratios are presented in Table 1 and Fig. 3. Rainfall has δ18O values of−7.9 to−6.5 ‰ andδ2H
val-ues of−40 to−34 ‰. Theδ18O andδ2H values of the
peat-land water range from−8.3 to−5.0 and−43 to−26 ‰, re-spectively. The eucalyptus forest streams have smaller ranges ofδ18O andδ2H values (−7.4 to−5.7 and−38 to−29 ‰,
respectively). As is commonly the case in southeast Aus-tralia (Cartwright et al., 2012; Leaney and Herczeg, 1999), theδ18O andδ2H values of all waters including rainfall lie
to the left of the global and Melbourne meteoric water lines. Overall, the waters define an array with a slope of∼5 and haveD excess values between 14 and 24 ‰ with a median
of 19 ‰. TheseDexcess values are significantly higher than
the meanDexcess of the Melbourne meteoric water line of
9.6 ‰ (Hughes and Crawford, 2012). 3.3 Tritium activities
The3H activities of three multi-month rainfall samples from
Mount Buffalo are 2.85 TU (12-month sample collected in February 2015), 2.88 TU (9-month sample collected in November 2015), and 2.99 (17-month sample collected in December 2013) (Table 1). Three samples of rainfall col-lected over periods of 2 weeks to 3 months in 2014 also from Mount Buffalo have3H activities of 2.52 to 2.90 TU
Figure 3. δ18O vs. δ2H values of waters from the Australian
Alps (data from Table 1) relative to the global meteoric water line (GMWL: Clark and Fritz, 1997) and the Melbourne meteoric wa-ter line (MMWL: Hughes and Crawford, 2012). Each data point represents an individual sample collected on the date indicated in Table 1. Error bars are analytical uncertainties (0.2 ‰ forδ18O and 1 ‰ forδ2H). Rainfall samples: B indicates Mount Buffalo
multi-month samples; W indicates the 2-week winter precipitation sam-ple; O indicates other samples from southeast Australia. Dashed line (slope,S=5) is fit to all of the data by linear regression.
(Table 1). The sample with the lowest3H activity represents
mainly snow and low-temperature rainfall collected over a 2-week period in July 2014. The3H activities are within the
expected range of3H activities in rainfall for this region of
2.8 to 3.2 TU (Tadros et al., 2014). Aside from the July 2014 rainfall sample that represents the 2 weeks of winter precip-itation, there is an inverse correlation (R2=0.69) between
the3H activities andδ2H of rainfall (Fig. 4). Since the
rain-fall with the higherδ2H values has lowerD excess values,
there is also a correlation between Dexcess and3H
activi-ties. Rainfall from elsewhere in southeast Australia defines broadly similar trends inδ18O vs.δ2H values andδ2H vs.3H
values (Table 1; Figs. 3, 4).
The peatland waters have3H activities that vary from 2.70
to 3.32 TU (median=2.75 TU) at Mount Buffalo, 2.90 to 3.17 (median=3.04 TU) at Falls Creek, and 2.47 to 3.36 (median=2.77 TU) at Dargo (Table 1; Figs. 4, 5). The me-dian3H activity of the peatland waters as a whole is 2.88 TU.
The 3H activities of the peatland water from the three sites
are closely similar. Additionally, there are no significant dif-ferences in 3H activities of water collected from within the
peat and that collected from the streams draining the peat. The 3H activities of waters collected in February 2015 and
Figure 4.3H activities vs.δ2H values of waters from the Australian
Alps (data from Table 1). Error bars are analytical uncertainties (1 ‰ forδ2H and3H from Table 1). Rainfall samples: B indicates
Mount Buffalo multi-month samples; W indicates the 2-week win-ter precipitation sample; O indicates other samples from southeast Australia. Linear regression line is fit to the multi-month Mount Buffalo samples. Arrowed lines show changes in3H activities and
δ2H values due to evaporation (evap) and radioactive decay of3H.
those collected in November 2015 also overlap. The3H ac-tivities of the peatland waters are locally higher than those of the rainfall samples and several of those waters also have lowerδ2H values and higher D excesses than the rainfall
(Figs. 3, 4).
The eucalyptus forest streams have 3H activities of
be-tween 1.56 and 2.35 TU (median=2.10 TU) (Table 1; Figs. 4, 5) that are lower than those of the peatland wa-ters. The3H activities of the eucalyptus streams overlap with
those of river water from the streams in the upper Ovens catchment at low flow conditions in December 2013 and February 2014, which range from 1.63 to 2.28 TU (me-dian=2.09 TU) (Cartwright and Morgenstern, 2015; Fig. 5). 3.4 Major ion geochemistry
Cl concentrations of the peatland waters are between 0.5 and 1.1 mg L−1, which are similar to those of rainfall from
Mount Buffalo (0.8 to 1.1 mg L−1)(Fig. 5a, Table 1).
Peat-land water from Falls Creek has lower Cl concentrations (0.5 to 0.9 mg L−1)than that from the other areas; however, there
is no significant difference between the Cl concentrations of the water extracted from within the peat and that drain-ing the peatlands. Na concentrations of the peatland water range from 0.8 to 2.1 mg L−1, which are higher than those
for-I. Cartwright and U. Morgenstern: Transit times in the Australian Alps 4765 0.0 1.0 2.0 3.0 4.0 5.0 6.0 0.0 1.0 2.0 3.0 4.0 5.0 6.0 7.0
0.0 1.0 2.0 3.0 4.0
Na/Cl (molar) Peat Eucalypt Rain Ovens 0 2 4 6 8 10 12 0.0 0.5 1.0 1.5 2.0 2.5 3.0 3.5 4.0 Cl (mg L -1)
0.0 1.0 2.0 3.0 4.0
Na (mg L -1) Si (mg L -1)
3H (TU)
W e a thering W e a thering E T W e a
thering / ET
(b)
(e)
(a)
(d)
(c)
0 100 200 300 400 500 600 700 800 Cl/Br (molar) 0 2 4 6 8 10 12 Si/Cl (molar)
0.0 1.0 2.0 3.0 4.0
(f)
W
e
a
thering
HomogenisaƟon
R2 = 0.32
R2 = 0.05 R2 = 0.87
R2 = 0.24 R2 = 0.46
R2 = 0.15
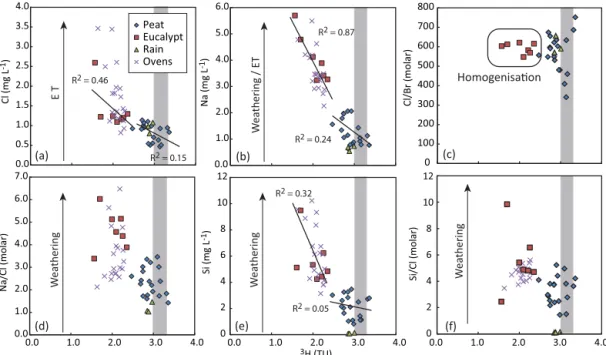
Figure 5.3H activities vs. Cl(a), Na(b), Si(e)concentrations and Cl/Br(c), Na/Cl(d), Si/Cl(f)ratios (data from Table 1). Arrowed lines illustrate trends expected from major geochemical processes. Ovens data are from the upper Ovens Valley streams in December 2013 and February 2014 (Cartwright and Morgenstern, 2015); the geochemistry of these larger streams is similar to the eucalypt forest streams in the Victorian Alps.
est streams have higher Cl (1.1 to 2.6 mg L−1)and Na (3.2
to 5.7 mg L−1)concentrations than any of the peatland
wa-ter (Fig. 5a, b). Molar Na/Cl ratios range from 1.7 to 3.5
in the peatland water and 3.9 to 6.8 in the eucalypt forest streams (Fig. 5d). These Na/Cl ratios are higher than those
of Buffalo rainfall, which has Na/Cl ratios of 1.0 to 1.1 that
are similar to those generally recorded in southeast Australia (Blackburn and McLeod, 1983; Crosbie et al., 2012).
Molar Cl/Br ratios vary between 340 and 650 in the
peat-land water and between 550 and 780 in the eucalypt forest streams (Fig. 5c). These ratios are similar to those of Buffalo rainfall (570 to 650) and also similar to the ocean Cl/Br
ra-tio of∼650 (Davis et al., 1998). Other cation/Cl ratios are
higher in the eucalypt forest streams compared with the peat-land water, and the water from both these sources has higher cation/Cl ratios than rainfall. Si concentrations in Buffalo
rainfall are < 0.1 mg L−1 (Fig. 5e) and molar Si/Cl ratios
are∼0.1 (Fig. 5f). By contrast, Si concentrations and Si/Cl
ratios in the peatland water and eucalypt forest streams are significantly higher (up to 9.8 mg L−1and 9.5, respectively;
Fig. 5e, f).
There are broad inverse correlations between 3H
activi-ties and the Na, Cl, and Si concentrations and the Na/Cl
and Si/Cl ratios (Fig. 5). In general, the differences in
geo-chemistry between the peatland water and eucalypt forest streams are more marked than the geochemical variations within those groups. For example, the Si vs.3H trend for the
combined peatland water and eucalypt forest streams has an
R2of 0.63, whereasR2values for Si vs.3H in the peatland
water and the eucalyptus forest streams are 0.05 and 0.32, re-spectively. The correlations between major element concen-trations and3H activities are stronger in the eucalypt forest
streams (R2values of 0.32 to 0.87) than in the peatland
wa-ters (R2values of 0.05 to 0.24). The trends in3H activities
vs. major ion concentrations or ratios in the eucalyptus forest streams from the Victorian Alps are similar to those of the upper Ovens catchment as a whole (Fig. 5).
4 Discussion
This section combines the major ion geochemistry, stable isotope data, and3H activities to determine the mean transit
times of the waters from the peatlands and eucalyptus forest streams and assesses the major geochemical processes that impact these waters.
4.1 Modern rainfall3H activities
Understanding the3H activities of the water that recharges
the catchments is critically important in estimating mean transit times. The three longer-term (9- to 17-month) rain-fall samples have3H activities of between 2.85 and 2.99 TU,
which lie within the predicted3H activity of rainfall in this
area of 2.8 to 3.2 TU (Tadros et al., 2014). However, the ob-servation that the peatland water has 3H activities that are
locally up to 3.35 TU indicates that it is not possible to use
the rainfall3H activities as the3H activity of recharge for all
of the peatland waters.
There may be spatial variations in rainfall3H activities,
es-pecially between the three areas. The observation, however, that peatland water at Mount Buffalo from < 5 km from the rainfall gauge has a3H activity of up to 3.32 TU suggests that
this cannot be the only explanation. The higher3H activities
in the peatland waters potentially reflect preferential recharge by spring rainfall. Maximum3H activities in Australian
rain-fall are recorded in early spring (August to September) as this is the time of maximum transport of water vapour with high 3H activities from the stratosphere to the troposphere (Tadros et al., 2014). Stratospheric moisture also has lower
δ2H values and higherD excesses than tropospheric
mois-ture (Bony et al., 2008). Thus, the variation in the relative ratios of stratospheric to tropospheric moisture would also explain the observations that rainfall samples with higher3H
activities have lowerδ2H values (Fig. 4) and higherDexcess
values (Fig. 3).
Some peatland waters have lower δ2H values than those
of the rainfall. These potentially record recharge by rainfall that has a high proportion of lowδ2H stratospheric moisture.
Such rainfall would also be expected to have higher 3H
ac-tivities than average rainfall. While it is difficult to precisely constrain the3H of seasonal recharge, extending the rainfall δ2H vs.3H trend defined by the Mount Buffalo rainfall
sam-ples in Fig. 4 to the lowestδ2H value of the peatland waters
(−43 ‰) yields a3H activity of∼3.4 TU, which is similar to the highest 3H activities recorded in the peatland waters. This is ∼14 % higher than the 3H activities of the rainfall
samples, which is well within the seasonal variation of 3H
activities of Australian rainfall (Tadros et al., 2014).
The reason that some of the peatland waters with high3H
activities have higherδ2H values is likely due to subsequent
evaporation (Fig. 4). As discussed below, the major ion geo-chemistry also implies that evaporation has affected these waters. Evaporation at a humidity of 50 to 70 %, which is characteristic of these Alpine areas in summer (Bureau of Meteorology, 2016), produces arrays of δ18O andδ2H
val-ues with slopes of 4 to 5 (Clark and Fritz, 1997). Thus, the
δ18O andδ2H values of the waters (Fig. 3) probably reflects
both initial variations in stable isotope ratios and subsequent evaporation. Assuming that the mass-dependant isotope frac-tionation of3H/1H is approximately double that of2H/1H,
a 10 ‰ increase inδ2H values would equate to a∼2 %
in-crease in3H activities, which is approximately the analytical
precision.
4.2 Mean transit times
Mean transit times (Table 2; Fig. 6a) were initially calculated using an exponential-piston flow model with an EPM ratio of 0.33 via Eqs. (1) and (2). The soils and shallow aquifers are unconfined and likely to exhibit exponential flow below the water table; however, recharge through the unsaturated
1 1.2 1.4 1.6 1.8 2 2.2 2.4 2.6 2.8 3 3.2 3.4 3.6
0.1 1 10
0 5 10 15 20 25 30 35 40
Preferred model
DM (0.1) DM (1.0) EM EPF (0.33) EPF (1.0)
Mean transit time (years) 3H (
TU)
4.5 years
13 years (a)
3.4 3.2 3.0 (b)
Peat
Eucalypt
1 1.2 1.4 1.6 1.8 2 2.2 2.4 2.6 2.8 3 3.2 3.4 3.6
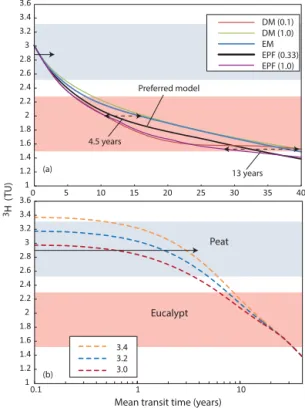
Figure 6.Comparison of mean transit times from different lumped
parameter models calculated using Eqs. (1) to (3) assuming a3H activity of recharge of 3.0 TU (based on the rainfall samples). DM indicates dispersion model withDPvalues of 0.1 and 1.0; EM
in-dicates exponential flow model; EPF inin-dicates exponential-piston flow model with EPM ratios of 0.33 and 1.0.(b)Mean transit times
from the exponential flow model (EPM ratio of 0.33) with3H ac-tivities of modern recharge ranging from 3.0 to 3.4 TU. Shaded fields show3H activities in the peatland waters and eucalyptus for-est streams; arrow is the median3H activity in the peatland waters (data from Table 1).
zone will most likely resemble piston flow. A similar flow model successfully reproduces time series of3H activities
in upland catchments in New Zealand (Morgenstern et al., 2010). Given that the waters were sampled at baseflow con-ditions during the late spring or summer, which represent the driest months, it was assumed that there was a single store of water present rather than a mixture of recent rainfall and older water. While the exponential-piston flow model plausi-bly represents the flow systems, it is not possible to indepen-dently test its veracity. Hence, mean transit times were also calculated using the exponential flow model with a higher proportion of piston flow (EPM ratio of 1), the exponential flow model, and the dispersion model withDP=0.1 and 1.0
which are appropriate values for flow systems of this scale (Małoszewski, 2000) (Table 2; Fig. 6a).
The annual average3H activities of rainfall in Melbourne,
I. Cartwright and U. Morgenstern: Transit times in the Australian Alps 4767 Table 2.Calculated mean transit times.
Sitea Date Mean transit time (yr)
LPMb EPF (3.4)c EPF (3.2) EPF (3.0) EPF (3.4) EM (3.4) DM (3.4) DM (3.4)
Parameterd 0.3 0.3 0.3 1 0.1 1
Peatlands Mount Buffalo
Buffalo Cresta A 26/11/2015 < 1 NDe ND < 1 < 1 < 1 < 1 Buffalo Cresta A 23/02/2015 3.4 2.2 1.0 3.3 3.5 2.7 4.0 Buffalo Cresta B(P) 23/02/2015 4.1 2.9 1.6 3.9 4.4 3.9 4.9 Buffalo Cresta C 23/02/2015 4.1 2.9 1.6 3.9 4.4 3.9 4.9 Buffalo Cresta D(P) 26/11/2015 4.4 3.2 1.9 4.2 4.8 4.2 5.4 Buffalo Crystal A 23/02/2015 4.2 3.0 1.7 3.9 4.4 3.9 5.3 Buffalo Crystal B 23/02/2015 2.8 1.6 < 1 2.7 2.9 2.8 3.3 Falls Creek
Falls Cope 24/02/2015 1.4 < 1 ND 1.4 1.5 1.4 1.5 Falls Langford A 24/02/2015 1.7 < 1 ND 1.7 1.7 1.7 1.9 Falls Langford B(P) 24/02/2015 2.4 1.3 < 1 2.4 2.5 2.4 2.9 Falls Rocky A 24/02/2015 2.6 1.4 < 1 2.5 2.7 2.5 3.0 Falls Rocky A 25/11/2015 3.0 1.8 < 1 2.9 3.1 2.9 3.5 Falls Rocky B(P) 25/11/2015 3.3 2.1 < 1 3.2 3.5 3.2 3.9 Falls Rocky C(P) 25/11/2015 1.3 < 1 ND 1.3 1.3 1.3 1.4 Falls Rocky D 25/11/2015 1.4 < 1 ND 1.4 1.5 1.4 1.5 Dargo
Dargo A 25/11/2015 3.4 2.2 1.0 3.3 3.6 3.2 4.0 Dargo B 25/11/2015 4.5 3.3 2.0 4.3 4.9 4.3 5.6 Dargo C(P) 25/11/2015 6.5 5.4 4.0 6.0 7.4 6.0 8.0 Dargo D 25/11/2015 < 1 ND ND < 1 < 1 < 1 < 1 Eucalypt forest
Falls Forest A 24/02/2015 28.9 28.8 28.6 26.0 39.0 37.2 40.2 Falls Forest B 24/02/2015 11.5 10.8 9.6 9.9 16.4 10.0 17.7 Buffalo Forest A 24/02/2015 9.7 8.8 7.5 8.7 13.0 8.6 14.7 Falls Forest C 25/11/2015 9.1 8.1 6.6 8.0 11.3 7.9 13.2 Falls Forest D 25/11/2015 22.6 22.2 21.6 17.2 30.7 16.7 31.4 Dargo Forest A 25/11/2015 14.0 12.4 11.2 11.3 18.8 11.1 19.6 Buffalo Forest A 26/11/2015 7.8 6.9 5.3 7.0 9.4 7.0 10.8
aSites in Fig. S1 and S1.bLumped parameter model (DM indicates dispersion model; EM indicates exponential flow model; EPF indicates exponential-piston flow model).cAssumed3H activity of modern recharge in brackets.dEPM orDPparameter.eNot determined as3H activity higher than assumed value of recharge.
al. (2014), were used as the3H input. Rainfall3H activities
reached∼62 TU in 1965 and then declined exponentially to present-day values (Tadros et al., 2014). The calculations ini-tially adopted a present-day3H activity of recharge of 3.4 TU
(as discussed above). A3H activity of 3.4 TU was also used for recharge from prior to the atmospheric nuclear tests.
Mean transit times from the exponential-piston flow model with an EPM ratio of 0.33 are up to 6.4 years with a me-dian of 3.0 years (Table 2). For the range of 3H activities
in these peatland waters, similar mean transit times are es-timated from the different lumped parameter models (Ta-ble 2; Fig. 6a). The exponential-piston flow model with an
EPM ratio of 1 yields mean transit times of up to 6.0 years with a median of 2.9 years. The exponential flow model pro-duces mean transit times of up to 7.4 years with a median of 3.1 years. The dispersion model yields mean transit times of up to 6.0 years with a median of 2.8 years (DP=0.1) and
8.0 years with a median of 3.5 years (DP=1.0).
For a water with a3H activity of 3 TU, propagating the an-alytical uncertainty of±2 % produces an uncertainty in mean transit times of±0.3 years. Uncertainties in calculated mean transit times for the high3H samples mainly arise from the
assumed3H activity of the recharging water (Fig. 6b), which,
as discussed above, is difficult to constrain precisely. This
Figure 7.3H activities vs. catchment areas for the peatlands and eu-calyptus forest catchments. Area error bars assume a±10 %
mea-surement error;3H error bars are from the analytical uncertainties. Data are from Table 1.
will be illustrated for the exponential-piston flow model with an EPM ratio of 0.33, but similar variations would be ob-served for the other models. Utilising a3H activity of 3.0 TU for modern and pre-bomb-pulse rainfall based on the3H ac-tivities of the rainfall samples (Table 1) yields mean transit times of up to 4.0 years with a median of < 1 year (Table 2). However, in this case a large number of peatland waters have
3H activities that are higher than the rainfall activities and for
those waters a3H activity of 3.0 TU for the recharging
wa-ter is not realistic. Adopting a3H activity of 3.2 TU, which
is the upper limit of the estimate for annual rainfall in this area (Tadros et al., 2004) yields mean transit times of up to 5.4 years with a median of 1.8 years. In this case, two peat-land waters (Dargo D and Buffalo Cresta A) have3H
activi-ties that are higher than the assumed recharge3H activities.
Given the likelihood that seasonal recharge has occurred, and thus that the3H activity of the recharging water may be
lo-cally variable, it is unrealistic to differentiate mean transit times of < 1 year.
By contrast with the peatland waters, the eucalypt forest streams have much longer mean transit times that are rel-atively insensitive to the assumed 3H activity of recharge
(Fig. 6b). For the exponential-piston flow model with an EPM ratio of 0.33 and a modern and pre-bomb-pulse rainfall activity of 3.0 TU (which assumes recharge has the3H
ac-tivity of average rainfall), mean transit times range from 5.3 to 28.6 years with a median of 9.5 years (Table 2). Adopting a3H activity for recharge of 3.2 TU, the mean transit times
range from 6.9 to 28.8 years with a median of 10.8 years and if the 3H activity of recharge was 3.4 TU, the mean transit
times are 7.8 to 28.9 years with a median of 11.5 years. These
Binary mix
0 10 20 30 40 50
0 10 20 30 40 50
Actual mean transit time (years)
Apparent mean transit time (years)
Multicomponent
Figure 8.Impact of aggregation on calculated mean transit times. Apparent mean transit times are calculated from the3H activities of mixtures of waters with actual mean transit times of between 10 and 50 years using the exponential-piston flow model with an EPM ratio of 0.33. Actual mean transit times are calculated from the weighted average mean transit times in the mixed water. The binary curve rep-resents variable mixtures of the two end-members, the shaded field represents mixtures of multiple waters with mean transit times be-tween 10 and 50 years. The red line represents agreement bebe-tween apparent and actual mean transit times.
mean transit times are within the range of those of the much larger (6 to 1240 km2)catchments in the upper Ovens Valley
that are also dominated by eucalypt forest. Mean transit times of river water in December 2013 and February 2014 in the upper Ovens Valley calculated using the same exponential-piston flow model and a3H activity of recharge of 3.0 TU are 7 to 30 years (Cartwright and Morgenstern, 2015).
For the eucalypt forest streams, there are larger uncertain-ties in mean transit times produced by the different lumped parameter models (Table 2; Fig. 6a). The range in mean tran-sit times for a water with a3H activity of 2 TU calculated
from the exponential flow model, the exponential-piston flow model with EPM ratios of 0.33 and 1, and the dispersion model withDP=0.1 andDP=1 is∼4.5 years. For a
wa-ter with a 3H activity of 1.5 TU, the range in mean
tran-sit times from those models is∼13 years. Uncertainties as to the most appropriate lumped parameter model thus repre-sent a significant source of uncertainty in these calculations. However, overall, the water in these streams has mean transit times of years to decades and is significantly older than that from the peatlands. Propagating the analytical uncertainty in
3H activities (Table 1) also results in uncertainties in mean
transit times of±0.5 years for a water with a3H activity of 2 TU.
wa-I. Cartwright and U. Morgenstern: Transit times in the Australian Alps 4769 ter again using the exponential-piston flow model with an
EPM ratio of 0.33. The apparent mean transit times are less than the actual mean transit times with the greatest differ-ence (∼13 %) occurring when there are approximately equal proportions of two end-members with mean transit times of 10 and 50 years. The difference between actual and apparent mean transit times decreases when multiple end-members are aggregated (shaded field). For example, the apparent mean transit time calculated from an equal mixture of nine wa-ters with transit times of 10, 15, 20, 25, 30, 35, 40, 45, and 50 years is 28.9 years, which is within 4 % of the actual mean transit time of 30 years. The relative difference between ap-parent and actual mean transit times are similar when other lumped parameter models are used. Mixing waters with a range of mean transit times between 1 and 5 years (which would be appropriate for the peatland waters) produces sim-ilar relative differences. Thus, aggregation introduces uncer-tainties that are of similar order of magnitude to those re-sulting from other uncertainties in the calculations (discussed above).
There are uncertainties in the calculated mean transit times resulting from uncertainties in the 3H activity of recharge,
the most appropriate lumped parameter model, and aggre-gation. However, the conclusion that the mean transit times of water in the eucalypt forest catchments range from sev-eral years to decades and are significantly longer than those in the peatlands remains robust. Mean transit times of the peatland waters are unlikely to be more than a few years and may be mainly less than 2 years depending on the3H activ-ity of recharge. As noted above, the3H activities of the water
from the piezometers in the peatlands are similar to the water that drains the peat. The water that drains the peat is likely de-rived mainly from the acrotelm (Western et al., 2009; Grover and Baldock, 2013). Presuming that the piezometers which were inserted into the lower levels of the peat sampled water from the catotelm, this observation implies that the catotelm is not a store of older water.
4.3 Major ion tracers
The major ion geochemistry allows the main geochemical processes to be understood and also can provide first-order estimates of mean transit times. Overall, the observation that the peatland water and the eucalypt forest streams have molar Cl/Br ratios that cluster around those of the rainfall implies
that, in common with the majority of groundwater and sur-face water in southeast Australia, the vast majority of Cl is derived from the rainfall and concentrated by evapotranspi-ration (Cartwright et al., 2006; Herczeg et al., 2001). Other potential sources of Cl (such as dissolution of halite in the unsaturated zone) produce water with high Cl/Br ratios and
can thus be discounted.
The higher Cl concentrations in the eucalypt forest streams compared with that from the peatland water reflects higher net evapotranspiration rates in the eucalypt forest
catch-ments. Some of the increase in the concentration of the other major ions (such as Na) in the eucalypt forest streams and peatland water over those in rainfall will also be due to evap-otranspiration. The adsorption of Br by organic matter (Ger-ritse and George, 1988) may locally increase Cl/Br ratios
if the pool of organic matter is increasing. By contrast, a net degradation of organic matter releases Br, producing lower Cl/Br ratios. The wider range of Cl/Br ratios in the
peat-land water may reflect that, locally, the volume of organic matter is increasing, whereas elsewhere it is degrading. The far more homogeneous Cl/Br ratios in the eucalypt forest
streams indicate that either the organic matter content of those catchments is relatively stable or that the waters are better mixed and any local variations in Cl/Br ratios have
been homogenised. This homogenisation is consistent with longer mean transit times in the eucalypt forest streams.
The increase in cation/Cl and Si/Cl ratios in the peatland
and eucalypt forest waters over those in rainfall is interpreted to be due to silicate weathering (cf., Herczeg and Edmunds, 2000). As rainfall contains < 0.1 mg L−1Si,
evapotranspira-tion will not increase Si concentraevapotranspira-tions appreciable and the vast majority of the Si will be derived from silicate weath-ering. The eucalypt forest streams have higher cation/Cl
and Si/Cl ratios compared with the peatland water and thus
records higher degrees of weathering. This is likely due to two factors. Firstly, the eucalypt forest catchments are de-veloped on weathered regolith and the flow of water through the regolith will promote mineral dissolution. Common min-erals in the regolith include plagioclase and alkali feldspars (Cartwright and Morgenstern, 2012) and the dissolution of these will provide Si, Na, Ca, and K. By contrast, the peat-lands are developed on less weathered rocks, which limits the potential for mineral dissolution; although there clearly has been sufficient weathering to produce the elevated cation/Cl
and Si/Cl ratios. There is commonly a thin (< 20 cm thick)
layer of regolith at the base of the peat and fragments of base-ment rock within the lower layers of the peat that are likely being weathered by the peatland water. Secondly, the longer mean transit times in the eucalypt forest catchments allow the silicate weathering reactions to progress further than in the peatlands.
4.4 Controls on mean transit times
As with the Ovens catchment as a whole, there is no cor-relation between 3H activities and catchment areas either
within or between the eucalypt forest and peatland catch-ments (Fig. 7). Elsewhere, inverse correlations between catchment slope and mean transit times have been docu-mented (McGuire et al., 2005). Catchment slopes have not been calculated in this study (and would be difficult do so in the peatlands given the limitations of the DEM). However, the observation that the eucalypt forests occur in gullies that invariably have steeper slopes than the peatlands but contain water with longer mean transit times indicates that, in this
case, catchment slopes cannot explain the difference in mean transit times between the two catchment types.
The difference in the mean transit times between the peat-land water and the eucalypt forest streams is likely the com-bination of two factors. Firstly, the high evapotranspiration rates of the eucalypt forests (Allison et al., 1990) results in low recharge rates that in turn increase the transit times. Sec-ondly, differences in the depth of weathering in the catch-ments and the development of deeper flow paths is also likely to be important. Most of the peatlands are developed on rel-atively unweathered basement rocks and the majority of the water is stored within the peat itself (Grover and Baldock, 2013; Western et al., 2009). Given that most of the peat is < 2 m thick, this results in a shallow reservoir of water un-derlain by bedrock with very low hydraulic conductivities. By contrast, groundwater flow in the eucalypt gullies is par-tially hosted in weathered regolith that is locally several me-tres thick. The gullies may be developed where weathering is greater due to the presence of joints and/or faults that will also host groundwater flow (Shugg, 1987). The presence of weathered and fractured bedrock on steep slopes conceivably allows long groundwater flow paths to develop that will in-crease transit times.
The correlation between major ion concentrations and3H
activities may allow a first-order estimate of relative mean transit times to be made, which is useful in extending stud-ies such as this to adjacent catchments. Caution must be ex-ercised, however, in using the data sets as a whole, as the geochemistry may partially reflect differences in the char-acteristics of the peatland and eucalypt forest catchments (specifically whether the water flows through the regolith or is contained within the peat) rather than solely the mean tran-sit times. Nevertheless, in the catchments studied here there are broad correlations between3H activities and major ion
concentrations within both the peatland water and the euca-lypt forest streams, which would permit estimates of relative mean transit times.
Streamflow (Q) is related to the mean transit time
(MTT) and the volume of water held in storage (V) via Q=V /MTT (Małoszewski and Zuber, 1982). This
relation-ship is commonly used to estimateV where MTT has been
calculated andQmeasured (e.g. Morgenstern et al., 2010).
However, in ungauged peatland catchments such as these it is possible to estimateQif the volume of peat can be
esti-mated and MTT is known. The area drained by the stream at Falls Rocky A is 3.5×10⁶m2and for a peat thickness of
0.5 to 1 m, which is consistent with observations at this site,
V =1.75 to 3.5×10⁶m3. Adopting a range of mean
tran-sit times of 0.5 to 2.5 years (Table 2) yields estimates ofQ
of 7.0×10⁵to 7.0×10⁶m3yr−1, which span the measured
average discharge of 5.64×10⁶m3yr−1. Presuming that the
parameterisation is appropriate, the correspondence between calculated and observed streamflows occurs when mean tran-sit times are < 1 year, which suggests that the3H activities of
rainfall that recharges the peat are not significantly higher
than those discussed above. Carrying out these calculations on the Victorian peatland water is difficult asQtends to∞
as the MTT approaches 0. In ungauged peatland catchments where mean transit times are longer, however, this would be a viable method of estimatingQ.
5 Conclusions
The mean transit times in peatland water in southeast Aus-tralia are less than 6.5 years and in many cases substantially shorter. The short mean transit times implies that the peat is susceptible to drying if there are successive years of below-average rainfall. In turn, this makes the peat vulnerable to damage during the periodic bushfires that also occur dur-ing the summers in drought periods. The majority of south-east Australia underwent a major drought (the “millennium drought”) between 1995 and 2010 (Bureau of Meteorology, 2016) during which time there were major bushfires in the Australian Alps, especially in 2003 and 2009. Although they mainly affected the eucalypt forests, locally these bushfires also impacted the peatlands (Arthur Rylah Institute, 2016).
The observation that the water from within the peat yields similar mean transit times to that draining the peat implies that there is not likely to be older water stored within the deeper layers. This may be because the peat in the Victo-rian Alps is shallow and consequently stores little water. The peatlands do not act as a long-lived store of water to the river systems. Given their small total area, there would be little impact of peatland drying to the hydrology of the lower reaches of the adjacent catchments. However, drying of the peat could impact the hydrology of the small upland streams that form an integral part of the landscape and ecosystems of the alpine areas. The observation that even in small eucalypt forest catchments the stream water has mean transit times of several years to decades indicates that they are likely to be more resilient to short-term variations in rainfall. As a whole, the river catchments in the Victorian Alps are eucalypt dom-inated, which implies that the river systems are likely to be sustained by baseflow even during prolonged drought peri-ods, and indeed many of these streams continued to flow through the millennium drought.
More generally, this study illustrates that the combination of3H and major ion geochemistry allows both the timescales