10.1101/gr.1532103
Access the most recent version at doi:
2003 13: 2725-2735
Genome Res.
André L. Vettore, Felipe R. da Silva, Edson L. Kemper, et al.
Collection for Tropical Crop Sugarcane
Analysis and Functional Annotation of an Expressed Sequence Tag
References
http://genome.cshlp.org/content/13/12/2725.full.html#ref-list-1
This article cites 47 articles, 20 of which can be accessed free at:
License
Commons
Creative
http://creativecommons.org/licenses/by-nc/3.0/.
described at
a Creative Commons License (Attribution-NonCommercial 3.0 Unported License), as
). After six months, it is available under
http://genome.cshlp.org/site/misc/terms.xhtml
first six months after the full-issue publication date (see
This article is distributed exclusively by Cold Spring Harbor Laboratory Press for the
Service
Email Alerting
click here.
top right corner of the article or
Receive free email alerts when new articles cite this article - sign up in the box at the
Analysis and Functional Annotation of an Expressed
Sequence Tag Collection for Tropical
Crop Sugarcane
Andre´ L. Vettore,
1,24Felipe R. da Silva,
1,25Edson L. Kemper,
1,26Glaucia M. Souza,
3Aline M. da Silva,
3Maria Ineˆs T. Ferro,
6Flavio Henrique-Silva,
8Éder A. Giglioti,
9Manoel V.F. Lemos,
7Luiz L. Coutinho,
10Marina P. Nobrega,
11Helaine Carrer,
10Suzelei C. Franc¸a,
12Maurı´cio Bacci Jr.,
13Maria Helena S. Goldman,
14Suely L. Gomes,
3Luiz R. Nunes,
15Luis E.A. Camargo,
10Walter J. Siqueira,
16Marie-Anne Van Sluys,
4Otavio H. Thiemann,
17Eiko E. Kuramae,
18Roberto V. Santelli,
3Celso L. Marino,
19Maria L.P.N. Targon,
20Jesus A. Ferro,
6,27Henrique C.S. Silveira,
8Danyelle C. Marini,
9Eliana G.M. Lemos,
6Claudia B. Monteiro-Vitorello,
10Jose´ H.M. Tambor,
11Dirce M. Carraro,
10,24Patrı´cia G. Roberto,
12Vanderlei G. Martins,
21Gustavo H. Goldman,
22Regina C. de Oliveira,
15Daniela Truffi,
10Carlos A. Colombo,
16Magdalena Rossi,
4Paula G. de Araujo,
4Susana A. Sculaccio,
17Aline Angella,
18Marleide M.A. Lima,
18Vicente E. de Rosa Jr.,
18Fa´bio Siviero,
3Virginia E. Coscrato,
19Marcos A. Machado,
20Laurent Grivet,
23Sonia M.Z. Di Mauro,
6Francisco G. Nobrega,
11Carlos F.M. Menck,
5Marilia D.V. Braga,
2,28Guilherme P. Telles,
2Frank A.A. Cara,
2Guilherme Pedrosa,
2Joa˜o Meidanis,
2and
Paulo Arruda
1,27,291
Centro de Biologia Molecular e Engenharia Gene´tica and
2Laborato´rio de Bioinforma´tica, Instituto da Computac¸a˜o, Universidade
Estadual de Campinas, 13083-970, Campinas–SP, Brazil;
3Departamento de Bioquı´mica, Instituto de Quı´mica,
4Departamento
de Botaˆnica, Instituto de Biocieˆncias, and
5Departamento de Microbiologia, Instituto de Cieˆncias Biome´dicas, Universidade de Sa˜o
Paulo, 05508-900, Sa˜o Paulo–SP, Brazil;
6Departamento de Tecnologia and
7Departamento de Biologia Aplicada a`
Agropecua´ria, Faculdade de Cieˆncias Agra´rias e Veterina´rias de Jaboticabal, Universidade Estadual Paulista, 14884-900,
Jaboticabal–SP, Brazil;
8Departamento de Gene´tica e Evoluc¸a˜o, Universidade Federal de Sa˜o Carlos, 13565–905 Sa˜o Carlos–SP,
Brazil;
9Departamento de Biotecnologia Vegetal, Centro de Cieˆncias Agra´rias, Universidade Federal de Sa˜o Carlos, 13600-970,
Araras–SP, Brazil;
10Escola Superior de Agricultura Luiz de Queiroz, Universidade de Sa˜o Paulo, 13418-900, Piracicaba–SP,
Brazil;
11Laborato´rio de Gene´tica Molecular e Genomas, Instituto de Pesquisa e Desenvolvimento, Universidade do Vale do
Paraı´ba, 12244-000, Sa˜o Jose´ dos Campos–SP, Brazil;
12Departamento de Biotecnologia de Plantas Medicinais, Universidade de
Ribeira˜o Preto, 14096-380, Ribeira˜o Preto–SP, Brazil;
13Centro de Estudos de Insetos Sociais, Instituto de Biocieˆncias,
Universidade Estadual Paulista, 13506-900, Rio Claro–SP, Brazil;
14Departamento de Biologia, Faculdade de Filosofia, Cieˆncias e
Letras de Ribeira˜o Preto, Universidade de Sa˜o Paulo, 14040-901, Ribeira˜o Preto–SP, Brazil;
15Nu´cleo Integrado de Biotecnologia,
Universidade de Mogi das Cruzes, 08780-911, Mogi das Cruzes–SP, Brazil;
16Centro de Gene´tica, Biologia Molecular e
Fitoquı´mica, Instituto Agronoˆmico de Campinas, Caixa Postal 28, 13001-970, Campinas–SP, Brazil;
17Instituto de Fı´sica de Sa˜o
Carlos, Universidade de Sa˜o Paulo, 13560-970, Sa˜o Carlos–SP, Brazil;
18Departamento de Defesa Fitossanita´ria, Faculdade de
Cieˆncias Agronoˆmicas, Universidade Estadual Paulista, 18603-970, Botucatu–SP, Brazil;
19Departamento de Gene´tica, Instituto
de Biocieˆncias, Universidade Estadual Paulista, 18618-000, Botucatu–SP, Brazil;
20Centro APTA de Citros Sylvio Moreira, Instituto
Agronoˆmico de Campinas, 13490-970, Cordeiropolis–SP, Brazil;
21Departamento de Fonoaudiologia, Universidade Estadual
Present addresses:24Instituto Ludwig de Pesquisa sobre o Caˆncer, 01509-010, Sa˜o Paulo–SP, Brazil.25Embrapa Recursos Gene´ticos e Biotec-nologia–CENARGEN, Caixa Postal 02372, 70770-900, Brasilia–DF, Brazil.26Monsanto Company, Mailzone Q4B, St. Louis, MO 63167, USA. 27Alellyx Applied Genomics, Rodovia Anhanguera, Km 104 (Techno Park), Rua James Clerk Maxwell, 320, 13067-850, Campinas–SP, Brazil. 28Scylla Bioinformatics, 13083-970, Campinas–SP, Brazil.
29Corresponding author.
E-MAIL [email protected]; FAX (55-19) 3788 1089.
Paulista, 17525-900, Marı´lia–SP, Brazil;
22Departamento de Cieˆncias Farmaceˆuticas, Faculdade de Cieˆncias Farmaceˆuticas de
Ribeira˜o Preto, Universidade de Sa˜o Paulo, 14040-903, Ribeira˜o Preto–SP, Brazil;
23CIRAD, TA 40/03, UMR 1096, 34398
Montpellier cedex 5, France
To contribute to our understanding of the genome complexity of sugarcane, we undertook a large-scale expressed
sequence tag (EST) program. More than 260,000 cDNA clones were partially sequenced from 26 standard cDNA
libraries generated from different sugarcane tissues. After the processing of the sequences, 237,954 high-quality ESTs
were identified. These ESTs were assembled into 43,141 putative transcripts. Of the assembled sequences, 35.6%
presented no matches with existing sequences in public databases. A global analysis of the whole SUCEST data set
indicated that 14,409 assembled sequences (33% of the total) contained at least one cDNA clone with a full-length
insert. Annotation of the 43,141 assembled sequences associated almost 50% of the putative identified sugarcane
genes with protein metabolism, cellular communication/signal transduction, bioenergetics, and stress responses.
Inspection of the translated assembled sequences for conserved protein domains revealed 40,821 amino acid
sequences with 1415 Pfam domains. Reassembling the consensus sequences of the 43,141 transcripts revealed a 22%
redundancy in the first assembling. This indicated that possibly 33,620 unique genes had been identified and
indicated that >90% of the sugarcane expressed genes were tagged.
[Supplemental material is available online at http://sucest.lad.ic.unicamp.br/public. The sugarcane EST sequence data
described in this paper have been submitted to GenBank under accession nos. CA064599–CA301538.]
Sugarcane is an important industrial crop of tropical and sub-tropical regions and is cultivated on close to 20 million hectares in more than 90 countries (FAO; http://apps.fao.org). Sugarcane belongs to the grass family (Poaceae), an economically important seed plant family that includes cereals such as maize, wheat, rice, and sorghum as well as many forage crops.The main product of sugarcane is sucrose, which accumulates in the stalk internodes. Sucrose, extracted and purified in specialized mill factories, is used as a raw material in human food industries or is fermented to produce ethanol, a low-pollution fuel.Ethanol is produced on a large scale by the Brazilian sugarcane industry.
The traditional cultivated sweet cane,Saccharum officinarum, has been improved by a century of breeding, the success of which has relied primarily on a series of interspecific crosses with a wild species,Saccharum spontaneum.S. officinarumandS. spontaneum are both polyploid.The former usually has 2n= 80, whereas the latter has two main cytotypes, 2n= 64 or 2n= 112 (Bremer 1961; Ewing et al.1998).As a consequence, sugar cane varieties are at present highly polyploid and aneuploid, with a chromo-some number of 100–130.Most of the chromochromo-somes come from S. officinarum, with 10%–25% being inherited fromS. spontaneum (D’Hont et al.1996).The nonreplicated genome size of a somatic sugarcane cell (2C) is estimated to be 7440 Mb inS. officinarum. BecauseS. officinarum is octaploid, the size of a complete non-redundant chromosome set should be eightfold smaller, ∼930
Mb (D’Hont and Glaszmann 2001).This value is comparable to that of sorghum (∼760 Mb) and about twice that of rice
(∼430 Mb).
The level of heterozygosity of all sugar cane varieties is high (Lu et al.1994).Although the basic chromosome numbers are different for S. officinarum (x= 10) and S. spontaneum (x= 8; D’Hont et al.1998), the two genomes are highly collinear.Thus, in a given cultivar, the basic gene set will be present in 10–14 copies, with one to four of these coming fromS. spontaneum.This means that, for each gene, up to 14 distinct sequence haplotypes originating from the two species may be distinguished among transcripts.
Despite the genome complexity, the amount of information available for the sugarcane genome has been increasing.Genetic maps have been produced forS. spontaneum,S. officinarum, and modern cultivars (al Janabi et al.1993; Grivet et al.1996).Satu-rating the whole genome is an enormous task because of the high
level of ploidy, and none of the maps is yet complete.Two-thirds of the genome is estimated to have been covered (Dufour et al. 1997).Synteny with other grasses has been described based on genetic map comparisons done with common marker sets.Such comparisons have shown that collinearity between sugarcane and sorghum chromosomes is high (Ming et al.1998).A bacterial artificial chromosome (BAC) library has been constructed for cul-tivar R570 (Tomkins et al.1999) and is presently used for the map-based cloning of a fungal resistance gene (D’Hont and Glaszmann 2001).
Gene discovery has been limited in sugarcane.Some genes, mostly those involved in sucrose metabolism, were identified in the 1990s (Kumar et al.1992; Bugos and Thom 1993; Bucheli et al.1996).More recently, an expressed sequence tag (EST) project provided a few hundred “single-pass” sequences of anonymous genes (Carson and Botha 2000).To date, a total of 786 DNA sequence entries of all types, derived from various species of the Saccharumgenus, were listed in the GenBank release of February 2003.
EST projects provide a very useful means of quickly access-ing gene sequence information.As robot throughput increases and cost-per-read drops, it is now reasonable to determine a se-quence tag for a large proportion of genes using this random cDNA sequencing approach.For example, the availability of the complete genome sequence ofArabidopsis thalianarevealed that the 105,000 ESTs available at the end of the year 2000 were enough to tag 60% of the 25,500 genes (TheArabidopsisGenome Initiative 2000).When combined with breakthroughs in highly parallel designs for gene expression analysis, large-scale EST projects now offer new perspectives for understanding the mo-lecular basis of important traits in plants of agricultural relevance (Duggan et al.1999).
We report here the analysis of a collection of∼240,000 ESTs
RESULTS
Sequencing, Assembling, and Analysis of
Sugarcane ESTs
Standard, unidirectional cDNA libraries were generated from a set of sugarcane tissues sampled from different varieties at vari-ous developmental stages (Table 1; Vettore et al.2001).Libraries were also generated from a mixture of calli tissues subjected to cold or heat treatment.Two libraries (AD1 and HR1) were con-structed with plantlets inoculated with Gluconacetobacter diaz-otroficansorHerbaspirilum diazotroficans, both of which are endo-phytic nitrogen-fixing bacteria that colonize sugarcane tissues (Lee et al.2000).From each cDNA library, between 3000 and 14,000 clones were sequenced.A total of 260,352 clones were processed, generating 259,325 5⬘-end sequences and 32,364 3⬘ -end sequences equivalent to 291,689 ESTs (Table 2).After trim-ming low-quality and vector sequences and removing contami-nant bacterial and ribosomal RNA sequences, the resulting data set contained 237,954 high-quality ESTs with a minimum of 140 bases, with a phred qualityⱖ20 and an average of 864 bp in length (Table 2).Mitochondrial and chloroplast sequences were not filtered, but they contributed with <0.4% of the entire data set (data not shown).Insert amplification of 400 random clones from each library revealed inserts ranging between 500 bp and 5000 bp, with an average size of 1250 bp (Table 2).The 237,954 high-quality ESTs were assembled using the CAP3 pro-gram.A total of 221,616 ESTs were assembled into 26,803 con-tigs, while 16,338 remained as singletons (Table 3).There are
22,378 EST pairs (44,756 reads) representing clones sequenced from both the 3⬘- and 5⬘-ends.From these, 13,257 (∼60%) are
present in the same contig.The 3⬘- and 5⬘-read pairs that did not assemble in the same contig could be originated from long cDNA inserts in which the reads from opposite ends did not overlap. The combined set of contigs and singletons resulted in 43,141 sequences (hereafter referred to as SASs for Sugarcane Assembled Sequences) representing putatively different transcripts.The alignment of the SASs with known protein sequences in the Non-Redundant Protein (nr) GenBank database (Benson et al.2002; BLASTX Eⱕ10ⳮ40
) revealed that >33% of the SASs contain clones with inserts representing the full-length protein sequence (Table 3).
To estimate the level of redundancy, the 43,141 SASs were compared with each other using parameters of the cross_match (http://www.phrap.org/) algorithm that allowed two sequences to be considered as originating from the same transcript when they have 98% nucleotide identity over a minimum of 100 bp. Assembly of the 43,141 SASs resulted in 28,361 singletons and 5259 contigs, indicating∼22% redundancy.This value is similar
to the redundancy level in the honeybee EST assembly (Whitfield et al.2002) and indicates that the SUCEST project may have identified 33,620 expressed sugarcane genes.Sugarcane may have a gene number similar to rice, which is presently estimated to be∼35,000 genes (Goff et al.2002; Yu et al.2002), a number
also similar to that estimated for tomato (Van der et al.2002). Thus, the genes identified by SUCEST may represent >90% of the sugarcane expressed genes.
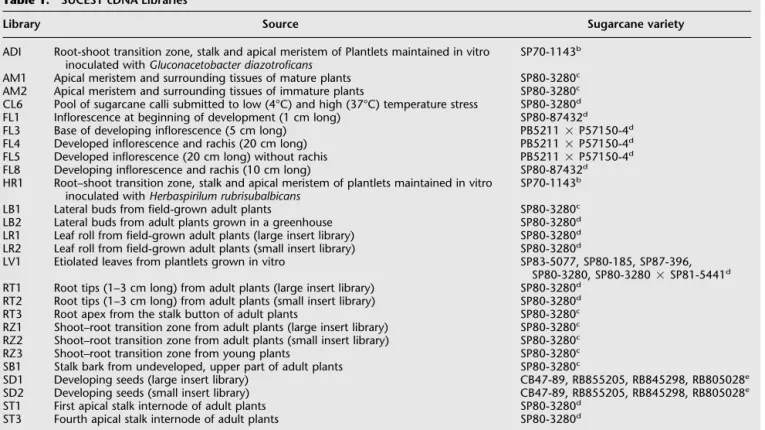
Table 1. SUCEST cDNA Librariesa
Library Source Sugarcane variety
ADI Root-shoot transition zone, stalk and apical meristem of Plantlets maintained in vitro inoculated withGluconacetobacter diazotroficans
SP70-1143b
AM1 Apical meristem and surrounding tissues of mature plants SP80-3280c
AM2 Apical meristem and surrounding tissues of immature plants SP80-3280c
CL6 Pool of sugarcane calli submitted to low (4°C) and high (37°C) temperature stress SP80-3280d
FL1 Inflorescence at beginning of development (1 cm long) SP80-87432d
FL3 Base of developing inflorescence (5 cm long) PB5211⳯P57150-4d
FL4 Developed inflorescence and rachis (20 cm long) PB5211⳯P57150-4d
FL5 Developed inflorescence (20 cm long) without rachis PB5211⳯P57150-4d
FL8 Developing inflorescence and rachis (10 cm long) SP80-87432d
HR1 Root–shoot transition zone, stalk and apical meristem of plantlets maintained in vitro inoculated withHerbaspirilum rubrisubalbicans
SP70-1143b
LB1 Lateral buds from field-grown adult plants SP80-3280c
LB2 Lateral buds from adult plants grown in a greenhouse SP80-3280d
LR1 Leaf roll from field-grown adult plants (large insert library) SP80-3280d
LR2 Leaf roll from field-grown adult plants (small insert library) SP80-3280d
LV1 Etiolated leaves from plantlets grown in vitro SP83-5077, SP80-185, SP87-396, SP80-3280, SP80-3280⳯SP81-5441d
RT1 Root tips (1–3 cm long) from adult plants (large insert library) SP80-3280d
RT2 Root tips (1–3 cm long) from adult plants (small insert library) SP80-3280d
RT3 Root apex from the stalk button of adult plants SP80-3280c
RZ1 Shoot–root transition zone from adult plants (large insert library) SP80-3280c
RZ2 Shoot–root transition zone from adult plants (small insert library) SP80-3280c
RZ3 Shoot–root transition zone from young plants SP80-3280c
SB1 Stalk bark from undeveloped, upper part of adult plants SP80-3280c
SD1 Developing seeds (large insert library) CB47-89, RB855205, RB845298, RB805028e
SD2 Developing seeds (small insert library) CB47-89, RB855205, RB845298, RB805028e
ST1 First apical stalk internode of adult plants SP80-3280d
ST3 Fourth apical stalk internode of adult plants SP80-3280d
aStandard cDNA libraries were constructed from a range of tissues sampled from plants at different developmental stages and grown in vitro, in a
greenhouse, or in the field. All sugarcane varieties used are derived from commercial hybrids (S. spontaneum⳯S. officinarum). The library code, the tissue source, and the variety used are indicated. Plants were grown at the locations indicated in footnotes b–e.
bUniversidade Federal do Rio de Janeiro, Rio de Janeiro, RJ. cUniversidade Estadual de Campinas, Campinas, SP. dCopersucar Experimental Station, Piracicaba, SP.
Of the 43,141 SASs, 27,833 (65%) were similar to known protein sequences present in the GenBank nr database (TBLASTX,Eⱕ10ⳮ5; Table 3).Comparison of the 43,141 SASs
withArabidopsisand rice genomes (TBLASTX,Eⱕ10ⳮ5) revealed
that 71% and 82% of SASs had a significant match with Arabi-dopsisand rice, respectively (M. Vincentz and C.F.M. Menck, in prep.).
Sequence Polymorphism
EST data generated from various chromosome haplotypes offer the opportunity to detect sequence polymorphism, as demon-strated for the human (Buetow et al.1999; Picoult-Newberg et al. 1999) and maize (Rafalski 2002) genomes.In sugarcane, the main difficulty is to distinguish paralogous genes from alleles of the same gene when more than 10 distinct haplotypes inherited from two species can theoretically be found
at each locus.We conducted a detailed analysis of the sugarcane ESTs of two small families of genes, the6-phosphogluconate de-hydrogenases(Grivet et al.2001) and the al-cohol dehydrogenases(Grivet et al.2003).A mean number of 15.4 single-nucleotide polymorphisms (SNP) and 3.6 insertions/ deletions (INDEL) were detected for each of the five genes analyzed.SNPs were observed throughout the gene sequence, whereas INDELs were restricted to the 5⬘and 3⬘ non-coding regions.None of the assembled se-quences corresponding to these genes ever contained ESTs from two distinct genes, but, as a rule, ESTs of the same gene were kept apart in different assemblies when they differed for a large INDEL or a series of SNPs. Analysis of the gene families in Arabi-dopsis showed that <2% of nuclear genes had a paralogous counterpart with a se-quence identity ⱖ95% over ⱖ90% of the coding region, that is, conditions suscep-tible to the introduction of mistakes in EST clustering.We assumed that an analysis of polymorphism within assembled sugarcane EST sequences would be conservative such that it would probably miss some real poly-morphism but would reveal very few false ones.Using this premise, we conducted a
global analysis of SNPs and INDELs in the SAS data set based on the parameters described by Picoult-Newberg et al.(1999).An SNP was declared present at a given position when an alternative base to the consensus sequence was present at least twice in an alignment window with a phred qualityⱖ20.No more than one SNP was admitted in every window of 5 bp.Only SASs with more than four reads were considered.In all, a total of 42,936 SNPs were detected for 14,445 SASs analyzed (mean of 2.97 SNP per SAS).This value is considerably higher than that reported for the human genome with similar data (Garg et al.1999; Picoult-Newberg et al.1999; Deutsch et al.2001).
Based on sequence polymorphism data in modern sugar-cane cultivars obtained using molecular markers (Grivet et al. 1996; Hoarau et al.2001), it is possible that the high SNPs ob-served in the SUCEST data set may at least partially be due to contrasted S. officinarum versus S. spontaneumsequence differ-ences in the interspecific hybrids used to prepare the cDNA li-braries.Transitions (64%) were more frequent than transversions (36%).As expected, a significant positive correlation (P< 0.05) was observed between the number of SNPs detected in an SAS and the number of reads present in that SAS.INDELs were ten-tatively detected as series of adjacent positions along SASs, where the absence of any base was recorded at least twice within an alignment window with a phred quality ⱖ20.With this rule, 3631 INDELs of 1 to 24 bases were detected in the entire database. A set of the predicted SNPs was tested experimentally.Poly-morphism was verified through restriction analysis for 51 SNP sites on a panel of 55 genotypes, including representatives of S. officinarum, S. spontaneum, and modern cultivars (data not shown).Polymorphism among individuals was observed for 31 (61%) of these sites, indicating that a large majority of SNPs de-tected in our study are real.
Functional Annotation of Sugarcane ESTs
SASs were categorized with respect to functionally annotated genes in other organisms and grouped into 18 broad categories of
Table 2. SUCEST EST Summary
Total sequences 291,689
cDNA clones sequenced (5⬘or 3⬘) 260,352
5⬘-end sequences 259,325
3⬘-end sequences 32,364
Total high-quality sequences 237,954
Success index (%) 81.6
Average insert size (bp) 1250
Average sequence size (bp) 864
Bases with phred qualityⱖ20/read 399
Numbers of sequenced cDNA clones and generated ESTs from 26 cDNA libraries. A total of 260,352 cDNA clones were sequenced (259,325 5⬘-end and 32,364 3⬘-end sequences). After trimming and the removal of low-quality sequences, rRNA, and bacterial sequences. 237,954 high-quality sequences with a minimum of 140 bases re-mained. The average insert size was evaluated by polymerase chain reaction (PCR) analysis of 400 clones from each cDNA library. The success index represents the percentage of high-quality sequences relative to the total number of sequences.
Figure 1 Sugarcane gene prediction classification. We classified 26,525 SASs with similarities to known protein sequences in the nonredundant protein (nr) database into 18 functional categories. The categories were generated either by automatic BLASTX of SASs against the categorized data-bases (cog.aa, http://www.ncbi.nlm.nih.gov/cgi-bin/COG/palog?fun=all; egad.aa, http:// www.tigr.org/docs/tigr-scripts/egad_scripts/role_report.spl; kegg.aa, http://www.genome.ad.jp/ kegg/kegg2.html; mips-at.aa, http://www.mips.biochem.mpg.-de/cgi-bin/proj/thal/ filter_funcat.pl?all) or by manual inspection of BLASTX matches in the nr database by members of the SUCEST Consortium. In both cases, the BLASTXE-value cutoff wasⱕ10ⳮ5. The percentage of
biological roles (Fig.1).Although several schemes of categoriza-tion may be equally valid, we have attempted to group together proteins that share similar functional characteristics or cellular roles, rather than follow a strict biochemical classification.Roles were assigned according to the known or putative involvement of a gene or a protein in a cellular process or pathway, as opposed to its participation in a specific binding or catalytic function.The sum of SASs per category did not add to 100%, because some SASs were classified in more than one category.Thus, for example, the enzyme phenylalanine ammonia-lyase was assigned to three cat-egories (bioenergetics, stress response, and secondary metabo-lism).
Examination of the primary BLAST matches revealed three major groups of SASs with varying potential to predict their cel-lular function.SASs in the first group, which matched sequences of known proteins with strong and nominal similarity, are likely to be transcripts of genes with similar functions (15,466 SASs; 36%).The function of the BLAST match was used to assign cel-lular roles to this group.The second class was formed by 15% of the total SASs (6614 or 24.9% of the categorized SAS in Fig. 1), and this group matched to “unknown protein,” “hypothetical protein,” or “putative protein,” with no indication of the func-tion of the gene product.Most of the unknown proteins came from ESTs from other species that had been entered into the GenBank nonredundant database.The third group consisted of 15,308 SASs (35.6% of the total SASs) with no matches in the
GenBank nr database.Almost 50% of all SASs annotated in the SUCEST database were associated with five broad categories: (1) cellular dynamics (biogenesis, organization and structure of the cell, cell division, cell growth, motility), (2) stress response (cell rescue activities, disease, virulence, and defense), (3) protein metabolism (folding and stabilization, modification, synthesis, targeting, sorting and translocation, proteolysis), (4) bioenerget-ics (C-compound and carbohydrate metabolism, photosynthe-sis), and (5) cellular communication/signal transduction (Fig.1).
An “unable to classify” category (Fig.1) was used for pro-teins and genes whose roles were unknown or could not be as-signed with confidence based on searches of the literature.This category included 4445 SASs.This number corresponds to 17% of all categorized SASs or 10.3% of all SASs identified in the SUCEST database.
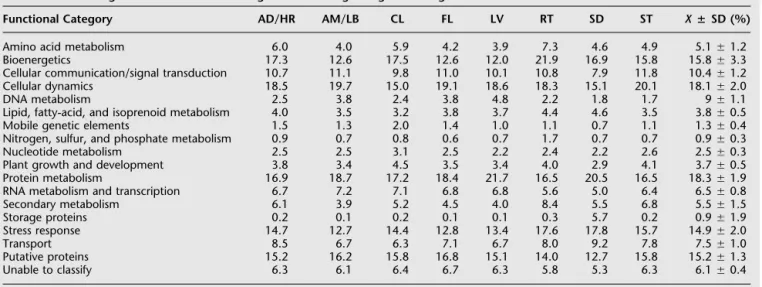
The SUCEST functional categories grouped according to the sugarcane tissues (organs) from which the mRNA was extracted are shown in Table 4.Although the proportion of unique genes involved in each cellular role was relatively uniform among the sugarcane organs, striking differences existed in the actual levels of gene expression.For example, developing seeds exhibited el-evated expression of genes encoding storage proteins (fivefold above the average; Table 4) and relatively low levels of cellular communication transcripts compared with the other sugarcane organs.These may be because of the fact that storage proteins are typically expressed in high levels in cereal seeds (Leite et al.1999).A higher proportion (more than twofold) of genes involved in nitrogen, sulfur, and phosphate metabolism was found in the root libraries, and reflected the involvement of this organ in nutrient uptake (Table 4).The number of transcripts involved in nucleotide metabolism, plant growth, and develop-ment was elevated in calli (Table 4).This may be associated with the high rate of cell proliferation in this tissue.
Protein Domain Analysis
The distribution of conserved protein domains in the SUCEST database was analyzed by translating the SASs using the ESTScan algorithm (Iseli et al.1999) and submitting for a domain search in the Pfam database (Bateman et al.2000).For the 43,141 SASs, 40,756 proteins were assigned by ESTScan.Of these, 65 yielded two proteins, leading to 40,821 amino acid sequences ranging
Table 3. Sequence Assembly Results
Total sequences analyzed 237,954
Number of contigs 26,803
Number of singletons 16,338
Number of sugarcane assembled sequences (SAS) 43,141 Number of assembled sequences matching known genes 27,833 Number of clones with full-length inserts 14,409
High-quality ESTs were assembled using CAP3. A BLASTX match cut-off ofⱕ10ⳮ5was used to assign similarity. Clones were considered as
having a putative full-length insert when their sequences started within the first 15 amino acids of their best BLASTX match with an
E= valueⱕ10ⳮ40.
Table 4. Percentage of SAS in 18 Broad Categories Across Eight Sugarcane Organs
Functional Category AD/HR AM/LBCL FL LV RT SD ST XⴣSD (%)
Amino acid metabolism 6.0 4.0 5.9 4.2 3.9 7.3 4.6 4.9 5.1Ⳳ1.2
Bioenergetics 17.3 12.6 17.5 12.6 12.0 21.9 16.9 15.8 15.8Ⳳ3.3
Cellular communication/signal transduction 10.7 11.1 9.8 11.0 10.1 10.8 7.9 11.8 10.4Ⳳ1.2
Cellular dynamics 18.5 19.7 15.0 19.1 18.6 18.3 15.1 20.1 18.1Ⳳ2.0
DNA metabolism 2.5 3.8 2.4 3.8 4.8 2.2 1.8 1.7 9Ⳳ1.1
Lipid, fatty-acid, and isoprenoid metabolism 4.0 3.5 3.2 3.8 3.7 4.4 4.6 3.5 3.8Ⳳ0.5
Mobile geneticelements 1.5 1.3 2.0 1.4 1.0 1.1 0.7 1.1 1.3Ⳳ0.4
Nitrogen, sulfur, and phosphate metabolism 0.9 0.7 0.8 0.6 0.7 1.7 0.7 0.7 0.9Ⳳ0.3
Nucleotide metabolism 2.5 2.5 3.1 2.5 2.2 2.4 2.2 2.6 2.5Ⳳ0.3
Plant growth and development 3.8 3.4 4.5 3.5 3.4 4.0 2.9 4.1 3.7Ⳳ0.5
Protein metabolism 16.9 18.7 17.2 18.4 21.7 16.5 20.5 16.5 18.3Ⳳ1.9
RNA metabolism and transcription 6.7 7.2 7.1 6.8 6.8 5.6 5.0 6.4 6.5Ⳳ0.8
Secondary metabolism 6.1 3.9 5.2 4.5 4.0 8.4 5.5 6.8 5.5Ⳳ1.5
Storage proteins 0.2 0.1 0.2 0.1 0.1 0.3 5.7 0.2 0.9Ⳳ1.9
Stress response 14.7 12.7 14.4 12.8 13.4 17.6 17.8 15.7 14.9Ⳳ2.0
Transport 8.5 6.7 6.3 7.1 6.7 8.0 9.2 7.8 7.5Ⳳ1.0
Putative proteins 15.2 16.2 15.8 16.8 15.1 14.0 12.7 15.8 15.2Ⳳ1.3
Unable to classify 6.3 6.1 6.4 6.7 6.3 5.8 5.3 6.3 6.1Ⳳ0.4
from 6 to 1782 amino acids (the average protein size being 211.96Ⳳ141.34). A high percentage (87%) of the 2385 SASs for which no protein could be assigned did not show significant similarity to sequences present at the public databases.This could indicate that they correspond to sequences of the 5⬘- or 3⬘-UTRs, which tend to be less conserved among organisms.Of the 40,821 protein sequences obtained, 12,921 pre-sented at least one domain, totaling 1415 different domains.
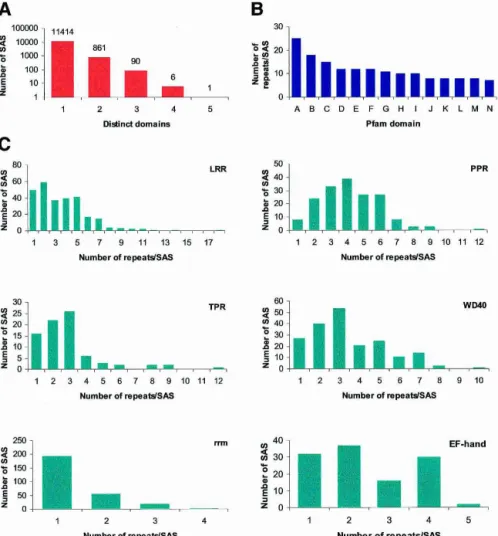
Most of the SASs identified in the SUCEST database coded for proteins con-taining one domain (11,414), but a signifi-cant number contained two or three do-mains (861 and 90, respectively; Fig.2A).As ESTs are partial sequences in nature, the number of domains found in the SASs might not correspond to the real number of domains in the full-length protein sequences. The most repeated domain found in SUCEST database was the nucleoporin FG domain (Fig.2B).The nucleoporin FG do-main of the nuclear pore complex protein occurred 25 times in one SAS.The next most repeated domains were the leucine-rich repeat (LRR) and the HEAT repeat (re-lated to armadillo/-catenin-like repeats), both of which are involved in protein– protein interactions.Also common were the M repeats (found in multiple copies in bacterial M proteins) and the PPR repeat, of unknown function but frequently found in plants.The repeated domains represented by the largest number of SASs were also ana-lyzed for their range and frequency of rep-etition.There were 274 occurrences of the LRR domain in the SUCEST database, and the number of repeats ranged from 1 to 18 (Fig.2C).Also shown in Figure 2C are the range and frequency of repeats for 271 SASs with rrm domains (diagnostic of RNA-binding proteins), 196 SASs with WD40 re-peats (characteristic of G-protein G- sub-units), 173 SASs with PPR repeats, 117 SASs with EF-hand domains, and 80 with TPR re-peats.The number of repeats within the WD40-containing proteins of other systems
varies from 5 to 8, but there is at least one example in sugarcane where 10 repeats are found.
Figure 3 shows the top 25 domains found in sugarcane.The eukaryotic protein kinase and leucine-rich domains were the most frequent domains in sugarcane.These have also been shown to be enriched inA. thaliana.The top ranking domains in A. thalianaalso include the RNA-recognition motif, the PPR re-peats, the F-box domain, and the WD40 rere-peats, indicating a conservation of domain usage in plants (http://mips.gsf.de/proj/ thal/db/tables/tables_func_frame.html).
Tissue-Enriched Expression of Sugarcane Genes
An SAS was considered tissue-enriched if it contained at least three ESTs originating exclusively from a single sugarcane tissue. Of the 43,141 SASs, 1234 were tissue-enriched (Table 5; Supple-mental material).These corresponded to 5716 ESTs (2.5% of the total ESTs).More than 80% of the tissue-enriched SASs (1020)
contained three or four ESTs.The maximum number of ESTs in a tissue-enriched SAS was found for a prolamin that contained 360 ESTs.Developing seeds contained 1902 specific ESTs (33% of the total), with almost half of these (919) encoding prolamins, the major seed storage protein found in cereals.These ESTs included six putative new genes with a high level of expression in seeds (up to 32 ESTs/SAS).
A search for the most common protein domains among the tissue-enriched SASs indicated that the protein kinase domain, followed by trypsin-␣-amylase inhibitors, seed storage proteins, and lipid transfer protein, were the most frequent (Fig.4).SASs with protein kinase domains include a MAP kinase, three wall-associated kinases, and five receptor protein kinases.The latter group is believed to transduce extracellular signals involved in pathogen perception, and one of the receptor-like kinases iden-tified was specific to the library prepared from plantlets that were inoculated with the nitrogen-fixing bacteriaHerbaspirillum.The
F-box domain was also a top-ranking motif among tissue-enriched SASs.This motif serves as a link between a target protein and an ubiquitin-conjugating enzyme (Patton et al.1998), and its specific expression may indicate tissue specific protein degra-dation.Cytochrome P450s are one of the most common domains specific to root SASs, and this is in accordance with their well-known role in the metabolism of environmental toxins.
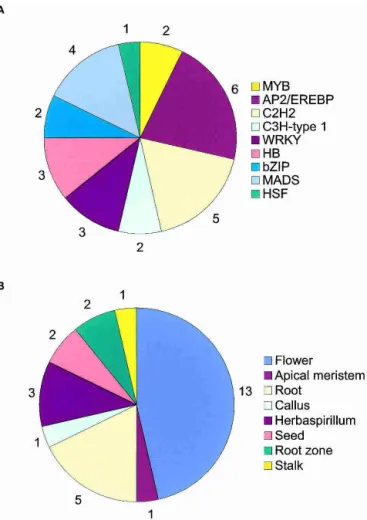
Cell type specification is commonly associated with the ex-pression of specific transcription factors.Twenty-eight SASs with transcription factor domains were tissue-enriched (Fig.5), among which the AP2-domain was the most represented.These ele-ments are specific to plants and confer ethylene responsiveness (Ecker 1995).SASs containing the AP2-domain were specific for temperature-stressed calli, seeds, the root-to-shoot transition zone, flowers, stems, and roots.Within the core of the plant homeotic proteins is the MADS box found in the Agamous and Deficiens protein families involved in flower and fruit develop-ment (Ng and Yanofsky 2001).Four specific SASs with a MADS-box domain were found, three of which were flower-specific. Overall, 13 transcription factor families were found to be specific for flowers, five for roots, three for Herbaspirillum-inoculated plantlets, and two for developing seeds and other tissues (Fig.5).
Regulation of Gene Expression
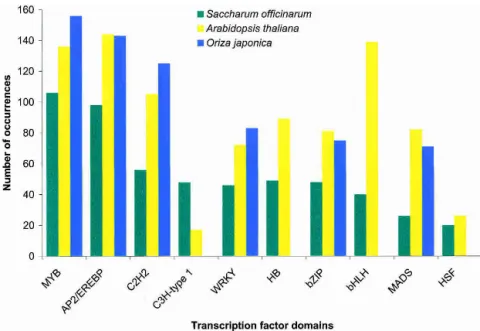
The unraveling of several eukaryotic genome sequences has al-lowed a comprehensive analysis of the transcription apparatus of cells and a comparison between plant and animal transcription factors (Riechmann et al.2000).Around 5% of SASs (1416) en-coded proteins with functions related to RNA metabolism and transcription (Fig.1).This level was comparable to that of A. thaliana (Goff et al.2002), in terms of number and most pre-dominant transcription factor families present (Fig.6).One in-teresting feature of the SUCEST database was the presence of a
large group of SASs encoding proteins containing the C3H-type zinc-finger domains C-x8-C-x5-C-x3-H, which are not as numer-ous inArabidopsis(Riechmann et al.2000).In general, 60% of the transcription factors found inArabidopsisor rice were also pres-ent in the SUCEST database.
Signal Transduction
The increasing number of genomes being sequenced has shown that most of the signaling modules are conserved among animals and plants, although some are enriched in animals and com-pletely absent in plants (McCarty and Chory 2000).A compre-hensive analysis of all signal transduction components found in the SUCEST database revealed the same pattern observed in the Arabidopsis genome (TheArabidopsis Genome Initiative 2000). There was no evidence of seven-pass transmembrane receptors or an adenylyl cyclase in sugarcane.The main receptor class iden-tified was the serine/threonine receptor kinase family containing the leucine-rich repeat (LRR), which is postulated to mediate the recognition of plant peptides and possibly pathogens.This do-main was also found in disease-resistance genes (R-genes; Ellis et al.2000).There were 274 LRR-domains-containing SASs in the SUCEST database (Fig.3).
Signal transduction following receptor activation frequently involves heterotrimeric G-proteins.There were five SASs with the signature of G-␣-proteins, 12 for -subunits, and one for the
␥-subunit.There were 74 SASs with Ras-like domains, as well as evidence for their modulators, ArfGAP (16 SASs), RhoGAP (5 SASs), and RasGEF (1 SAS).Adapter modules and proteins usually associated with signaling complexes such as the PH domain and 14–3–3 proteins also occurred in the SUCEST database with 13 and 16 SASs, respectively.There was little evidence of phospho-tyrosine recognition by SH2 domains.Only one SAS with this signature was found and encoded a putative chromatin
tory protein.SH3 domains, which may be associated with SH2 domains (Morton and Campbell 1994), occurred in three SASs. As for other plants, tyrosine kinases have not been found in the SUCEST database.However, protein-tyrosine phosphatases (three SASs) and dual specificity phosphatases (seven SASs) were present among the sugarcane ESTs.There were 805 SASs encoding pro-tein kinases in the SUCEST database, which represented the larg-est domain family found.The importance of protein phosphory-lation/dephosphorylation events was corroborated by the pres-ence of 64 SASs encoding protein phosphatase 2C domains and 14 SASs for the regulatory B subunits of protein phosphatase 2A. Phosphorylation at histidine residues was also well represented in the SUCEST database, with nine SASs sharing similarity to the histidine kinase A (phosphoacceptor) domain, which includes transcripts similar to the ethylene and cytokinin receptors, and 26 SASs with the response regulator receiver domain.
Defense-Related Genes
As in other plants, sugarcane appears to have developed complex defense responses either to protect itself from attack by insects and microbial pathogens, or to profit from these interactions, as in the case of infection with diazothropic endophytes.In all, 80 SUCEST SASs encoded proteins with clear similarity to the
NB-ARC domain, which is characteristic of one of the major classes of disease resistance genes (R genes).As stated above, >200 SASs encoded proteins with at least one LRR domain.The SUCEST database contained 46 SASs encoding WRKY transcription factor domains, which have been implicated in the regulation of genes associated with pathogen defense in plants.Other genes related to less specific defense responses (e.g.,chitinases,-1,3-glucanases, chalcone synthases, chalcone isomerases, isoflavone reductases, hy-droxyproline-rich glycoproteins, proline-rich proteins, catalases, super-oxide dismutases) have putative orthologs in sugarcane, which indicates a high conservation of defense strategies among plants.
DISCUSSION
Approximately two-thirds of the SASs were similar to other pub-licly available sequences (Table 3).The remaining sequences (∼36%) with no matches in the public databases at either the
protein or nucleotide level may represent untranslated mRNAs, as well as new sugarcane genes.Shoemaker at al.(2002) demon-strated that 13% of the soybean ESTs returned no matches after BLASTX search on trimmed sequences against the GenBank nr database.
The two main groups of flowering plants, the monocots and
Table 5. Tissue-Enriched SAS
Number of ESTs
Specific
SAS Best BLAST match Library
360 1 (Y17556)␣-kafirin [Sorghum bicolor] SD
103 1 (A23207) zein zA1 [Zea mays] SD
76 1 (Y17555)␣-kafirin [Sorghum bicolor] SD
54 1 (AF090447) zp22/D87 [Zea mays] SD
49 1 (X57831)␣-coixin 27 kDA [Coix lacryma-jobi] SD
43 1 (Y17556)␣-kafirin [Sorghum bicolor] SD
42 1 (AF232008)-glucosidase aggregating factor precursor [Zea mays] RT
38 1 (Y17556)␣-kafirin [Sorghum bicolor] SD
35 1 (1107201B) zein A20 [Zea mays] SD
35 1 (X16101) kafirin preprotein [Sorghum bicolor] SD
34 1 (X53582) 19 kD zein [Zea mays] SD
32 1 No match SD
31 1 (S51798)␥-kafirin precursor [Sorghum bicolor] SD
28 1 (X79885)-coixin [Coix lacryma-jobi] SD
26 1 No match SD
25 1 (V01475) reading frame zein [Zea mays] SD
24 1 (AC007789) putative low molecular early light-inducible protein [Oryza sativa] SD
24 1 (1906392A) thaumatin-like protein [Zea mays] SD
22 1 (M12144) 19kDa zein protein [Zea mays] and (AP002820) putative peroxidase [Oryza sativa] SD
22 1 (AP002820) putative peroxidase [Oryza sativa] RT
21 1 (X16101) kafirin preprotein [Sorghum bicolor] SD
21 1 (X63113)␣-coixin [Coix lacryma-jobi] SD
19 1 (X56337)␣-amylase [Oryza sativa] CL
19 1 No match SD
18 1 (AP000374) Cyclopropane fatty acid synthase [Arabidopsis thaliana] FL
17 1 No match SD
16 1 No match SD
16 1 Unknown [Triticum aestivum] RT
14 2 No match and (AB018375) OsENOD93a gene for early nodulin [Oryza sativa] SD, RT
13 4 S.M. SD, FL, RT
12 6 S.M. SD, RT, HR, FL
11 4 S.M. RT, CL, FL
10 5 S.M. SD, FL, ST
9 8 S.M. S.M.
8 8 S.M. S.M.
7 19 S.M. S.M.
6 42 S.M. S.M.
5 86 S.M. S.M.
4 205 S.M. S.M.
3 815 S.M. S.M.
dicots, diverged 200 million years ago (Wolfe et al.1989), but despite this long period of independent evolution, plant genes display significant conservation.This is corroborated by the fact that most of the sugarcane SASs also occur inArabidopsis(71%), maize (62%–68%), and rice (82%).The cereals have been evolv-ing independently from a common ancestral species for 50–70 million years (Kellogg 1998).This shorter period, compared to the monocot/dicot divergence, could be the main reason for the synteny among grass genomes.Whereas 71% of the sugarcane andArabidopsisproteins are similar,∼82% of the sugarcane
pu-tative genes have a match in the rice genome.This implies that
∼11% of the sugarcane SASs may correspond to gene sequences
that are either restricted to monocots (innovation or gene loss in dicots) or are fast-evolving sequences not retained by the fixed threshold.The remaining 18% of the SASs may represent pro-teins involved in the differentiation of sugarcane and rice, or may correspond to noncoding sequences that are under low se-lective pressure, which diverged rapidly (M. Vincentz and C.F.M. Menck, in prep.).
The abundance of SASs with predicted cellular roles in sug-arcane was estimated by classifying the primary BLAST matches with similarity to known proteins into functional categories (Fig. 1).The proportion of transcripts involved in gene expression (the sum of the protein metabolism, RNA metabolism, and transcrip-tion categories in Table 4) was 24.9% (between 23% and 28.5% among sugarcane organs; Table 5).This compares favorably with an average of 21.9% in various human tissues (with most being between 20% and 27%; Adams et al.1995).
In sugarcane, the putative genes related to cellular commu-nication represent ∼12% of the total number of genes (signal
transduction and secondary metabolism in Fig.1), whereas∼17%
of the transcripts identified by the SUCEST may be involved in metabolism, including the SASs in five functional categories: amino acid metabolism, lipid, fatty-acid and isoprenoid metabo-lism, nitrogen, sulfur and phosphate metabometabo-lism, nucleotide me-tabolism, and bioenergetics (Fig.1).According to Adams et al (1995), the proportion of genes related to cell signaling commu-nication and metabolism in human tissues is ∼12.4% and ∼16.4%, respectively. The similarity in proportions in sugarcane
and human cells implies that the cellular machinery involved in nonspecialized functions is highly conserved in eukaryotes.
The wealth of information generated in this work holds ex-citing prospects for plant scientists.Like most plants, sugarcane is exposed to biotic (viruses, bacteria, fungi, and a multitude of herbivores) and abiotic (drought, cold, and aluminum toxicity, e.g.) stress that contributes to decreased productivity. The SUCEST data set provides a fundamental basic resource for the
Figure 5 The most common transcription factor domains in tissue-enriched SASs. The SASs were inspected for tissue specificity using the library of origin of their EST components. An SAS was considered tissue-enriched when it contained at least three ESTs found exclusively in a given library. The SASs were translated using the ESTScan algorithm. Domain occurrence was revealed by querying the Pfam database with the corresponding amino acid sequences using the default settings of Pfam 7.0 [“global and local alignments merged” and “Pfam gathering thresh-old (GA)”]. The 10 most frequent transcription factor domains were de-termined (see Fig. 6) and inspected for tissue specificity. (A) The most represented transcription factor domains among the tissue-enriched SASs along with the number of SASs in each of them. (B) The same data as in
Ashowing the tissue origin and number of occurrences.
understanding of the biology of this complex polyploid plant.In addition, this information may facilitate genomic analyses in other plants, particularly gene discovery, functional characteriza-tion, and annotation of cereal genomic sequences.
METHODS
Plant Material
Sugarcane tissues were obtained from the varieties SP70-1143, SP80-3280, SP80-87432, PB5211⳯ P57150-4, CB47-89, RB855205, RB845298, and RB805028 (Table 1).Plants were grown at the Copersucar experimental station (Piracicaba, SP, Brazil), at the Universidade Federal de Alagoas experimental sta-tion–Serra do Ouro (Murici, AL, Brazil), and at the Centro de Biologia Molecular e Engenharia Gene´tica (Campinas, SP, Brazil). After harvesting, tissues were frozen in liquid nitrogen and stored atⳮ80°C until RNA extraction.
cDNA Library
Total RNA was isolated from different sugarcane tissues with Tri-zol (Invitrogen) according to the manufacturer’s instructions, or according to the method described by Manning (1991).Poly(A)+
was purified using Oligotex-dT (QIAGEN) according to the manufacturer’s instructions.cDNA was synthesized using 1–5 µg of poly(A)+
RNA and directionally cloned as described in Vettore et al.(2001) using the SuperScript Plasmid System for cDNA Syn-thesis and Cloning kit (Invitrogen).Sepharose CL-2B (Pharmacia) columns (40 cm long, 1.5 mm ID) were used for the size fraction-ation of cDNAs.cDNA fractions containing fragments >500 bp were pooled and ligated into the vector pSPORT1 (Invitrogen) predigested withSalI andNotI.DH10BEscherichia colicells (In-vitrogen) were electroporated (25 µF; 200 ⍀; 1.8 kV) with the resulting plasmids.The average titer of the libraries was
∼4.7⳯106 recombinants/µg cDNA.The transformants were
spread on LB agar plates for direct picking without a library am-plification step.
Template Preparation and
DNA Sequencing
DNA templates were prepared in a 96-well format at all stages, from bacterial growth through to the purification after the se-quencing reaction.The DNA was prepared using a 96-well alkaline lysis DNA method (http://sucest.lad.ic.unicamp.br/public). Se-quencing reactions were done on plasmid templates using one-fourth of the standard volume of ABI Prism BigDye Terminator Se-quencing Kits (Applied Biosystems).Reac-tion products were precipitated with 95% ethanol using 3 M sodium acetate and gly-cogen (1 g/L).Pellets were washed twice with 75% ethanol before drying under vacuum.The sequencing reaction products were analyzed on 377-96 ABI sequencers.
Sequence Analysis
The software phred (Ewing et al.1998) was used to base call and to estimate error prob-ability in the SUCEST chromatograms.The trimming process, which included the re-moval of ribosomal RNA, poly(A) tails, low-quality sequences, and vector and adapter regions, was conducted as described by Telles and da Silva (2001).The CAP3 assem-bler (Huang and Madan 1999), using read quality and default parameters, was used to cluster the trimmed reads.Similarities be-tween SASs and sequences in the NCBI’s nr, nt, and dbEST databases (Benson et al. 2002) were retrieved using BLAST (Altschul et al.1997).Thedriver database for categorization consisted of 32,438 protein sequences from several sources divided into 30 categories (Telles et al. 2001).SASs that had BLAST matches with anE-valueⱕeⳮ10
and coveringⱖ70% of the hit protein present in thedriverdatabase (36% of all consensus sequences) were automatically assigned to thedriverdatabase protein categories.An annotation team manu-ally categorized the remaining SASs using the BLASTX results. The SASs showing matches with the first 15 amino acids of a protein present in the GenBank database (BLASTX hit with E-valuesⱕeⳮ40) were assumed to be full-length genes.For protein
domain analysis, the default settings of Pfam 7.0 [“global and local alignments merged” and “Pfam gathering threshold (GA)”; Bateman et al.2000] were used.
ACKNOWLEDGMENTS
The authors thank the technicians and researchers who contrib-uted to the sequencing effort and whose names are listed at the Web site http://sucest.lad.ic.unicamp.br/public. This project was jointly sponsored by Fundac¸a˜o de Amparo a` Pesquisa do Estado de Sa˜o Paulo (FAPESP), Conselho Nacional de Desenvolvimento Cientı´fico e Tecnolo´gico (CNPq), and COPERSUCAR.We deeply regret the untimely death on July 8th, 2003 of Prof.Roberto V. Santelli, a very dedicated scientist and teacher.
The publication costs of this article were defrayed in part by payment of page charges.This article must therefore be hereby marked “advertisement” in accordance with 18 USC section 1734 solely to indicate this fact.
REFERENCES
Adams, M.D., Kerlavage, A.R., Fleischmann, R.D., Fuldner, R.A., Bult, C.J., Lee, N.H., Kirkness, E.F., Weinstock, K.G., Gocayne, J.D., White, O., et al.1995.Initial assessment of human gene diversity and expression patterns based upon 83 million nucleotides of cDNA sequence.Nature377:3–174.
al Janabi, S.M., Honeycutt, R.J., McClelland, M., and Sobral, B.W. 1993. A genetic linkage map ofSaccharum spontaneumL.‘SES 208.’Genetics
134:1249–1260.
Altschul, S.F., Madden, T.L., Schaffer, A.A., Zhang, J., Zhang, Z., Miller, W., and Lipman, D.J. 1997. Gapped BLAST and PSI-BLAST: A new generation of protein database search programs.Nucleic Acids Res.
25:3389–3402.
TheArabidopsisGenome Initiative.2000.Analysis of the genome sequence of the flowering plantArabidopsis thaliana.Nature
408:796–815.
Bateman, A., Birney, E., Durbin, R., Eddy, S.R., Howe, K.L., and Sonnhammer, E.L.2000.The Pfam protein families database.Nucleic Acids Res.28:263–266.
Benson, D.A., Karsch-Mizrachi, I., Lipman, D.J., Ostell, J., Rapp, B.A., and Wheeler, D.L.2002.GenBank.Nucleic Acids Res.30:17–20. Bremer, G.1961.Problems in breeding and cytology of sugar cane.
Euphytica10:59–78.
Bucheli, C.S., Dry, I.B., and Robinson, S.P. 1996. Isolation of a
full-length cDNA encoding polyphenol oxidase from sugarcane, a C4 grass.Plant Mol. Biol.31:1233–1238.
Buetow, K.H., Edmonson, M.N., and Cassidy, A.B. 1999. Reliable identification of large numbers of candidate SNPs from public EST data.Nat. Genet.21:323–325.
Bugos, R.C.and Thom, M.1993.Glucose transporter cDNAs from sugarcane.Plant Physiol.103:1469–1470.
Carson, D.L.and Botha, F.C.2000.Preliminary analysis of expressed sequence tags for sugarcane.Crop Sci.40:1769–1779.
Deutsch, S., Iseli, C., Bucher, P., Antonarakis, S.E., and Scott, H.S. 2001. A cSNP map and database for human Chromosome 21.Genome Res.
11:300–307.
D’Hont, A.and Glaszmann, J.C.2001.Sugarcane genome analysis with molecular markers, a first decade of research.Proc. Int. Soc. Sugarcane Technol.24:556–559.
D’Hont, A., Grivet, L., Feldmann, P., Rao, S., Berding, N., and Glaszmann, J.C.1996.Characterisation of the double genome structure of modern sugarcane cultivars (Saccharumspp.) by molecular cytogenetics.Mol. Gen. Genet.250:405–413. D’Hont, A., Ison, D., Alix, K., Roux, C., and Glaszmann, J.C. 1998.
Determination of basic chromosome numbers in the genus
Saccharumby physical mapping of ribosomal RNA genes.Genome
41:221–225.
Dufour, P., Deu, M., Grivet, L., D’Hont, A., Paulet, F., Bouet, A., Lanaud, C., Glaszmann, J.C., and Hamon, P. 1997. Construction of a composite sorghum genome map and comparison with sugarcane, a related complex polyploidy.Theor. Appl. Genet.94:409–418. Duggan, D.J., Bittner, M., Chen, Y., Meltzer, P., and Trent, J.M. 1999.
Expression profiling using cDNA microarrays.Nat. Genet.21:10–14. Ecker, J.R.1995.The ethylene signal transduction pathway in plants.
Science268:667–675.
Ellis, J., Dodds, P., and Pryor, T. 2000. Structure, function and evolution of plant disease resistance genes.Curr. Opin. Plant Biol.3:278–284. Ewing, B., Hillier, L., Wendl, M.C., and Green, P. 1998. Base-calling of automated sequencer traces using phred.I.Accuracy assessment.
Genome Res.8:175–185.
Garg, K., Green, P., and Nickerson, D.A. 1999. Identification of candidate coding region single nucleotide polymorphisms in 165 human genes using assembled expressed sequence tags.Genome Res.
9:1087–1092.
Goff, S.A., Ricke, D., Lan, T.H., Presting, G., Wang, R., Dunn, M., Glazebrook, J., Sessions, A., Oeller, P., Varma, H., et al. 2002. A draft sequence of the rice genome (Oryza sativaL.spp.japonica).Science
296:92–100.
Grivet, L., D’Hont, A., Roques, D., Feldmann, P., Lanaud, C., and Glaszmann, J.C.1996.RFLP mapping in cultivated sugarcane (Saccharumspp.): Genome organization in a highly polyploid and aneuploid interspecific hybrid.Genetics142:987–1000.
Grivet, L., Glaszmann, J.C., and Arruda, P. 2001. Sequence polymorphism from EST data in sugarcane: A fine analysis of 6-phosphogluconate dehydrogenase genes.Genet. Mol. Biol.
24:161–167.
Grivet, L., Glaszmann, J.C., Vincentz, M., da Silva, F.R., and Arruda, P. 2003.ESTs as a source for sequence polymorphism discovery in sugarcane: Example of theAdhgenes.Theor. Appl. Genet.
106:190–197.
Hoarau, J., Offmann, B., D’Hont, A., Risterucci, A.M., Roques, D., Glaszmann, J.C., and Grivet, L. 2001. Genetic dissection of a modern sugarcane cultivar (Saccharumspp).I.Genome mapping with AFLP markers.Theor. Appl. Genet.103:84–97.
Huang, X.and Madan, A.1999.CAP3: A DNA sequence assembly program.Genome Res.9:868–877.
Iseli, C., Jongeneel, C.V., and Bucher, P. 1999. ESTScan: A program for detecting, evaluating, and reconstructing potential coding regions in EST sequences.Proc. Int. Conf. Intell. Syst. Mol. Biol.138–148. Kellogg, E.A.1998.Relationships of cereal crops and other grasses.Proc.
Natl. Acad. Sci.95:2005–2010.
Kumar, A.S., Moore, P.H., and Maretzki, A. 1992. Amplification and cloning of sugarcane sucrose synthase cDNA by anchored PCR.PCR
Methods Appl.2:70–75.
Lee, S., Reth, A., Meletzus, D., Sevilla, M., and Kennedy, C. 2000. Characterization of a major cluster ofnif,fix, and associated genes in a sugarcane endophyte,Acetobacter diazotrophicus.J. Bacteriol.
182:7088–7091.
Leite, A., Cord Neto, G., Vettore, A.L., Yunes, J.A., and Arruda, P. 1999. Prolamins of sorghum, coix and millets.InSeed proteins(eds.R. Casey and P.R.Shewry), pp.141–157.Kluwer Publishers, Dordrecht. Lu, Y., D’Hont, A., Paulet, F., Grivet, L., Arnaud, M., and Glaszmann,
J.C.1994.Molecular diversity and genome structure in modern sugarcane varieties.Euphytica78:217–226.
Manning, K.1991.Isolation of nucleic acids from plants by differential solvent precipitation.Anal. Biochem.195:45–50.
McCarty, D.R.and Chory, J.2000.Conservation and innovation in plant signaling pathways.Cell103:201–209.
Ming, R., Liu, S.C., Lin, Y.R., da Silva, J., Wilson, W., Braga, D., van Deynze, A., Wenslaff, T.F., Wu, K.K., Moore, P.H., et al. 1998. Detailed alignment ofSaccharumandSorghumchromosomes: Comparative organization of closely related diploid and polyploid genomes.Genetics150:1663–1682.
Morton, C.J.and Campbell, I.D.1994.SH3 domains.Molecular ‘Velcro.’
Curr. Biol.4:615–617.
Ng, M.and Yanofsky, M.F.2001.Function and evolution of the plant MADS-box gene family.Nat. Rev. Genet.2:186–195.
Patton, E.E., Willems, A.R., and Tyers, M. 1998. Combinatorial control in ubiquitin-dependent proteolysis: Don’t Skp the F-box hypothesis.
Trends Genet.14:236–243.
Picoult-Newberg, L., Ideker, T.E., Pohl, M.G., Taylor, S.L., Donaldson, M.A., Nickerson, D.A., and Boyce-Jacino, M. 1999. Mining SNPs from EST databases.Genome Res.9:167–174.
Rafalski, A.2002.Applications of single nucleotide polymorphisms in crop genetics.Curr. Opin. Plant Biol.5:94–100.
Riechmann, J.L., Heard, J., Martin, G., Reuber, L., Jiang, C., Keddie, J., Adam, L., Pineda, O., Ratcliffe, O.J., Samaha, R.R., et al. 2000.
Arabidopsistranscription factors: Genome-wide comparative analysis among eukaryotes.Science290:2105–2110.
Shoemaker, R., Keim, P., Vodkin, L., Retzel, E., Clifton, S.W., Waterston, R., Smoller, D., Coryell, V., Khanna, A., Erpelding, J., et al. 2002. A compilation of soybean ESTs: Generation and analysis.Genome
45:329–338.
Telles, G.P.and da Silva, F.R.2001.Trimming and clustering sugarcane ESTs.Genet. Mol. Biol.24:17–23.
Telles, G.P., Braga, M.V.D., Dias, Z., Quitzau, J.A.A., da Silva, F.R., and Meidanis, J.2001.Bioinformatics of the sugarcane EST project.
Genet. Mol. Biol.24:8–15.
Tomkins, J.P., Yu, Y., Miller-Smith, H., Frisch, D., Woo, S.S., and Wing, R.A.1999.A bacterial artificial chromosome library for sugarcane.
Theor. Appl. Genet.99:419–424.
Van der, H.R., Ronning, C., Giovannoni, J., Martin, G., and Tanksley, S. 2002.Deductions about the number, organization, and evolution of genes in the tomato genome based on analysis of a large expressed sequence tag collection and selective genomic sequencing.Plant Cell
14:1441–1456.
Vettore, A.L., da Silva, F.R., Kemper, E.L., and Arruda, P. 2001. The libraries that made SUCEST.Genet. Mol. Biol.24:1–7. Whitfield, C.W., Band, M.R., Bonaldo, M.F., Kumar, C.G., Liu, L.,
Pardinas, J.R., Robertson, H.M., Soares, M.B., and Robinson, G.E. 2002.Annotated expressed sequence tags and cDNA microarrays for studies of brain and behavior in the honey bee.Genome Res.
12:555–566.
Wolfe, K.H., Gouy, M., Yang, Y.W., Sharp, P.M., and Li, W.H. 1989. Date of the monocot–dicot divergence estimated from chloroplast DNA sequence data.Proc. Natl. Acad. Sci.86:6201–6205. Yu, J., Hu, S., Wang, J., Wong, G.K., Li, S., Liu, B., Deng, Y., Dai, L.,
Zhou, Y., Zhang, X., et al. 2002. A draft sequence of the rice genome (Oryza sativaL.spp.indica).Science296:79–92.
WEB SITE REFERENCES
http://apps.fao.org; FAOSTAT Home Page.
http://mips.gsf.de/proj/thal/db/tables/tables_func_frame.html; MATDB tables.
http://sucest.lad.ic.unicamp.br/public; SUCEST Home Page. http://www.genome.ad.jp/kegg/kegg2.html; KEGG Encyclopedia. http://www.mips.biochem.mpg.de/cgi-bin/proj/thal/filter_funcat.pl?all;
A. thaliana.Browse all contigs by functional catalog. http://www.ncbi.nlm.nih.gov/cgi-bin/COG/palog?fun=all; COGs
Functional annotation.
http://www.phrap.org/; The Phred/Phrap/Consed System Home Page. http://www.tigr.org/docs/tigr-scripts/egad_scripts/role_report.spl; EGAD
Cellular Roles.