Type 2 Diabetic Rats on Diet Supplemented
With Chromium Malate Show Improved
Glycometabolism, Glycometabolism-Related
Enzyme Levels and Lipid Metabolism
Weiwei Feng1, Ting Zhao2, Guanghua Mao3, Wei Wang1, Yun Feng4, Fang Li4, Daheng Zheng1, Huiyu Wu5, Dun Jin2, Liuqing Yang2*, Xiangyang Wu3*
1School of Food and Biological Engineering, Jiangsu University, Zhenjiang, Jiangsu, China,2School of Chemistry and Chemical Engineering, Jiangsu University, Zhenjiang, Jiangsu, China,3School of the Environment and Safety Engineering, Jiangsu University, Zhenjiang, Jiangsu, China,4School of Medical Science and Laboratory Medicine, Jiangsu University, Zhenjiang, Jiangsu, China,5School of Pharmacy, Jiangsu University, Zhenjiang, Jiangsu, China
*yangliuqing@ujs.edu.cn(LY);wuxy@ujs.edu.cn(XW)
Abstract
Our previous study showed that chromium malate improved the regulation of blood glucose in mice with alloxan-induced diabetes. The present study was designed to evaluate the ef-fect of chromium malate on glycometabolism, glycometabolism-related enzymes and lipid metabolism in type 2 diabetic rats. Our results showed that fasting blood glucose, serum in-sulin level, inin-sulin resistance index and C-peptide level in the high dose group had a signifi-cant downward trend when compared with the model group, chromium picolinate group and chromium trichloride group. The hepatic glycogen, glucose-6-phosphate dehydrogenase, glucokinase, Glut4, phosphor-AMPKβ1 and Akt levels in the high dose group were signifi-cantly higher than those of the model, chromium picolinate and chromium trichloride groups. Chromium malate in a high dose group can significantly increase high density lipoprotein cholesterol level while decreasing the total cholesterol, low density lipoprotein cholesterol and triglyceride levels when compared with chromium picolinate and chromium trichloride. The serum chromium content in chromium malate and chromium picolinate group is signifi-cantly higher than that of the chromium trichloride group. The results indicated that the cura-tive effects of chromium malate on glycometabolism, glycometabolism-related enzymes and lipid metabolism changes are better than those of chromium picolinate and chromium trichloride. Chromium malate contributes to glucose uptake and transport in order to im-proved glycometabolism and glycometabolism-related enzymes.
OPEN ACCESS
Citation:Feng W, Zhao T, Mao G, Wang W, Feng Y, Li F, et al. (2015) Type 2 Diabetic Rats on Diet Supplemented With Chromium Malate Show Improved Glycometabolism, Glycometabolism-Related Enzyme Levels and Lipid Metabolism. PLoS ONE 10(5): e0125952. doi:10.1371/journal. pone.0125952
Academic Editor:Marta Letizia Hribal, University of Catanzaro Magna Graecia, ITALY
Received:October 25, 2014
Accepted:March 28, 2015
Published:May 5, 2015
Copyright:© 2015 Feng et al. This is an open access article distributed under the terms of the
Creative Commons Attribution License, which permits unrestricted use, distribution, and reproduction in any medium, provided the original author and source are credited.
Data Availability Statement:All relevant data are within the paper and its Supporting Information files.
Funding:This work was supported financially by Specialized Research Fund for the Natural Science Foundation of China (31271850), Graduate innovative projects in Jiangsu University (CXLX13_685).
Introduction
Type 2 diabetes (T2D), which appears after age 40 and accounts for more than 90% of diabetes cases, is a serious public health problem [1,2]. T2D is a problem found worldwide, including in China. Previous studies have shown that diet, as well as genetic and environmental parameters, can induce T2D [3–6]. Moreover, T2D is implicated in disorders of glycometabolism, glycome-tabolism-related enzymes, and lipid metabolism. Furthermore, T2D is associated with compli-cations such as learning and memory deficits, changes in intestinal flora, diabetic nephropathy, diabetic peripheral neuropathy and psychological distress. Suge et al [7] have reported that T2D can induce impairment in brain function, resulting in learning deficits. Michelle et al [8] reported that subjects with T2D performed significantly lower than healthy subjects on tests of cognitive ability. Xu et al [9] have reported that T2D patients also exhibit changes in intestinal flora. These complications can negatively affect patients’health and quality of life, especially amongst ethnic minorities and populations living in remote areas [10]. Currently, medical treatment is an effective means of managing T2D [11]. Some drugs, including biguanides, sul-fonylureas, insulin and traditional Chinese medicines, can maintain blood sugar levels by re-ducing hepatic glycogen output, stimulating insulin secretion or increasing insulin sensitivity, respectively. However, diabetes and diabetes-related complications can not be cured. Treat-ment of T2D cost the United States $245 billion in 2012, including $176 billion in direct medi-cal costs [12]. Pharmacologimedi-cal treatment cannot always prevent or alleviate diabetes-related complications. However, studies have shown that a healthy diet and exercise can also be effec-tive in managing T2D [13,14].
Chromium (Cr) occurs in the environment primarily in two common oxidation states: Cr (III) and Cr(VI) [15]. It is a beneficial micronutrient and has shown significant anti-diabetic activity [16–18]. Insulin level and sensitivity drop when the body lacks sufficient chromium, re-sulting in disorders of glucose and lipid metabolism. Studies have found that Cr can regulate lipid metabolism and enhance insulin sensitivity [19–21]. However, inorganic chromium com-pounds such as chromium trichloride have some drawbacks, including low absorption rate and toxicity [22,23]. Organic chromium complexes, including chromium picolinate, chromium nicotinate and chromium yeast, have been widely used as functional food ingredients and nutritional supplements. To date, chromium picolinate is the organic complex most commonly utilized as a dietary supplement. However, it has been reported that ingestion of chromium pi-colinate can result in genotoxicity and cytotoxicity thought to be caused by the ligand (picoli-nate), thus raising questions regarding the compound’s safety [24–26]. Use of chromium nicotinate and chromium yeast as supplements is not widespread due to poor solubility and unstable structure, respectively. Therefore, characterizing the anti-hyperglycemic activity of novel and non-toxic organic chromium complexes is an important problem.
flora were studied. This study will provide a basis for research and development of a safe, non-toxic organic chromium complex with a high absorption rate.
Methods
Ethics statement
All the experimental procedures were conducted in accordance with The Code of Ethics of the World Medical Association (Declaration of Helsinki) for experiments involving humans, EC Directive 86/609/EEC for animal experiments and approved by the Jiangsu University Com-mittee on Animal Care and Use(the license number SYXK (SU) 2013–0036). Sprague-Dawley rats were procured from the Jiangsu University. Sprague-Dawley rat is not a protected nor en-dangered species. Our experiments complied with the laws and ethical recommendations cur-rently in effect in China where the experiments were performed. The rats were anaesthetized by anhydrous diethyl ether in order to ameliorate suffering. Then the rats were sacrificed at unconscious situation.
Materials and chemicals
The chromium (III) malate was synthesized according to the method described by Li et al. [28] in our research group. Chromium picolinate and chromium trichloride were obtained from Sinopharm Chemical Reagent Co., Ltd (Shanghai, China). Cholesterol and sodium cholate hy-drate were produced at Hubei Hongyun long biological technology Co. Ltd. and Henan zhengxing food additive co., Ltd, respectively. Streptozotocin(STZ) was obtained from Sigma Chemical Co. Distilled water was used throughout the whole experiments.
Experimental animals and diets
Male Sprague-Dawley rats (180±10g) were procured from the Jiangsu University for the exper-iment. The distilled water was supplied during the entire experimental period. The tempera-tures of the rats house and relative humidity were 24±1°C and 55–60%, respectively.
Study design and Models of T2D
The rats were randomly divided into eight groups of ten animals. In the first two months, high sugar and high fat diet was supplied to rats. The main components of the feed are standard rat pellet diet(78.25%), lard(10%), sucrose(10%), Cholesterol(1.5%) and Sodium cholate hydrate (0.25). STZ was dissolved in citrate buffer at pH 4.5. Rats were injected with STZ through intra-peritoneal injection at a dose of 30 mg/kg body weight. Following the injection, standard rat pellet diet and distilled water were available during the remaining 4 weeks of the experiment. The equal volume of 0.9% saline was given to normal rats. Three days later, fasting blood glu-cose (FBG) levels were measured by one touch glucometer. Blood sample was drawn from the tail vein of rats. At this point, the oral glucose tolerance test and insulin resistance test were conducted. The FBG levels of rats were 33.3mmol/L>FBG11.1 mmol/L, accompanied by oral glucose tolerance and insulin resistance reduced were taken as successful induction of T2D.
Anti-hyperglycemic Activity of chromium malate
Glycometabolism and glycometabolism-related enzymes study
After the rats were sacrificed on the 29 days, the serum and liver were collected. Rat ELISA kits were used to assay serum insulin and C-peptide (C-P) in the samples of rat,s blood serum. In-sulin resistance index (IR) was calculated by this formula.
IR¼ Insulin=22:5e lnFBG ð1Þ
Hepatic glycogen level was estimated according to the glycogen assay kit (Nanjing Jiancheng biological technology Co. Ltd.). The liver was homogenized in ice-cold physiological saline at the same time. The homogenate was centrifuged at 10000 g for 10 min, and then collected su-pernatant. Glucose-6-phosphate dehydrogenase (G6PD) and glucokinase (GCK) in the liver supernatant were assayed by rat ELISA kits.
Glucose uptake and transport study
BRL rat hepatic cell was maintained at 37°C in a humidified atmosphere of 5% CO2and grown
in DMEM-high glucose supplemented with 10% foetal bovine serum. The BRL rat hepatic cell was incubated with 110–6mol/L insulin for 24 h and then treated with chromium malate, chromium picolinate and chromium trichloride for 24 h. Protein was extracted and determined using the total protein extraction kit and BCA proteinassay kit, respectively. Western blot was used to analysis the target protein(Glut4, phosphor-AMPKβ1 and Akt). The bands of the target protein were scanned, and the relative density of each band was calculated with Quantity One software. The relative density of the target protein was normalized to the density of GAPDH.
Lipid metabolism study
The serum, which was collected on the 29 days, was used to measure lipid content. Total cho-lesterol (TC), low density lipoprotein chocho-lesterol (LDL), high density lipoprotein chocho-lesterol (HDL) and triglyceride (TG) levels in blood serum were measured by enzymatic colorimetric method using a reagent kit (Dong’ou Jinma Technology, Co., Ltd., Zhejiang, China). Blood serum (0.1 mL) was transferred to the tube containing operating fluid, and the mixture was heated at 37°C for 5 min. The sample was measured by its absorption at 546 nm.
Cr content analysis
The serum and organ (heart, liver, spleen, lung, kidney, brain) of rats, which were collected in above experiment, were used to measure Cr content. Literatures have reported that ICP meth-od can be used for determination of Cr in rat serum and organs [27,29]. Vista-MPX
Table 1. The experiment design and the dose of chromium malate,chromium picolinate and chromi-um trichloride.
Group Rats Dose (Cr,μg/kg bw)
Normal control group Normal rats 0
Model group Type 2 diabetic rats 0
Chromium picolinate group Type 2 diabetic rats 20.0 Chromium trichloride group Type 2 diabetic rats 20.0 Chromium malate group (Low dose group) Type 2 diabetic rats 10.0 Chromium malate group (Middle dose group) Type 2 diabetic rats 15.0 Chromium malate group (High dose group) Type 2 diabetic rats 20.0 Chromium malate control group Normal rats 20.0
Simultaneous Inductively coupled plasma (ICP) method (Varian, Inc. USA) was used to deter-mination of Cr content.
Histopathological analyses
The rats’liver and kidney were undergone hematoxylin and eosin staining, and then examined macroscopically. The methods of staining were estimated according to the method of Wu et al. [27]. The morphology of the liver and kidney were visually observed for signs of toxicity.
The organ index analysis
The heart, liver, spleen, lung, kidney, brain and hippocampus were collected and weighed when the rats were sacrificed. Relative heart/liver/spleen/lung/kidney/brain weights were ex-pressed as the ratio of the heart/liver/spleen/lung/kidney/brain to body weight (mg/g).
The hematological and biochemical analysis
Blood samples of normal rats and type 2 diabetic rats were collected through retro-orbital puncture on the 29 days. The blood samples were centrifuged at 10000 g for 10 min in order to get blood serum. Then the anti-coagulated blood and serum were used for hematological and biochemical analyses.
Learning and memory ability and related enzymes study
Morris water maze test. The Morris water maze test was used to evaluate the spatial learn-ing abilities of rats and perform uslearn-ing the method of Enomoto et al. [30] with slight modifica-tion. At the end of the experimental period, rats were trained for 3 trials per day for 4 days. The training time was 120 s. The rats’escape latency and swimming speed to arrive the platform were measured. The space exploration experiment was carried out at the same time.
The related enzyme analysis. The hippocampus of rat was collected after the rats were sacrificed. The hippocampus was homogenized in ice-cold physiological saline. The homoge-nate was centrifuged at 10000 g for 10 min, and then the supernatant was collected. The super-oxide dismutase (SOD), glutathione peroxidase (GSH-PX) and acetylcholinesterase (AChE) in supernatant were analyzed by UV—2450 UV-vis spectrophotometer (SHIMADZU, Japan).
Effect of chromium malate on intestinal flora changes of rats
On the last day of the experiment, the faeces of rats were collected at aseptic conditions. The gram staining was used to detect the number of intestinal flora in normal rats and type 2 dia-betic rats. The smear was immobilized by fired, and then crystal violet dye solution was used to staining for 1 minute. Then the iodine liquid, decoloring liquid and after dyeing liquid were used to staining in turn. The gram-positive bacteria (G+b), gram-negative bacteria (G-b), gram-positive cocci (G+c) and gram-negative cocci (G-c) were examined under the microscope (10 × 40 times, 200 bacterial).
Statistical analysis
Results and Discussion
Models of T2D
The FBG levels of STZ-induced type 2 diabetic rats were 33.3 mmol/L>FBG11.1 mmol/L. The change in FBG levels of normal rats and T2D rats following oral gavage of glucose was monitored (S1 Fig). STZ-induced T2D rats exhibited significant hyperglycemia. As shown in S1B Fig, the AUC0–3hof FBG in type 2 diabetic rats was significantly higher than that of normal
rats at 1159.50±103.24 and 4722.00±292.55 for T2D and normal rats, respectively. The insulin levels and insulin resistance (IR) of type 2 diabetic rats were significantly higher than those of normal rats. Consistent with our results, Kim et al [31] have reported that rats with diabetes ex-hibit decreased insulin sensitivity. IR of type 2 diabetic rats and normal rats were 0.81±0.05 and 3.74±0.43, respectively. These data were consistent with results published by Salido et al [32]. In other experiments, plasma glucose levels were assessed in non-fasted animals [33]. But the FBG levels of rats were 33.3mmol/L>FBG11.1 mmol/L, accompanied by oral glucose tolerance and insulin resistance reduced. Together, these results confirmed that the rat model of type 2 diabetes is a success.
Anti-hyperglycemic activity of chromium malate
To investigate the anti-hyperglycemic activity of chromium malate on T2D, type 2 diabetic rats were examined on the 2nd, 3rd and 4th weeks following administration of chromium ma-late (Fig 1). Four weeks after administration of chromium mama-late, FBG levels had declined and remained at approximately 11.54 mmol/L (at a dose of 20.0μg Cr /kg bw) close to FBG
Fig 1. The fasting blood glucose (FBG) level (mmol/L) changes of normal and type 2 diabetic rats were treated with chromium malate.Chromium picolinate and chromium trichloride was used as a positive control. Each value was presented as means±SD (n = 10).aSignificantly different from normal control group
(P<0.05).bSignificantly different from model group (P<0.05).cSignificantly different from chromium
picolinate group (P<0.05).dSignificantly different from chromium trichloride group (P<0.05).
levels of normal rats (5.56–11.11 mmol/L) [34]. FBG levels differed significantly between the chromium malate treated group and model group. The anti-hyperglycemic activity of chromi-um malate exhibits a dose dependency. The FBG levels of rats treated with 10, 15 and 20μg
Cr/day/kg bw were 16.23, 13.10 and 11.54 mmol/L, respectively. Additionally, the results showed that FBG level decreased significantly with extended time of feeding with chromium malate. The changes in FBG levels of type 2 diabetic rats following oral gavage of chromium malate, chromium picolinate and chromium trichloride were compared in this study. The re-sults confirmed that the anti-hyperglycemic activity of chromium malate (at a dose of 20.0μg
Cr/kg bw) as indicated by FBG levels was superior to that of chromium picolinate (18.07 mmol/L, at a dose of 20.0μg Cr/kg bw) and chromium trichloride (20.25 mmol/L, at a dose of
20.0μg Cr/kg bw). The FBG levels of rats in the chromium malate middle and high dose
groups decreased significantly when compared with rats in the chromium picolinate and chromium trichloride groups. The anti-hyperglycemic activity of chromium malate is better than that of chromium picolinate and chromium trichloride. Moreover, chromium malate has no obvious effect on FBG level of normal rats.
Glycometabolism and glycometabolism-related enzymes study
Effects of chromium malate on the serum insulin and IR of rats. The changes in serum insulin and IR of normal rats and type 2 diabetic rats following administration of chromium malate, chromium picolinate and chromium trichloride by oral gavage are shown in Fig2A and2B. From these results, it was deduced that chromium malate, chromium picolinate and chromium trichloride can reduce serum insulin and IR levels. The IR level of type 2 diabetic rats treated with chromium picolinate and chromium trichloride decreased significantly when compared with type 2 diabetic rats in the model group, while serum insulin levels remained comparable. In addition, the serum insulin and IR levels of type 2 diabetic rats decreased with administration of chromium malate in a dose-dependent manner. The serum insulin and IR levels of type 2 diabetic rats in the high dose group were most significantly decreased when compared with the model, chromium picolinate and chromium trichloride groups. Moreover, administration of chromium malate has no obvious effect on serum insulin and IR levels of normal rats.
Effects of chromium malate on the serum C-P changes of rats. C-P is secreted by pan-creaticβcells, and its total amount is equivalent with that of insulin. It is an important index for detection of insulin. The serum C-P changes of normal rats and type 2 diabetic rats follow-ing administration of chromium malate, chromium picolinate and chromium trichloride by an oral gavage are shown inFig 2C. It can be observed that chromium malate, chromium picoli-nate and chromium trichloride can reduce serum C-P level. However, the C-P levels of the chromium picolinate and chromium trichloride groups showed no significant decrease when compared with the model group. It can be observed that the C-P level of type 2 diabetic rats is significantly higher than that of normal rats. The serum C-P levels show a decreasing trend after administration of chromium malate. The serum C-P level of the high dose group was sig-nificantly decreased when compared with the model, chromium picolinate and chromium trichloride groups. Additionally, chromium malate has no obvious effect on the serum C-P level of normal rats. The curative effects of chromium malate on C-P changes are better than those of chromium picolinate and chromium trichloride.
observed that chromium malate and chromium picolinate can increase the content of hepatic glycogen, while chromium trichloride causes no such increase. The hepatic glycogen content of type 2 diabetic rats in the chromium picolinate group showed no significant increase when compared with model group. The results showed that the amount of hepatic glycogen in type 2 diabetic rats is significantly lower than in normal rats. The middle dose and high dose groups showed a significant increase in the amount of hepatic glycogen when compared with the chro-mium picolinate and chrochro-mium trichloride groups. Therefore, the curative effect of chrochro-mium malate on increased hepatic glycogen was better than that of chromium picolinate and chromium trichloride.
Effects of chromium malate on G6PD and GCK levels in rats. G6PD and GCK are key enzymes in glucose metabolism found in the liver. Changes in G6PD and GCK levels in chro-mium malate, chrochro-mium picolinate and chrochro-mium trichloride treated rats are shown inFig 3. Chromium malate, chromium picolinate and chromium trichloride can increase the content of G6PD (Fig 3A). However, the G6PD content of type 2 diabetic rats treated with chromium pi-colinate and chromium trichloride did not increase significantly when compared with model group. The results showed that the amount of G6PD in type 2 diabetic rats is significantly lower than that in normal rats. Chromium malate can significantly increase the content of G6PD in the middle and high dose groups when compared with model group. The G6PD
Fig 2. Effects of chromium malate on the serum insulin (A), insulin resistance index (IR) (B), serum C-P (C) and hepatic glycogen content changes (D) changes of normal rats and type 2 diabetic rats.Chromium picolinate and chromium trichloride was used as a positive control. Each value was presented as means±SD (n = 10).aSignificantly different from normal control group (P<0.05).bSignificantly different from model group (P<0.05).c
Significantly different from chromium picolinate group (P<0.05).dSignificantly different from chromium trichloride group (P<0.05).
Fig 3. Effects of chromium malate on the Glucose-6-phosphate dehydrogenase (G6PD) (A) and Glucokinase (GCK) (B) content changes of normal rats and type 2 diabetic rats.Chromium picolinate and chromium trichloride was used as a positive control. Each value was presented as means±SD (n = 10).a
Significantly different from normal control group (P<0.05).bSignificantly different from model group
(P<0.05).cSignificantly different from chromium picolinate group (P<0.05).dSignificantly different from
chromium trichloride group (P<0.05).
content of type 2 diabetic rats in the high dose group is significantly higher than that of chro-mium picolinate and chrochro-mium trichloride groups. Results for GCK content are similar to those obtained for G6PD (Fig 3B). The content of GCK in the middle and high dose groups is significantly increased compared to the model, chromium picolinate and chromium trichloride groups. In conclusion, chromium malate is more effective at treating increased G6PD and GCK content than chromium picolinate and chromium trichloride.
Glucose uptake and transport study
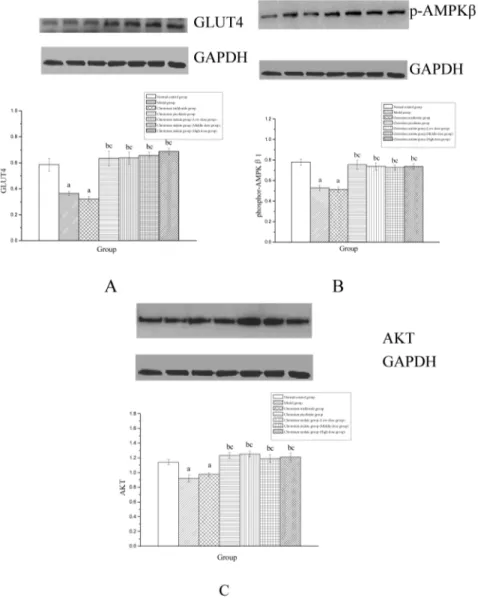
The mechanism of chromium malate to glucose uptake and transport in BRL rat hepatic cell with insulin resistance is shown inFig 4. The results indicated that chromium malate (at a dose of 5, 10 and 20.0μg Cr/mL) can significant increase Glut4, phosphor-AMPKβ1 and Akt levels.
The Glut4, phosphor-AMPKβ1 and Akt levels of chromium malate group are significantly
Fig 4. The mechanism of chromium malate to glucose uptake and transport in BRL rat hepatic cell with insulin resistance.aSignificantly different from normal control group (P<0.05).bSignificantly different
from model group (P<0.05).cSignificantly different from chromium trichloride group (P<0.05).dSignificantly
different from chromium picolinate group (P<0.05).
higher than those of BRL rat hepatic cell with insulin resistance in the model and chromium trichloride groups. The Glut4, phosphor-AMPKβ1 and Akt levels of chromium malate (at a dose of 20.0μg Cr/mL) group are same as chromium picolinate group. In conclusion,
Chromi-um malate contributes to glucose uptake and transport in order to improved glycometabolism and glycometabolism-related enzymes. And chromium malate is more effective at treating in-creased Glut4, Akt and phosphor-AMPKβ1 levels than chromium trichloride.
Lipid metabolism study
The serum lipids mainly include TC, LDL, HDL and TG. The ability of chromium malate to alter serum TC, LDL, HDL and TG levels in normal rats and type 2 diabetic rats is shown in Fig 5. The results indicated that chromium malate can reduce serum TC, LDL and TG levels in type 2 diabetic rats. The serum TC, LDL and TG levels of type 2 diabetic rats in the high dose group were significantly lower than those of type 2 diabetic rats in the model, chromium picoli-nate and chromium trichloride groups. The results also revealed that the reduction of TC, LDL and TG levels in type 2 diabetic rats by chromium malate is dose dependent. While the levels of serum TC, LDL and TG in the chromium picolinate and chromium trichloride groups were lower than those in the model group, the difference was not significant. As shown inFig 5C, chromium malate can increase serum HDL level in type 2 diabetic rats. The HDL level of the high dose group was significantly higher than that of the model, chromium picolinate and
Fig 5. The total cholesterol (TC) (A), low density lipoprotein cholesterol (LDL) (B), high density lipoprotein cholesterol (HDL) (C) and triglyceride (TG) (D) level changes of normal rats and type 2 diabetic rats were treated with chromium malate.Chromium picolinate and chromium trichloride was used as a positive control. Each value was presented as means±SD (n = 10).aSignificantly different from normal
control group (P<0.05).bSignificantly different from model group (P<0.05).cSignificantly different from
chromium trichloride groups. However, the chromium picolinate and chromium trichloride groups did not show a significantly increased HDL level. The results confirmed that chromium malate was more effective than chromium picolinate and chromium trichloride at altering lipid metabolism. These data of Cr can significantly alter lipid metabolism in diabetic rats were consistent with results published by Jain et al [35] and Sahin et al [36]. They found that supple-mentation with chromium picolinate at a dose of 80 or 400μg/ Cr kg bw can significantly alter
TC and TG levels in diabetic rats.
Cr content analysis
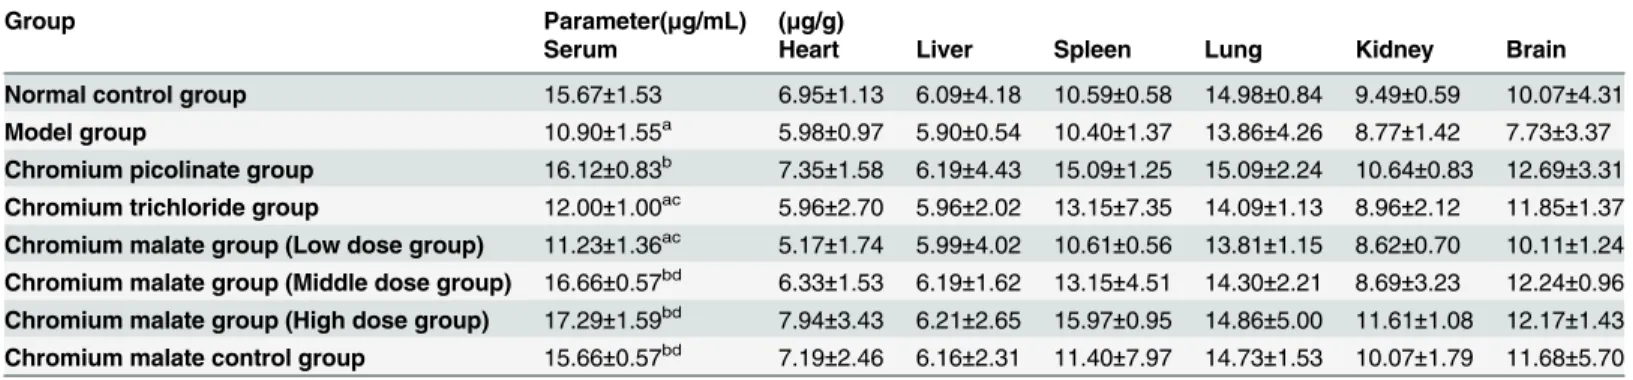
The content of Cr in serum, heart, liver, spleen, lung, kidney and brain is shown inTable 2. The serum Cr content of type 2 diabetic rats is significantly lower than in normal rats. Howev-er, there are no significant decrease in the Cr content of heart, livHowev-er, spleen, lung, kidney and brain. This finding illustrates that T2D can reduce Cr content in serum. Chromium malate, chromium picolinate and chromium trichloride group can increase the Cr content in serum and organs. The serum Cr content of chromium malate and chromium picolinate treated groups is significantly higher than that of the model group. As seen fromTable 2, the serum Cr content of chromium trichloride group was significantly lower than the Cr content of the mium malate and chromium picolinate treated groups. This outcome illustrated that the chro-mium malate and chrochro-mium picolinate absorption was higher than that of the chrochro-mium trichloride group and the absorption rate of chromium malate was the same as that of chromi-um picolinate. The amount of Cr in rat serchromi-um is higher than in organs. It can be observed that the highest Cr content within the high dose group is found in the spleen, followed by—in de-scending order—the lungs, kidneys, brain, heart, and liver.
Effect of chromium malate on Body Mass changes in rats
The body mass changes of normal rats and type 2 diabetic rats treated with chromium malate are shown in theS2 Fig. It can be observed that the body mass of rats increased with an increase in feeding time in the normal control group, chromium picolinate group, low dose group, mid-dle dose group, high dose group of chromium malate control group in the third and fourth weeks. The type 2 diabetic rats, which were fed with chromium malate, showed signs of body
Table 2. Effects of chromium malate (Cr content) on the biochemical changes in the serum and organs of normal rats and type 2 diabetic rats.
Group Parameter(μg/mL) (μg/g)
Serum Heart Liver Spleen Lung Kidney Brain
Normal control group 15.67±1.53 6.95±1.13 6.09±4.18 10.59±0.58 14.98±0.84 9.49±0.59 10.07±4.31 Model group 10.90±1.55a 5.98±0.97 5.90±0.54 10.40±1.37 13.86±4.26 8.77±1.42 7.73±3.37
Chromium picolinate group 16.12±0.83b 7.35±1.58 6.19±4.43 15.09±1.25 15.09±2.24 10.64±0.83 12.69±3.31
Chromium trichloride group 12.00±1.00ac 5.96±2.70 5.96±2.02 13.15±7.35 14.09±1.13 8.96±2.12 11.85±1.37
Chromium malate group (Low dose group) 11.23±1.36ac 5.17±1.74 5.99±4.02 10.61±0.56 13.81±1.15 8.62±0.70 10.11±1.24
Chromium malate group (Middle dose group) 16.66±0.57bd 6.33±1.53 6.19±1.62 13.15±4.51 14.30±2.21 8.69±3.23 12.24±0.96
Chromium malate group (High dose group) 17.29±1.59bd 7.94±3.43 6.21±2.65 15.97±0.95 14.86±5.00 11.61±1.08 12.17±1.43
Chromium malate control group 15.66±0.57bd 7.19±2.46 6.16±2.31 11.40±7.97 14.73±1.53 10.07±1.79 11.68±5.70
Chromium picolinate and chromium trichloride was used as a positive control. Each value was presented as means±SD (n = 10).
aSigni
ficantly different from normal control group (P<0.05).
bSigni
ficantly different from model group (P<0.05).
cSigni
ficantly different from chromium picolinate group (P<0.05).
dSigni
ficantly different from chromium trichloride group (P<0.05).
mass gain. There was a significant increase in the high dose group when compared with the model group. However, the body mass level of the chromium picolinate group and the chromi-um trichloride group did not increase significantly when compared with the model group.
Histopathological analyses
The liver and kidney microanatomical features changes of the normal rats and type 2 diabetic rats are shown inFig 6. Cell necrosis, cell nucleus appeared cracking or dissolved and cell swell were not found in this study. The intact cells of liver, brain, kidney and testis/uterus can be found in this study. It can be observed that chromium malate has no-measurable damage to liver and kidney. Acute toxicities of chromium malate were tested by Wu et al [27] at a dose of 2.42 g Cr /kg with a single oral gavage. The results shown that chromium malate has no-mea-surable toxicity and consistent with ours.
Effects of chromium malate on relative organ weight in rats
The relative organ weights of the heart, liver, spleen, lung, kidney and brain in chromium ma-late, chromium trichloride and chromium picolinate-treated rats are shown in theS1 Table. Chromium malate, chromium picolinate and chromium trichloride did not significantly alter
Fig 6. Effects of chromium malate on liver (A) and kidney (B) microanatomical features changes of the normal rats and type 2 diabetic rats. Chromium picolinate and chromium trichloride was used as a positive control. a–h represents Normal control group, Model group, Chromium picolinate
group, Chromium trichloride group, Low dose group, Middle dose group, High dose group, chromium malate control group, respectively.
relative organ weight when compared to the model group. The results indicated that chromium malate has no effect on the relative organ weight of type 2 diabetic rats. Li et al and Staniek et al [28,37] have also reported that chromium malate does not significantly affect the relative organ weight in diabetic rats and consistent with ours.
The hematological and biochemical analysis
The biochemical and hematological analyses of normal rats and type 2 diabetic rats following administration of chromium malate, chromium picolinate and chromium trichloride by oral gavage are indicated in theS2andS3Tables, respectively. The biochemical indicators of chro-mium malate group did not change significantly when compared with the normal control group and the model group. These biochemical indicators are an important index of liver func-tion. The results of hematological analyses are similar to those of our biochemical analyses (S3 Table). These results showed that chromium malate did not markedly affect biochemical and hematological indicators.
Learning and memory ability and related enzymes study
Morris water maze test. In this study, the normal rats and type 2 diabetic rats were sub-jected to the morris water maze test. The escape latency of type 2 diabetic rats was longer than that of normal rats, whereas their swimming speed was slower than that of normal rats (Fig7A and7B). Reports in the literature have indicated that T2D can affect learning and memory functions of rats [38,39]. Chromium malate (at a dose of 15.0 and 20.0μg Cr/kg bw) can
signif-icantly decrease escape latency and increase swimming speed in type 2 diabetic rats. In con-trast, treatment with chromium picolinate and chromium trichloride generated no significant change in these two indicators. The data of the high dose group changed significantly when compared with the model, chromium picolinate and chromium trichloride groups. The space exploration experiment of the normal rats and type 2 diabetic rats is shown in Fig7C,7Dand 7E. Chromium malate (dose 20.0μg Cr/kg bw) can significantly increase the original platform
quadrant stops, residence time and swimming speed in type 2 diabetic rats. The results differed significantly when compared with the model, chromium picolinate and chromium trichloride groups. The curative effects of chromium malate on learning and memory ability were better than those of chromium picolinate and chromium trichloride.
The related enzyme analysis. Effects of chromium malate on SOD, GSH-Px and TChE ac-tivity in the hippocampus of normal rats and type 2 diabetic rats are shown inFig 8. The activi-ty of SOD, GSH-Px and TChE were found to be significantly decreased in activi-type 2 diabetic rats compared to normal rats. Qiu et al [40] have shown that hippocampal damage will affect the learning and memory function of rats. Chromium malate and chromium picolinate can in-crease the activity of SOD, GSH-Px and TChE in type 2 diabetic rats. The data of the high dose group have a significant increase when compared with those of the model group, chromium pi-colinate group and chromium trichloride group. However, the activity of SOD, GSH-Px and TChE of the chromium picolinate group and chromium trichloride group has no significant in-crease when compared with the model group. The curative effects of chromium malate im-prove the activity of SOD, GSH-Px and TChE better than that of chromium picolinate and chromium trichloride.
Effect of chromium malate on intestinal flora changes of rats
Fig 7. Effects of chromium malate on escape latency (A) and swimming speed (B) changes in the Morris water maze test.The original platform quadrant stops (A), residence time (B) and swimming speed (C) changes in space exploration experiment was tested at the same time. Chromium picolinate and chromium trichloride was used as a positive control. Each value was presented as means±SD (n = 10).aSignificantly different from normal control group
(P<0.05).bSignificantly different from model group (P<0.05).cSignificantly different from chromium picolinate group (P<0.05).dSignificantly different
from chromium trichloride group (P<0.05).
Fig 8. Effects of chromium malate on superoxide dismutase (SOD), glutathione peroxidase (GSH-Px) and true choline esterase (TChE) activity changes on hippocampus of normal rats and type 2 diabetic rats.Chromium picolinate and chromium trichloride was used as a positive control. Each value was presented as means±SD (n = 10).aSignificantly different from normal control group (P<0.05).bSignificantly different from model group
(P<0.05).cSignificantly different from chromium picolinate group (P<0.05).dSignificantly different from chromium trichloride group (P<0.05). doi:10.1371/journal.pone.0125952.g008
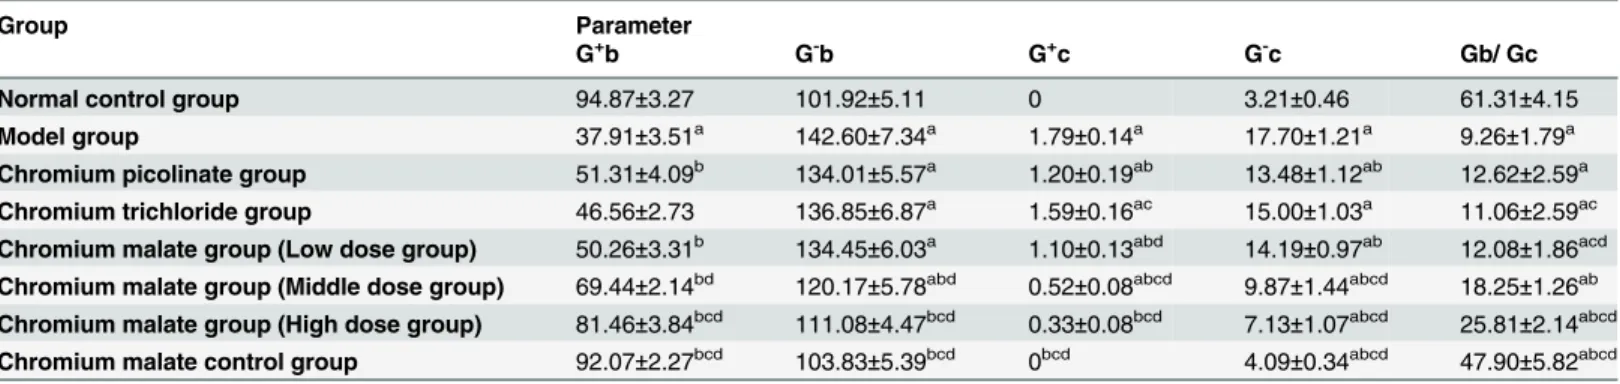
Table 3. Effects of chromium malate on intestinal flora of normal rats and type 2 diabetic rats.
Group Parameter
G+b G-b G+c G-c Gb/ Gc
Normal control group 94.87±3.27 101.92±5.11 0 3.21±0.46 61.31±4.15 Model group 37.91±3.51a 142.60±7.34a 1.79±0.14a 17.70±1.21a 9.26±1.79a
Chromium picolinate group 51.31±4.09b 134.01±5.57a 1.20±0.19ab 13.48±1.12ab 12.62±2.59a
Chromium trichloride group 46.56±2.73 136.85±6.87a 1.59±0.16ac 15.00±1.03a 11.06±2.59ac
Chromium malate group (Low dose group) 50.26±3.31b 134.45±6.03a 1.10±0.13abd 14.19±0.97ab 12.08±1.86acd
Chromium malate group (Middle dose group) 69.44±2.14bd 120.17±5.78abd 0.52±0.08abcd 9.87±1.44abcd 18.25±1.26ab
Chromium malate group (High dose group) 81.46±3.84bcd 111.08±4.47bcd 0.33±0.08bcd 7.13±1.07abcd 25.81±2.14abcd
Chromium malate control group 92.07±2.27bcd 103.83±5.39bcd 0bcd 4.09±0.34abcd 47.90±5.82abcd
Chromium picolinate and chromium trichloride was used as a positive control. Each value was presented as means±SD (n = 10).
aSigni
ficantly different from normal control group (P<0.05).
bSigni
ficantly different from model group (P<0.05).
cSigni
ficantly different from chromium picolinate group (P<0.05).
dSigni
ficantly different from chromium trichloride group (P<0.05).
increase the number of G+b and Gb/Gc. The result of the high dose group was significantly higher than that of the model group, chromium picolinate group and chromium trichloride group. However, the data of the chromium trichloride group show no significant changes when compared with model group. At the same time, it can be observed that the number of G+b and Gb/Gc were decreased in type 2 diabetic rats and were significantly lower than that of normal rats. Many diseases can change the structure of the human intestinal bacteria [41], such as diabetes, autism, parkinson’s disease, multiple sclerosis, and rheumatoid arthritis. Therefore, it can be observed that the curative effects of chromium malate on improving the structure of intestinal flora are better than those of chromium picolinate and chromium trichloride.
Conclusion
Chromium malate exhibits greater benefits in treating type 2 diabetic-induced glycometabo-lism, glycometabolism-related enzyme activites and lipid metabolism disorders than chromium picolinate and chromium trichloride. The absorption rate of chromium malate and chromium picolinate is significantly higher than that of chromium trichloride. Chromium malate can sig-nificantly improve the learning and memory ability of T2D rats and the expression of related enzymes (SOD, GSH-PX and AChE), as well as the structure of intestinal flora, more efficiently than chromium picolinate and chromium trichloride. Therefore, it can be concluded that chro-mium malate can be used as an anti-diabetic functional food and nutritional supplement. The mechanisms of its anti-hyperglycemic activity, improvement of learning and memory capabili-ty and the structure of intestinal flora will be further investigated.
Supporting Information
S1 Fig. Fasting blood glucose (FBG) level—time curves.(A) and area under curves (AUC) (B) of FBG in normal rats and types 2 diabetic rats, 3 days after intraperitoneal injection of STZ. Data are expressed as means ± SD. Number 1: the AUC of 30min, Number 2: the AUC of 60min, Number 3: the AUC of 120min, Number 4: the AUC of 180min.Significantly different from normal rats (P<0.05).
(DOC)
S2 Fig. The body mass (g) changes of normal and type 2 diabetic rats were treated with chromium malate.Chromium picolinate and chromium trichloride was used as a positive control. Each value was presented as means±SD (n = 10).aSignificantly different from normal control group (P<0.05).bSignificantly different from model group (P<0.05).cSignificantly different from chromium picolinate group (P<0.05).dSignificantly different from chromium trichloride group (P<0.05).
(DOC)
S1 File. Ethics Statement. (DOC)
S1 Table. Effects of chromium malate on relative organ weights changes of normal rats and type 2 diabetic rats.Chromium picolinate and chromium trichloride was used as a positive control. Each value was presented as means±SD (n = 10).aSignificantly different from normal control group (P<0.05).bSignificantly different from model group (P<0.05).cSignificantly different from chromium picolinate group (P<0.05).dSignificantly different from chromium trichloride group (P<0.05).
S2 Table. Effects of chromium malate on the biochemical changes on serum of normal rats and type 2 diabetic rats.Chromium picolinate and chromium trichloride was used as a posi-tive control. Each value was presented as means±SD (n = 10). ALT = alanine transaminase, AST = aspartate transaminase, ALP = alkaline phosphatase, TP = total protein, BUN = blood urea nitrogen, Crea = creatinine.aSignificantly different from normal control group
(P<0.05).bSignificantly different from model group (P<0.05).cSignificantly different from chromium picolinate group (P<0.05).dSignificantly different from chromium trichloride group (P<0.05).
(XLS)
S3 Table. Effects of chromium malate on the hematological changes on peripheral blood of normal rats and type 2 diabetic rats.Chromium picolinate and chromium trichloride was used as a positive control. Each value was presented as means±SD (n = 10). WBC = white blood cell, LYMPH = lymphocyte count, MNCC = mononuclear cell count, NCC = neutral cell count, RBC = red blood cell, HCT = hemataocrit, MCV = mean corpuscular volume,
RDW = Red cell distribution width, Hb = hemoglobin, MHbC = mean hemoglobin content, HCT = hemataocrit, MCV = mean corpuscular volume, RDW = Red cell distribution width, Hb = hemoglobin, MHbC = mean hemoglobin content.aSignificantly different from normal control group (P<0.05).bSignificantly different from model group (P<0.05).cSignificantly different from chromium picolinate group (P<0.05).dSignificantly different from chromium trichloride group (P<0.05).
(XLS)
Author Contributions
Conceived and designed the experiments: WF LY XW. Performed the experiments: WF HW DJ. Analyzed the data: WF. Contributed reagents/materials/analysis tools: TZ GM WW YF FL DZ. Wrote the paper: WF LY XW.
References
1. He YH, Jiang GX, Yang Y, Huang HE, Li R, Li XY, et al. (2009) Obesity and its associations with hyper-tension and type 2 diabetes among Chinese adults age 40 years and over. Nutrition 25:1143–1149.
doi:10.1016/j.nut.2009.04.003PMID:19592220
2. Williams R, Van Gaal L, Lucioni C (2002) Assessing the impact of complications on the costs of Type II diabetes. Diabetologia 45:S13–S17. PMID:12136406
3. Nah WH, Koh IK, Ahn HS, Kim MJ, Kang HG, Jun JH, et al. (2012) Effect of Spirulina maxima on sper-matogenesis and steroidogenesis in streptozotocin-induced type I diabetic male rats. Food Chemistry 134:173–179.
4. Anekwe TD, Rahkovsky I (2014) The Association Between Food Prices and the Blood Glucose Level of US Adults With Type 2 Diabetes. American Journal of Public Health 4:678–685.
5. Yousefidaredor H, Zare-Bidaki M, Hakimi H, Assar S, Bagheri V, Arababadi MK (2014) IL-17A plays an important role in induction of type 2 diabetes and its complications. Asian Pacific Journal of Tropical Diseases 4:412–415.
6. Jangale NM, Devarshi PP, Dubal AA, Ghule AE, Koppikar SJ, Bodhankar SL, et al. (2013) Dietary flax-seed oil and fish oil modulates expression of antioxidant and inflammatory genes with alleviation of pro-tein glycation status and inflammation in liver of streptozotocin—nicotinamide induced diabetic rats.
Food Chemistry 1:187–195. doi:10.1093/emph/eot016PMID:24481198
7. Suge R, Shimazu T, Hasegawa H, Inoue I, Hayashibe H, Nagasaka H, et al. (2012) Cerebral antioxi-dant enzyme increase associated with learning deficit in type 2 diabetes rats. Brain Research 1481:97–106. doi:10.1016/j.brainres.2012.08.056PMID:22981416
9. Xu J, Zhao M, Qian DW, Shang EX, Jiang S, Guo JM, et al. (2014) Comparative metabolism of Radix scutellariae extract by intestinal bacteria from normal and type 2 diabetic mice in vitro. Journal of Ethno-pharmacology 153: 368–374. doi:10.1016/j.jep.2014.02.020PMID:24632019
10. Kuznetsov L, Griffin SJ, Davies MJ, Lauritzen T, Khunti K, Rutten GEHM, et al. (2014) Diabetes-specific quality of life but not health status is independently associated with glycaemic control among patients with type 2 diabetes: A cross-sectional analysis of the ADDITION-Europe trial cohort. Diabetes Re-search and Clinical Practice 104:281–287. doi:10.1016/j.diabres.2013.12.029PMID:24636627
11. Vries STD, Keers JC, Visser R, Zeeuw DE, Haaijer-Ruskamp FM, Voorham J, et al. (2014) Medication beliefs, treatment complexity, and non-adherence to different drug classes in patients with type 2 diabe-tes. Journal of Psychosomatic Research 76:134–138. doi:10.1016/j.jpsychores.2013.11.003PMID: 24439689
12. American Diabetes Association (2013) Economic costs of diabetes in the U.S. in 2012. Diabetes Care 36, 1033–1046. doi:10.2337/dc12-2625PMID:23468086
13. Vassy JL, Meigs JB (2012) Is Genetic testing useful to predict type 2 diabetes?. Best Practice & Re-search Clinical Endocrinology & Metabolism 26:189–201.
14. Veerapur VP, Prabhakar KR, Thippeswamy BS, Bansal P, Srinivasan KK, Unnikrishnan MK (2012) An-tidiabetic effect of Ficus racemosa Linn. stem bark in high-fat diet and low-dose streptozotocin-induced type 2 diabetic rats: A mechanistic study. Food Chemistry 132:186–193.
15. Song NN, Zhong X, Li B, Li JM, Wei DP, Ma YB (2014) Development of a Multi-Species Biotic Ligand Model Predicting the Toxicity of Trivalent Chromium to Barley Root Elongation in Solution Culture. PLOS ONE 9:1–10.
16. Izbicki JA, Ball JW, Bullen TD, Sutley SJ (2008) Chromium, chromium isotopes and selected trace ele-ments, western Mojave Desert, USA. Applied Geochemistry 23:1325–1352.
17. Sharma S, Agrawal RP, Choudhary M, Jain S, Goyal S, Agarwal V (2011) Beneficial effect of chromium supplementation on glucose, HbA1C and lipid variables in individuals with newly onset type-2 diabetes. Journal of Trace Elements in Medicine and Biology 25:149–153. doi:10.1016/j.jtemb.2011.03.003
PMID:21570271
18. Król E, Krejpcio Z (2011) Evaluation of anti-diabetic potential of chromium(III) propionate complex in high-fat diet fed and STZ injected rats. Food and Chemical Toxicology 49:3217–3223 doi:10.1016/j. fct.2011.09.006PMID:21939728
19. Hao C, Hao JJ, Wang W, Han ZR, Li GS, Zhang LJ, et al. (2011) Insulin Sensitizing Effects of Oligo-mannuronate-Chromium (III) Complexes in C2C12 Skeletal Muscle Cells. PLOS ONE 6:1–10.
20. Król E, Krejpcio Z (2010) Chromium(III) propionate complex supplementation improves carbohydrate metabolism in insulin-resistance rat model. Food and Chemical Toxicology 48:2791–2796. doi:10. 1016/j.fct.2010.07.008PMID:20633590
21. Yang XP, Palanichamy K, Ontko AC, Rao MNA, Fang CX, Ren J, et al. (2005) A newly synthetic chro-mium complex—chromium(phenylalanine)3 improves insulin responsiveness and reduces whole body
glucose tolerance. Febs Letters 579:1458–1464. PMID:15733857
22. Fang ZJ, Zhao M, Zhen H, Chen LF, Shi P, Huang ZW (2014) Genotoxicity of Tri- and Hexavalent Chro-mium Compounds In Vivo and Their Modes of Action on DNA Damage In Vitro. PLOS ONE 9:1–9.
23. Vincent JB (2004) Recent advances in the nutritional biochemistry of trivalent chromium. Proceedings of the Nutrition Society 63:41–47. PMID:15070438
24. Hepburn DDD, Marcel Burney J, Woski SA, Vincent JB (2003) The nutritional supplement chromium pi-colinate generates oxidative DNA damage and peroxidized lipids in vivo. Polyhedron 22:455–463.
25. Manygoats KR, Yazzie M, Stearns DM (2002) Ultrastructural damage in chromium picolinate-treated cells: a TEM study. Journal of Biological Inorganic Chemistry 7:791–798. PMID:12203015
26. Whittaker P, San RHC, Clarke JJ, Seifried HE, Dunkel VC (2005) Mutagenicity of chromium picolinate and its components in Salmonella typhimurium and L5178Y mouse lymphoma cells. Food and Chemi-cal Toxicology 43:1619–1625. PMID:16040181
27. Wu XY, Li F, Xu WD, Zhao JL, Zhao T, Liang LH, et al. (2011) Anti-hyperglycemic Activity of Chromium (III) Malate Complex in Alloxan-Induced Diabetic Rats. Biological Trace Element Research 143:1031–
1043. doi:10.1007/s12011-010-8916-6PMID:21161430
28. Li F, Wu XY, Zou YM, Zhao T, Zhang M, Feng WW, et al. (2012) Comparing anti-hyperglycemic activity and acute oral toxicity of three different trivalent chromium complexes in mice. Food and Chemical Tox-icology 50:1623–1631. doi:10.1016/j.fct.2012.02.012PMID:22366098
29. Sereshti H, Khojeh V, Samadi S (2011) Optimization of dispersive liquid—liquid microextraction
30. Enomoto T, Ishibashi T, Tokuda K, Ishiyama T, Toma S, Ito A (2008) Lurasidone reverses MK-801-induced impairment of learning and memory in the Morris water maze and radial-arm maze tests in rats. Behavioural Brain Research 186:197–207. PMID:17881065
31. Kim DS, Kim TW, Kang JS (2004) Chromium picolinate supplementation improves insulin sensitivity in Goto-Kakizaki diabetic rats. Journal of Trace Elements in Medicine and Biology 17:243–247. PMID: 15139386
32. Salido EM, Zavalía ED, Schreier L, Laurentiis AD, Rettori V, Chianelli M, et al. (2012) Retinal changes in an experimental model of early type 2 diabetes in rats characterized by non-fasting hyperglycemia. Experimental Neurology 236:151–160. doi:10.1016/j.expneurol.2012.04.010PMID:22554865
33. Ibrahim MA, Islam MS (2014) Anti-diabetic effectsoftheacetonefractionof Senna singueana stem bar-kina type 2 diabetes rat model. Journal of Ethnopharmacology 153:392–399. doi:10.1016/j.jep.2014. 02.042PMID:24583108
34. Bordbar AK, Creagh AL, Mohammadi F, Haynes CA, Orvig C (2009) Calorimetric studies of the interac-tion between the insulin-enhancing drug candidate bis(maltolato)oxovanadium(IV) (BMOV) and human serum apotransferrin. Journal of Inorganic Biochemistry 103:643–647. doi:10.1016/j.jinorgbio.2008. 10.009PMID:19056126
35. Jain SK, Rains JL, Croad JL (2007) Effect of chromium niacinate and chromium picolinate supplemen-tation on lipid peroxidation, TNF-α, IL-6, CRP, glycated hemoglobin, triglycerides, and cholesterol lev-els in blood of streptozotocin-treated diabetic rats. Free Radical Biology and Medicine 43:1124–1131.
PMID:17854708
36. Sahin K, Onderci M, Tuzcu M, Ustundag B, Cikim G, Ozercan IH, et al. (2007) Effect of chromium on carbohydrate and lipid metabolism in a rat model of type 2 diabetes mellitus: the fat-fed, streptozotocin-treated rat. Metabolism 56:1233–1240. PMID:17697867
37. Staniek H, Krejpcio Z, Iwanik K (2010) Evaluation of the acute oral toxicity class of tricentric chromium (III) propionate complex in rat. Food and Chemical Toxicology 48:859–864. doi:10.1016/j.fct.2009.12. 022PMID:20036299
38. Hasanein P, Shahidi S (2010) Effects of combined treatment with vitamins C and E on passive avoid-ance learning and memory in diabetic rats. Neurobiology of Learning and Memory 93:472–478. doi: 10.1016/j.nlm.2010.01.004PMID:20085822
39. Rahigude A, Bhutada P, Kaulaskar S, Aswar M, Otari K (2012) Participation of antioxidant and choliner-gic system on protective effect of naringenin against type-2 diabetes-induced memory dysfunction in rats. Neuroscience 226:62–72. doi:10.1016/j.neuroscience.2012.09.026PMID:22999973
40. Qiu CY, Cheng SQ, Xia YY, Peng B, Tang Q, Tu BJ (2011) Effects of subchronic benzo(a)pyrene expo-sure on neurotransmitter receptor gene expression in the rats hippocampus related with spatial learning and memory change. Toxicology 289:83–90. doi:10.1016/j.tox.2011.07.012PMID:21839799