(IJACSA) International Journal of Advanced Computer Science and Applications, Vol.5, No.7, 2014
30 | P a g e www.ijacsa.thesai.org
A Second Correlation Method for Multivariate
Exchange Rates Forecasting
Agus Sihabuddin, Subanar, Dedi Rosadi, Edi Winarko
Computer Science Graduate Program, Faculty of Mathematics and Natural Science, Gadjah Mada University, Yogyakarta Indonesia
Abstract—Foreign exchange market is one of the most complex dynamic market with high volatility, non linear and irregularity. As the globalization spread to the world, exchange rates forecasting become more important and complicated. Many external factors influence its volatility. To forecast the exchange rates, those external variables can be used and usually chosen based on the correlation to the predicted variable. A new second correlation method to improve forecasting accuracy is proposed. The second correlation is used to choose the external variable with different time interval. The proposed method is tested using six major monthly exchange rates with Nonlinear Autoregressive with eXogenous input (NARX) compared with Nonlinear Autoregressive (NAR) for model benchmarking. We evaluated the forecasting accuracy of proposed method is increasing by 16.8% compared to univariate NAR model and slight better than linear correlation on average for Dstat parameter and gives almost no improvement for MSE.
Keywords—forecasting; foreign exchange; NARX; second correlation
I. INTRODUCTION
Exchange rate forecasting has proven to be predicted and univariate exchange rate forecasting gives a good forecast accuracy[1]. However, univariate specifications are limited. Those limitations are the market could be efficient and only driven from outside indicators, the available time series are too short for significant technical analysis with the chosen forecasting horizon[2], univariate model for some exchange rates do not provide a good forecast [3].
Multivariate time series analysis is an important statistical tool to study the behavior of time dependent data and forecast the future values depending on the historical data. With multivariate time series analysis, important dynamic inter-relationship among variables of interest like central bank interest rate, interest rate spread, and other exchange rates movements can be captured.
Research in exchange rates forecasting often uses daily, weekly or even monthly data. In multivariate exchange rates forecasting, monthly data is more often used than daily or weekly data due to the relationship with interest rate and inflation data that comes monthly [4], less volatile than the daily data and more referred to nonlinear data [5].
In this paper, we evaluate that the forecast accuracy could be improved by adding another external variable to capture that interrelationship by second correlation method. The advantage of this method is a simple technique to choose external variable
for a neural networks with still a good generalization capability [6]. A neural network algorithm is used because there is no need to specify a particular model and the model is adaptively formed based on the features presented from the data [1].
The rest of the paper is organized as follows. Section 2 discusses related work, Section 3 describes proposed correlation method, Section 4, presents experiment procedure and some experiment results, Section 5 presents the conclusion of the paper, and finally the future work is presented in Section 6.
II. RELATED WORK
Correlation is one of the most powerful tools for measuring linear relationship between two exchange rates or inter market relationships and evaluating inputs for neural networks [7]. Many research have elaborated correlation [2], [3], [8], [9] to measure relationships between series and evaluating input.
As the global economics keeps changing so the inter market connection changed too, so constant correlation to choose appropriate input may not be suitable. If input variables do not represents relevant ones, neural networks could not be expected to accurately predict the dependant variables or computational resources are wasted during training. In a case of a currency union like USDEUR there are divergent dynamics of real effective exchange rates in the individual country and form a new equilibrium [10].
III. SECOND CORRELATION
The research goals were sets as follows:
1) Introduce to a second correlation to choose another
variable to a neural networks algorithm.
2) Investigate the accuracy contribution of the method if
it makes the accuracy increase or not.
The second correlation described as follows:
1) Compute the correlation coefficient for specific time
interval if there is new exchange rates equilibrium, in this case the USDEUR came into the exchange rates market and change the equilibrium.
2) Use variable with highest correlation as input to
(IJACSA) International Journal of Advanced Computer Science and Applications, Vol.5, No.7, 2014
31 | P a g e www.ijacsa.thesai.org
the exchange market by USDEUR. It is can be seen from the market share liquidity of USDEUR before 2001 was just near 0% and then since 2001 was 37.9% and became the second most liquid currency after USD (89.9%) [11]. The correlation with time interval of 2000 until 2014 of interest rate, interest rate spread and other exchange rates are used to choose external variable rather than using all time correlation data.
A NARX network is used to test the proposed method (M3) compared to usual correlation method (M2) for multivariate forecasting model, and Nonlinear Autoregressive (NAR) (M1) for univariate model.
IV. EXPERIMENTS AND RESULTS
A. Data
The exchange rates data used here are 40 years close price of major rates monthly data from January 1975 until April 2014. The dataset is long enough so we can see the effect of fundamental data on the market [7]. The major exchange rates used here are USDAUD, USDCAD, USDJPY, USDGBP, USDEUR and USDCHF which are the major exchange rates in the foreign exchange market and 65.2% of exchange market liquidity in April 2013 [11]. Each data contains 472 records which is divided into 80% (377 data) for training, 5% (24 data) for validation, and 15% (71 data) for testing, this data partition is similar to[12]–[15].
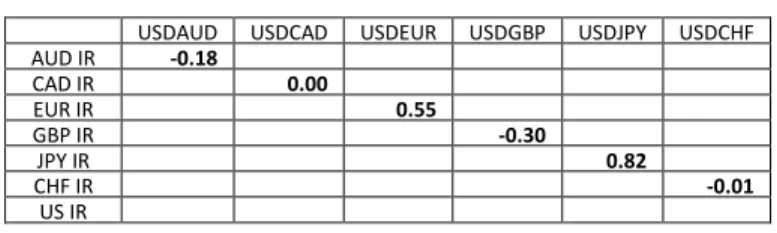
The external inputs or variables are the central bank interest rates, interest rate spread between two countries or region, and other exchange rates. The interest rates data are taken from Reserve Bank of Australian [16], Bank of Canada [17], De Nederlansche Bank [18], Bank of England [19], Bank of Japan [20], Swiss National Bank [21], and Federal Reserve [22]. The interest rates and its spread correlations for six currencies do not give enough clues to be included in the external variables except for Japan interest rate and USDJPY (0.82). Correlation between interest rates and exchange rates is presented in Table I.
TABLE I. INTEREST RATE CORRELATION (1975-2014)
USDAUD USDCAD USDEUR USDGBP USDJPY USDCHF AUD IR -0.18
CAD IR 0.00
EUR IR 0.55
GBP IR -0.30
JPY IR 0.82
CHF IR -0.01
US IR
IR : Interest Rate The interest rate spread correlation of two countries is presented in Table 2.
TABLE II. INTEREST RATE SPREAD CORRELATION (1975-2014)
IRS USDAUD USDCAD USDEUR USDGBP USDJPY USDCHF USD-AUD IRS 0.54
USD-CAD IRS 0.25 USD-EUR IRS -0.15 USD-GBP IRS -0.11
USD-JPY IRS 0.54
USD-CHF IRS -0.01
IRS : Interest Rate Spread
Exchange rates correlation among six currencies gives two pairs of correlation those may be chosen for external variables. Those are USDAUD-USDCAD (0.83) and USDJPY-USDCHF (0.91). The exchange rates correlation among six countries or regions is presented in Table III.
TABLE III. EXCHANGE RATES CORRELATION (1975-2014)
Correlation USDAUD USDCAD USDEUR USDGBP USDJPY USDCHF USDAUD 1.00 0.83 0.44 0.53 -0.50 -0.20 USDCAD 1.00 0.57 0.46 -0.19 0.07 USDEUR 1.00 0.68 0.31 0.57 USDGBP 1.00 -0.21 0.05
USDJPY 1.00 0.91
USDCHF 1.00
B. Second Correlataion Process
The correlation coefficient between of interest rate and exchange rate from 2000 until 2014 (Table IV) does not give enough clues because of low value of correlation to make it as one of external variable.
TABLE IV. INTEREST RATE CORRELATION (2000-2014)
IR Correlation
USDAUD USDCAD USDEUR USDGBP USDJPY USDCHF AUD IR 0.23 0.16 0.11 -0.51 0.42 0.39 CAD IR 0.57 0.50 0.51 -0.22 0.67 0.72 EUR IR 0.69 0.60 0.55 -0.14 0.74 0.76 GBP IR 0.62 0.56 0.47 -0.34 0.79 0.74 JPY IR -0.27 -0.37 -0.28 -0.33 -0.08 -0.14 CHF IR 0.57 0.45 0.54 -0.04 0.57 0.70 US IR 0.48 0.38 0.44 -0.25 0.62 0.66
IR : Interest Rate Correlation coefficient between interest rate spread and exchange rates from year 2000 until 2014 gives better correlation for USDJPY and USDCHF. The correlation data is presented in Table V.
TABLE V. INTEREST RATE SPREAD CORRELATION (2000-2014)
IRS Correlation
USDAUD USDCAD USDEUR USDGBP USDJPY USDCHF USD-AUD
IRS
0.49
USD-CAD IRS 0.02
USD-EUR IRS -0.08
USD-GBP IRS -0.18
USD-JPY IRS 0.65
USD-CHF IRS 0.70
IRS : Interest Rate Spread The correlation coefficient among exchange rates since 2000 until 2014 shows more currencies with stronger correlation. There are USDCAD,
USDAUD-USDEUR, USDCAD-USDEUR, USDAUD-USDCHF,
(IJACSA) International Journal of Advanced Computer Science and Applications, Vol.5, No.7, 2014
32 | P a g e www.ijacsa.thesai.org
TABLE VI. EXCHANGE RATES CORRELATION (2000-2014)
Correlation USDAUD USDCAD USDEUR USDGBP USDJPY USDCHF USDAUD 1.000 0.964 0.907 0.434 0.741 0.945 USDCAD 1.000 0.903 0.429 0.695 0.911 USDEUR 1.000 0.600 0.569 0.913 USDGBP 1.000 -0.129 0.316 USDJPY 1.000 0.757 USDCHF 1.000
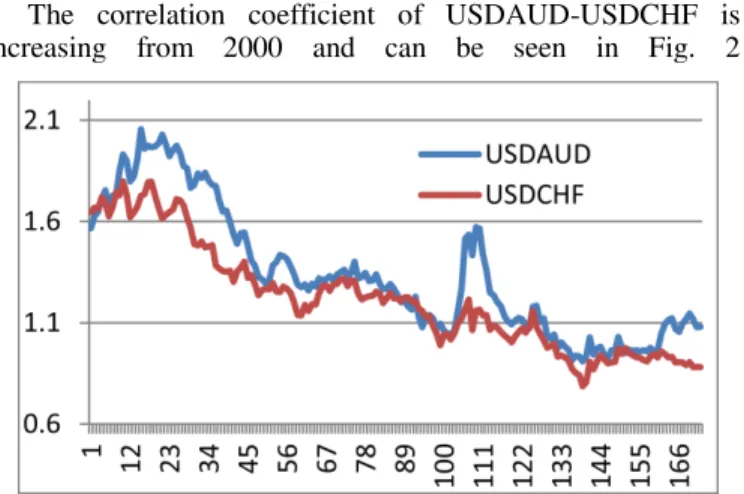
The correlation coefficient of USDAUD-USDCAD at the periods of time 1975 to 2014 is 0.83. To forecast USDAUD, USDCAD should be used as external variable. In 2000-2014 periods, we have USDAUD-USDCAD, USDAUD-USDEUR, and USDAUD-USDCHF with high correlation values. The other USDAUD multivariate forecasting model may choose USDCHF as external variable instead of others. The plot data for USDAUD and USDCHF is presented in Fig. 1.
Fig. 1. Plot data for USDAUD and USDCHF (1975-1999)
The correlation coefficient of USDAUD-USDCHF is increasing from 2000 and can be seen in Fig. 2
Fig. 2. Plot data for USDAUD and USDCHF (2000-2014)
C. Forecast Measure
In order to evaluate the forecast accuracy of the models, two forecast error measurements are used: Mean Square Error
(MSE) and directional statistics (Dstat) . MSE is defined as
follows[23]:
n
t t
n e MSE
1 2
Dstat is defined as follows [3]:
N
t
stat at
N D
1
% 100 * 1
where at=1 if
(
1
)(
1
)
0
t t t
t
x
x
x
x
otherwise 0.
Dstat is more preferable in financial instruments forecasting because it gives the correctness of gradient prediction [3].
D. Result
The result of the proposed method presented in Table VII, VIII, and IX. NAR is used to get the univariate exchange rate forecasting and then compared to adding other variable with correlation from 1975 to 2014, and the other external variable added from the correlation from 2000 to 2014. The external variable for correlation from 1975 and correlation from 2000 for each currency is presented in Table VII.
TABLE VII. EXTERNAL VARIABLES FOR EXCHANGE RATES
FORECASTING
External Variable
USDAUD USDCAD USDEUR USDGBP USDJPY USDCHF M2 USDCAD USDAUD USDGBP USDEUR USDCHF USDJPY M3 USDCHF USDCHF USDCHF USDAUD USDAUD USDAUD
M2 :Model with 1975-2014 correlation M3 :Model with 2000-2014 correlation The result comparison for MSE of proposed method is presented in Table VIII. Our result shows that adding a new variable on model M2 and M3 from six major exchange rates does not gives MSE improvement significantly except for M3 in USDCHF (-84.87%).
TABLE VIII. MSEPERFORMANCE OF UNIVARIATE AND MULTIVARIATE
Ext. Var USDAUD USDCAD USDEUR USDGBP USDJPY USDCHF M1 0.003587 0.001138 0.000667 0.000326 7.5655 0.001375
M2 0.003302 (-7.93%)
0.001101 (-3.16%)
0.000659 (-1.06%)
0.000325 (-0.44)
8.1223 (7.36%)
0.001411 (2.60%)
M3 0.003155 (-12.05%)
0.001082 (-4.93)
0.00066 (-1.08)
0.000336 (-3.17%)
7.3374 (-3.02%)
0.000208 (-84.87%)
The results for Dstat accuracyparameter is more promising in M2 model with best significant accuracy improvement for USDJPY (23.53%); and in M3 model give more significant accuracy improvement for USDCHF (41.46%). For both MSE and Dstat accuracy parameter, USDEUR does not provide good forecasting improvement.
TABLE IX. DSTAT PERFORMANCE OF UNIVARIATE AND MULTIVARIATE
Ext. Var. USDAUD USDCAD USDEUR USDGBP USDJPY USDCHF M1 57.75% 47.89% 60.56% 52.11% 47.89% 57.75%
M2 61.97% (7.31%)
52.11% (8.82%)
61.97% (2.33%)
61.97% (18.92%)
59.15% (23.53%)
60.56% (4.88%)
M3 64.79% (12.19%)
56.34% (17.65%)
61.97% (2.33%)
60.56% (16.22%)
60.53% (26.47%)
81.69% (41.46%)
(IJACSA) International Journal of Advanced Computer Science and Applications, Vol.5, No.7, 2014
33 | P a g e www.ijacsa.thesai.org
Other advantage of using the second correlation method is it gives a simple way to choose an external variable rather than using other more complex algorithm or by trial and error to choose one by one other series.
V. CONCLUSION
The second correlation method does not give MSE improvement significantly. From Dstat it can be seen that this method gives better accuracy with average of 64.08%, higher than univariate model 53.99% accuracy and usual correlation method with 59.62% accuracy. It gives a 19.39% accuracy improvement on average with the highest accuracy is achieved at USDCHF with 81.69% accuracy. It does not give better accuracy for USDEUR in MSE and Dstat.
VI. FUTURE WORK
Our future work will continue to implement the method in the different exchange rates; and combine the method with other such technical indicator.
REFERENCES
[1] G. P. Zhang, “Time Series Forecasting using A Hybrid ARIMA and
Neural Network Model,” Neurocomputing, vol. 50, pp. 159–175, 2003. [2] B. R. Setyawati, R. C. Creese, and M. Jaraiedi, “Neural Networks for
Univariate and Multivariate Time Series Forecasting,” Proceeding 2003 IIE Annu. Conf., 2003.
[3] J. Yao and C. L. Tan, “A Case Study on Using Neural Networks to Perform Technical Forecasting of Forex,” Neurocomputing, vol. 34, no. 1–4, pp. 79–98, Sep. 2000.
[4] B. Majhi, M. Rout, R. Majhi, G. Panda, and P. J. Fleming, “New Robust
Forecasting Models for Exchange Rates Prediction,” Expert Syst. Appl., vol. 39, no. 16, pp. 12658–12670, 2012.
[5] M. C. Medeiros and A. Veiga, “A Hybrid Linear-Neural Model for Time
Series Forecasting.,” IEEE Trans. Neural Networks, vol. 11, no. 6, pp. 1402–12, Jan. 2000.
[6] S. Samarasinghe, Neural Networks for Applied Sciences and Engineering. New York: Auerbach Publication, 2007.
[7] B. R. Setyawati, “Multi-Layer Feed Forward Neural Networks for
Foreign Exchange Time Series Forecasting,” Dissertation, West Virginia University, 2005.
[8] W. Nan and H. Tieshan, “Study on Correlation between Different NDF Data and Fluctuations of RMB Exchange Rate,” Int. J. Econ. Financ., vol. 5, no. 5, pp. 55–63, 2013.
[9] F. H. Nordin, F. H. Nagi, and A. A. Z. Abidin, “Comparison Study of Computational Parameter Values Between LRN and NARX in
Identifying Nonlinear Systems,” Turkish J. Electr. Eng. Comput. Sci., vol. 21, pp. 1151–1165, 2013.
[10] A. Rusek, “The Eurozone ’ s Equilibrium Real Exchange Rates,” Mod. Econ., vol. 3, no. September, pp. 534–541, 2012.
[11] Bank for International Settlements, “Triennial Central Bank Survey Foreign Exchange Turnover in April 2013 : Preliminary Global Results,” 2013.
[12] K. Kim and W. B. Lee, “Stock Market Prediction Using Artificial
Neural Networks with Optimal Feature Transformation,” Neural Comput. Appl., vol. 13, pp. 255–260, 2004.
[13] I. Kaastra and M. Boyd, “Designing A Neural Network for Forecasting
Financial and Economic Time Series,” Neurocomputing, vol. 10, pp. 215–236, 1996.
[14] M. Al Mamun and K. Nagasaka, “Artificial Neural Networks Applied to Long-term Electricity Demand Forecasting,” in Proceedings of the Fourth International Conference on Hybrid Intelligent Systems
(HIS’04), 2004, pp. 0–5.
[15] A. M. Oyewale, “Evaluation of Artificial Neural Networks in Foreign
Exchange Forecasting,” Am. J. Theor. Appl. Stat., vol. 2, no. 4, pp. 94– 101, 2013.
[16] Reserve Bank of Australia, “Monthly Interest Rate 2014,” 2014. [Online]. Available: www.rba.gov.au. [Accessed: 06-Apr-2014]. [17] Bank of Canada, “Monthly Interest Rate,” 2014. [Online]. Available:
www.bankofcanada.ca. [Accessed: 06-Apr-2014].
[18] De Nederlansche Bank, “Monthly Interest rate,” 2014. [Online]. Available: www.dnb.nl. [Accessed: 06-Apr-2014].
[19] Bank of England, “Monthly Interest Rate,” 2014. [Online]. Available: www.bankofengland.co.uk. [Accessed: 06-Apr-2014].
[20] Bank of Japan, “Monthly Interest Rate,” 2014. [Online]. Available: www.boj.or.jp. [Accessed: 06-Apr-2014].
[21] Swiss National Bank, “Monthly Interest Rate,” 2014. [Online]. Available: www.snb.ch. [Accessed: 06-Apr-2014].
[22] Federal Reserve, “Monthly Interest Rate,” 2014. [Online]. Available: www.federalreserve.gov. [Accessed: 06-Apr-2014].
[23] J. G. De Gooijer and R. J. Hyndman, “25 Years of Time Series