610
DETECTING REGIME SWITCHES IN THE EUR/RON EXCHANGE RATE VOLATILITY
Necula Ciprian
The Academy of Economic Studies The Faculty of Finance and Banking Bucharest [email protected]
Radu Alina-Nicoleta
The Academy of Economic Studies The Faculty of Finance and Banking Bucharest [email protected]
In the present study we develop and implement a short term exchange rate forecasting methodology using dynamic confidence intervals based on GARCH processes and we analyze whether this methodology can be used to model a regime switch in the volatility of the EUR/RON exchange rate generated by the change of the reference currency from USD to EUR in March 2003. In order to capture this switch we use in our analysis daily exchange rate returns from 1st of January 1999 to 1st of January 2004. We model the dynamics of the daily returns for the exchange rate by estimating a series of GARCH models, with various specifications for the conditional mean and for the conditional variance. The best specification is a FIGARCH (1, d, 0), a long memory process accounting for volatility persistence. The main finding is that there was a significant decrease in the volatility of the EUR/RON exchange rate after March 2003.
Keywords: conditional heteroskedasticity, regime switch, exchange rates, long memory
JEL Classification: C01, C15, C51, C87, E44, E47
1. Introduction
Daily frequency financial data series present some specificăcharacteristics,ăsuchăasătheă„volatilityă clustering‖ă phenomenon.ă Thisă phenomenonă refersă toă theă factă thată onă theă capitală marketă theă conditional variance of the return series is not constant, but variable in time. Nowadays, modeling the volatility of assets returns is the research frontier in financial theory. In order to haveăaăproperăanalysisăofătheă„volatilityăclustering‖ăphenomenon,ăEngleă(1982)ăintroducedăARCHă (AutoRegressive Conditional Heteroskedasticity) processes and Bollerslev (1986) developed a more parsimonious model, GARCH (Generalized ARCH).
To account for the high levels of kurtosis in the distribution of daily returns, a series of GARCH modelsăwithă―fat-tails‖ăinnovationsăwereădeveloped.ăThe Student distribution was employed by Bollerslev (1987) and Kaiser (1996), Nelson (1991) analyzed the „Generalizedă Erroră Distribution‖ă (GED)ă andă Lambertă andă Laurentă (2001)ă developedă aă GARCHă modelă withă ană asymmetric Student distribution. Numerous studies (Harvey, 1993; Ding, Granger and Engle, 1993; Briedt, Crato and Lima, 1998) conclude that the volatility of financial assets is persistent. To model this persistence various GARCH processes with long memory were proposed in the literature. In this category one can mention FIGARCH models (Fractionally Integrated GARCH) developed by Baillie, Bollerslev and Mikkelsen (1996), Bollerslev and Mikkelsen (1996) and Chung (1999).
611
The paper is organized in three sections. In the first section we develop a dynamic confidence interval forecasting methodology based on GARCH processes. In the second section we estimate a series of GARCH model specifications using daily EUR/RON the exchange rate returns. The final section concludes.
2. Exchange Rates Forecasting using Dynamic Confidence Intervals
In order to model the dynamics of daily exchange rate returns, we employ a series of GARCH models with various specifications for the conditional mean and for the conditional variance. Therefore, the daily return series is modeled as
t tt
t
E
r
r
1
(1)where
E
t
is the conditional mean, and
t represents the innovations, with the followingproperties
E
t
0
,
E
t
s
0
,
t
s
. GARCH models imply that conditional variance is not constant in time. Therefore, one can writet t
t
z
(2)where
z
t i.i.d withE
z
t
0
,
Var
z
t
1
, and
t2 is the conditional variance that will be modeled using different specifications.In order to discriminate between various model specifications we employ several informational criteria. We also perform a series of stability tests for the parameters of these models.
Regarding exchange rate forecasting, we employ a dynamic confidence interval methodology based on the conditional variance forecast obtained from the GARCH models. Hence, the 95% confidence interval for the one day return is
rˆt1|t z0.025
ˆt1|t,rˆt1|t z0.975
ˆt1|t
(3)where rˆt1|t is the forecast for the expected one day return,
ˆt1|t the one day forecast of thevolatility, and
z
0.025 andz
0.975 are the 2.5% and 97.5% quantiles of the theoretical distributionemployed in the GARCH model. In conclusion, the 95% confidence interval for
ln
P
t1 (i.e. thelogarithm of the spot exchange rate att1) is
lnPt rˆt1|t z0.025
ˆt1|t,lnPt rˆt1|t z0.975
ˆt1|t
. (4)In case one wants to obtain confidence intervals for a period of h days, one can use the h-days expected return forecast
h i t i t t h t r R 1 | | ˆˆ (5)
and the h-days volatility forecast
h i t i t t h t V 1 2 | 2 | ˆˆ
(6)In these conditions, the 95% confidence interval for the h-days return is
Rˆt1|t z0.025Vˆt1|t,Rˆt1|t z0.975Vˆt1|t
(7)and the 95% confidence interval for
ln
P
th is
lnPt Rˆth|t z0.025Vˆth|t,lnPt Rˆth|t z0.975Vˆth|t
(8)612
In this section we analyze whether the methodology based on GARCH processes can accurately model a regime switch in the volatility of the EUR/RON exchange rate generated by the change of the reference currency from USD to EUR in March 2003. In order to capture this switch we use in our analysis daily exchange rate returns from 1st of January 1999 to 1st of January 2004. First we tested for normality and for heteroskedasticity in the daily EUR/RON exchange rate returns. The Jarque-Bera test rejects the null hypothesis of normal returns. The existence of the autocorrelation in the squared returns (according to Box Pierce Q test) and the existence of the ARCHăeffectsă(accordingătoătheăEngle‘săARCHăLMătest)ăentailătheăusageăofăaăGARCHămodelătoă account for volatility clustering.
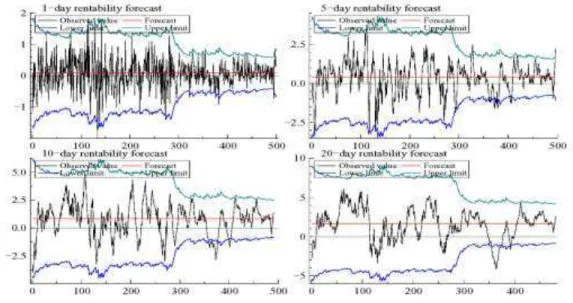
The first estimated model is a classical GARCH (1, 1) model with normal innovations and a constant in the equation of the conditional mean. The estimated parameters are statistically significant, the GARCH process is stationary, but with volatility persistence. The BoxPierce Q test and the ARCH LM test for the squared standardized residues imply that the conditional variance equation is correctly specified. The BoxPierce Q test for the standardized residues suggests that the mean equation is also correctly specified. Since only a constant is required to explain the conditional mean, the EUR/RON exchange rate return dynamics is quite difficult to forecast. The Nyblom stability test rejects the null hypothesis that parameters of the estimated model are stable (i.e. constant in time). As a consequence, we introduced a dummy variable to account for the moment the Central Bank changed the reference currency in March 2003. Henceforth, we estimated a GARCH (1, 1) model with normal innovations and a dummy variable in the conditional variance equation. The parameters of this model are stable, implying that there are no more volatility switches in the analyzed period. Also, according to the informational criteria, this model is superior to the previous one. Figure 1 depicts 1, 5, 10 and 20 days forecasts for the EUR/RON exchange rate return generated by the dummy – GARCH (1, 1) model with normal innovations.
Figure 1 - 95% confidence intervals for the EUR/RON exchange rate return for the estimated dummy - GARCH (1, 1) model with normal innovations and a constant in the mean equation
613
Central Bank introduced euro as the reference currency. This shift in volatility was probably generated by Central Bank interventions on the FOREX market.
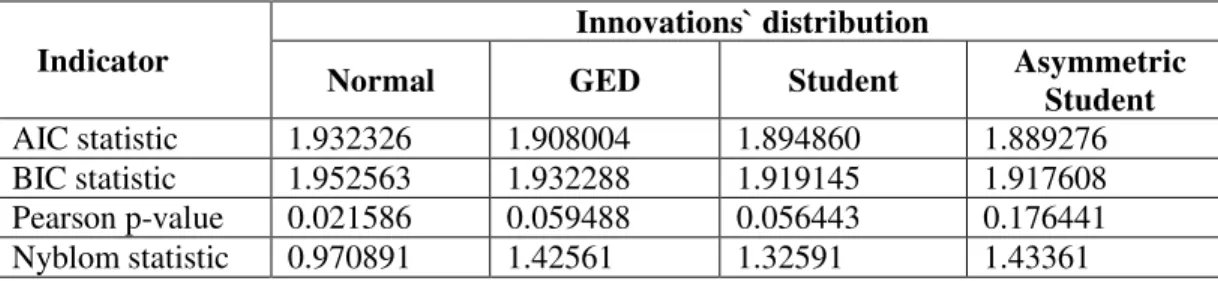
The tests conducted on the residues of the two estimated GARCH models imply that the innovations are not normally distributed. This distribution is leptokurtic and asymmetrical. As a result we estimated a series of dummy - GARCH (1, 1) models having innovations with GED distribution, Student distribution or asymmetric Student distribution. Table 1 presents quality indicators for these models: Akaike informational criterion (AIC), Schwartz informational criterion (BIC), Pearson distribution comparison test, and Nyblom stability test.
Table 1Quality indicators for the estimated dummy - GARCH (1, 1) models with various distributions for the innovations
Indicator
Innovations` distribution
Normal GED Student Asymmetric
Student AIC statistic 1.932326 1.908004 1.894860 1.889276 BIC statistic 1.952563 1.932288 1.919145 1.917608
Pearson p-value 0.021586 0.059488 0.056443 0.176441
Nyblom statistic 0.970891 1.42561 1.32591 1.43361
The Pearson test for the estimated GARCH (1, 1) model with an asymmetric distribution of the innovations indicated a higher probability than for the other estimated models that the theoretical distribution is identical to the empirical one. In addition, according to the informational criteria, the asymmetric Student distribution model is superior to the other GARCH (1, 1) processes. This can be explained by the fact that the theoretical distribution is not only leptokurtic, but also asymmetrical, implying a better fit to the empirical distribution.
614
Figure 2 - 95% confidence intervals for EUR/RON exchange rate return for the estimated dummy - FIGARCH (1, d, 0) model with asymmetric Student innovations and a constant in the mean equation
Having identified the best specification for the variance equation, next, we modeled the conditional mean using autoregressive processes. The only statistically significant specification consists of an ARFIMA (1, d, 0), a long memory process. The Nyblom test implies that the parameters are stable, and the Box Pierce Q and ARCH LM tests suggest that the mean equation and the conditional variance are correctly specified. However, according to the informational criteria, this model is not superior to the models that have only a constant in the equation of the conditional mean.
4. Concluding remarks
In the present study we analyzed whether a dynamic confidence intervals forecasting methodology based on GARCH processes can be used to model a regime switch in the volatility of the EUR/RON exchange rate generated by the change of the reference currency from USD to EUR in March 2003. In order to capture this switch we used in our analysis daily exchange rate returns from 1st of January 1999 to 1st of January 2004.
We estimated a series of GARCH models, with various specifications for the conditional mean and for the conditional variance. The best specification for the mean equation is a constant specification. Due to the simplicity of the mean equation the EUR/RON exchange rate return dynamics is quite difficult to forecast. The best specification for the variance equation consists of a FIGARCH (1, d, 0), a long memory processes that accounts for the persistence in volatility. The results of the parameter stability tests entailed the introduction of a dummy variable to account for the moment the Central Bank changed the reference currency.
615
References1.,ă Baillie,ă R.,ă T.ă Bollerslev,ă andă H.ă Mikkelsen,ă 1996,ă ―Fractionallyă Integratedă Generalizedă AutoregressiveăConditionalăHeteroskedasticity,‖ăJournalăofăEconometrics,ă74,ă3–30.
2.ăBollerslev,ăT.,ă1986,ă―Generalizedăautoregressiveăconditionalăheteroskedasticity,‖ăJournalăofă Econometrics, 31, 307–327.
3.ă Bollerslev,ă T.,ă 1987,ă ―Aă Conditionallyă Heteroskedastică Timeă Seriesă Modelă foră Speculativeă PricesăandăRatesăofăReturn,‖ăReviewăofăEconomicsăandăStatistics,ă69,ă542–547.
4. Bollerslev,ă T.,ă andă H..ă Oă Mikkelsen,ă 1996,ă ―Modelingă andă Pricingă Long-Memory in Stock MarketăVolatility,‖ăJournalăofăEconometrics,ă73,ă151–184.
5. Breidt, F. J., N. Crato, and P. de Lima, 1998, |The detection and estimation of long memory in stochastic volatility‖,ăJournalăofăEconometrics,ă83,ă325–348.
6. Chung, C.-F,ă1999,ă―EstimatingătheăfractionallyăintegratedăGARCHămodel,‖ăNationalăTaiwană University working paper.
7.ăDay,ăT.,ăandăC.ăLewis,ă1992,ă―StockăMarketăVolatilityăandătheăInformationăContentăofăStockă IndexăOptions,‖ăJournalăofăEconometrics,ă52,ă267–287.
8.ăDing,ăZ.,ăC.ăW.ăJ.ăGranger,ăandăR.ăF.ăEngle,ă1993,ă―AăLongăMemoryăPropertyăofăStockăMarketă ReturnsăandăaăNewăModel,‖ăJournalăofăEmpiricalăFinance,ă1,ă83–106.
9.ăEngle,ăR.,ă1982,ă―Autoregressiveăconditional heteroscedasticity with estimates of the variance ofăUnitedăKingdomăinflation,‖ăEconometrica,ă50,ă987–1007.
10.ă Engle,ă R.,ă andă T.ă Bollerslev,ă 1986,ă ―Modelingă theă Persistenceă ofă Conditională Variances,‖ă Econometric Reviews, 5, 1–50.
11. Fornari, F., andă A.ă Mele,ă 1996,ă ―Modelingă theă changingă asymmetryă ofă conditională variances,‖ăEconomicsăLetters,ă50,ă197–203.
12.ăGlosten,ăL.,ăR.ăJagannathan,ăandăD.ăRunkle,ă1993,ă―Onătheărelationăbetweenăexpectedăreturnă onăstocks,‖ăJournalăofăFinance,ă48,ă1779–1801.
13. Granger,ăC.,ăandăR.ăJoyeux,ă1980,ă―AnăIntroductionătoăLong-Memory Time Series Models andăFractionalăDifferencing,‖ăJournalăofăTimeăSeriesăAnalysis,ă1,ă15–29.
14.ăHsieh,ăD.,ă1989,ă―ModelingăHeteroskedasticityăinăDailyăForeignăExchangeăRates,‖ăJournalăofă Business and Economic Statistics, 7, 307–317.
15.ă Kaiser,ă T.,ă 1996,ă ―One-Factor-GARCH Models for German Stocks - Estimation and Forecasting,‖ăUniversiteităTubingen,ăWorkingăPaper.
16.ăKon,ăS.J.,ă1984,ă―ModelsăofăStockăReturnsă– AăComparison‖,ăTheăJournalăofăFinance, 39, 147-165.
17.ăLambert,ăP.,ăandăS.ăLaurent,ă2001,ă―ModellingăFinancialăTimeăSeriesăUsingăGARCH-Type ModelsăandăaăSkewedăStudentăDensity,‖ăWorkingăPaper,ăUniversiteădeăLiege.
18.ă Nelson,ă D.,ă 1991,ă ―Conditională heteroskedasticityă ină assetă returns:ă a newă approach,‖ă Econometrica, 59, 349–370.
19.ăPeters,ăJ.,ă2000,ă―DevelopmentăofăaăpackageăinătheăOxăenvironmentăforăGARCHămodelsăandă twoăempiricalăapplications,‖ăMimeo,ăUniversiteădeăLiege.
20.ăRoberts,ăM.C.,ă2001,ă―Commodities,ăOptionsăandăVolatility:ăan AnalyticăApproach‖,ăReviewă of Financial Studies, 4, 727-752.
21.ă Tse,ă Y.,ă 1998,ă ―Theă Conditională Heteroskedasticityă ofă theă Yen-Dollară Exchangeă Rate,‖ă Journal of Applied Econometrics, 193, 49–55.
22.ă Vlaar,ă P.ă andă F.ă Palm,ă 1993,ă ―Theă messageă ină weeklyă exchange rates in the european monetaryăsystem:ămeanăreversion,ăconditionalăheteroskedasticityăandăjumps,‖ăJournalăofăBusinessă and Economic Statistics, 11, 351–360.