www.clim-past.net/11/1347/2015/ doi:10.5194/cp-11-1347-2015
© Author(s) 2015. CC Attribution 3.0 License.
Stability of ENSO and its tropical Pacific teleconnections
over the Last Millennium
S. C. Lewis1and A. N. LeGrande2
1Research School of Earth Sciences, The Australian National University, Canberra, ACT, Australia and
ARC Centre of Excellence for Climate System Science, Australia
2NASA Goddard Institute for Space Studies and Center for Climate Systems Research, Columbia University,
2880 Broadway, New York, NY 10025, USA
Correspondence to:S. C. Lewis ([email protected])
Received: 16 March 2015 – Published in Clim. Past Discuss.: 7 May 2015
Revised: 16 September 2015 – Accepted: 18 September 2015 – Published: 13 October 2015
Abstract.Determining past changes in the amplitude,
fre-quency and teleconnections of the El Niño-Southern Oscil-lation (ENSO) is important for understanding its potential sensitivity to future anthropogenic climate change. Palaeo-reconstructions from proxy records can provide long-term information of ENSO interactions with the background cli-matic state through time. However, it remains unclear how ENSO characteristics have changed on long timescales, and precisely which signals proxies record. Proxy interpretations are typically underpinned by the assumption of stationarity in relationships between local and remote climates, and of-ten utilise archives from single locations located in the Pa-cific Ocean to reconstruct ENSO histories. Here, we investi-gate the long-term characteristics of ENSO and its telecon-nections using the Last Millennium experiment of CMIP5 (Coupled Model Intercomparison Project phase 5; Taylor et al., 2012). We show that the relationship between ENSO conditions (NINO3.4) and local climates across the Pacific basin differs significantly for 100-year epochs defining the Last Millennium and the historical period 1906–2005. Fur-thermore, models demonstrate decadal- to centennial-scale modulation of ENSO behaviour during the Last Millennium. Overall, results suggest that the stability of teleconnections may be regionally dependent and that proxy climate records may reveal complex changes in teleconnected patterns, rather than large-scale changes in base ENSO characteristics. As such, proxy insights into ENSO may require evidence to be considered over large spatial areas in order to deconvolve changes occurring in the NINO3.4 region from those relat-ing to local climatic variables. To obtain robust histories of
the ENSO and its remote impacts, we recommend interpre-tations of proxy records should be considered in conjunction with palaeo-reconstructions from within the central Pacific.
1 Introduction
Niña-like mean state since the 1990s; England et al., 2014) are difficult to evaluate in terms of a forced response or unforced variability given that the limited observational record almost certainly does not capture the full range of internal climate dynamics.
High-resolution palaeo-reconstructions, including from tree rings, sediment cores, corals and speleothems, have the potential to provide long-term information about changes in modes of climatic variability and their sensitivity to differ-ent boundary conditions. Some tropical proxy records reveal ENSO interactions with the background mean climatic state. Data from long-lived fossil corals are often interpreted quan-titatively as estimates of ENSO changes through time that show a range of ENSO frequencies and amplitudes through time. Central Pacific coral reconstructions generally reveal a weakened ENSO during the early Holocene (McGregor et al., 2013) and highly variable ENSO activity throughout the Holocene (Cobb et al., 2013), which may have arisen from internal ocean-atmosphere variability (Cobb et al., 2003). Developing robust estimates of natural ENSO variability over a period longer than permitted through the instrumen-tal record is a useful research avenue, with the potential for informing meaningful adaptive strategies for future climate change.
Palaeo-ENSO proxy records of the Last Millennium (1000 years) are sparsely populated temporally and spa-tially, and reconstructions remain uncertain (Cobb et al., 2003; Khider et al., 2011). It also remains unclear as to pre-cisely which climatic signals associated with ENSO are be-ing recorded in these individual proxy records and whether these provide the necessary resolution to reconstruct ENSO changes. The assumption of stationarity of relationships be-tween local and remote climates (teleconnections) under-pins the interpretation of many palaeoclimate reconstruc-tions. However, stationarity should not necessarily be as-sumed in terms of ENSO variability (Gallant et al., 2013). Are palaeo-reconstructions from the tropical Pacific record-ing base changes in the ENSO system or rather changes in teleconnected patterns? Previous model-based studies have identified sensitivity in the relationship between ENSO and the background climate state, and urged caution in the recon-struction of ENSO from proxy records under the assump-tion of staassump-tionarity of observed teleconnecassump-tions (Coats et al., 2013; Gallant et al., 2013).
However, these studies have not comprehensively ad-dressed the degree to which uncertainty about the non-stationarity of ENSO teleconnections can be assessed for particular locations and for particular mean climatic states. Previous studies have combined proxy record with simu-lations using global climate models (GCMs; Cobb et al., 2013). However, these approaches primarily focused on us-ing palaeo-ENSO reconstructions to test the performance of GCMs for the purpose of constraining uncertainty in fu-ture projections of ENSO behaviour under climate change. Furthermore, although we previously investigated the
poten-tial non-stationarity of hydrologic responses to ENSO-like conditions under disparate boundary conditions in idealised model simulations (Lewis et al., 2014), we did not provide guidance for interpreting tropical proxy records in particular regions.
As such, precisely which expressions of ENSO are being recorded in proxy archives under differing climatic bound-ary conditions have not been comprehensively interrogated. A new generation of climate models and experiments has re-cently become available (Taylor et al., 2012), providing an opportunity for the first time to investigate ∼1200 years of ENSO variability and establish a framework for under-standing ENSO changes through time, using more models than previously possible. Hence in this current study, we in-vestigate changes in ENSO characteristics (frequency and amplitude) in model experiments of the Last Millennium (“past1000”). Focusing on three key climatic regions (East, Central and West Pacific), where explicit palaeo-ENSO re-constructions have been made, teleconnected patterns (the relationship between local and remote climates) throughout the Last Millennium are examined for surface temperatures and precipitation. We ultimately aim to determine whether proxy archives in the tropical Pacific are likely to be record-ing alterations in ENSO base frequencies or local-scale tele-connections under differing boundary conditions.
2 Data sets and methods
2.1 Definitions
The study is primarily focused on palaeo-ENSO variability from the tropical Pacific. Model data were investigated in three regions that have been identified as sensitive to mod-ern ENSO variability and have also been used explicitly to reconstruct past ENSO changes (e.g. Cobb et al., 2013; Mc-Gregor et al., 2013). Area-mean anomalies for precipitation and surface temperature were calculated for the West (10◦S– 10◦N, 105–155◦E), Central (10◦S–10◦N, 170–130◦W) and East Pacific (20◦S–5◦N, 65–90◦W) region and surface tem-perature for the NINO3.4 region (5◦N–5◦S, 170◦–120◦W; Fig. 1). These regions are not intended to provide exhaustive coverage of ENSO impacts, but are large enough to provide useful comparisons with model-based data.
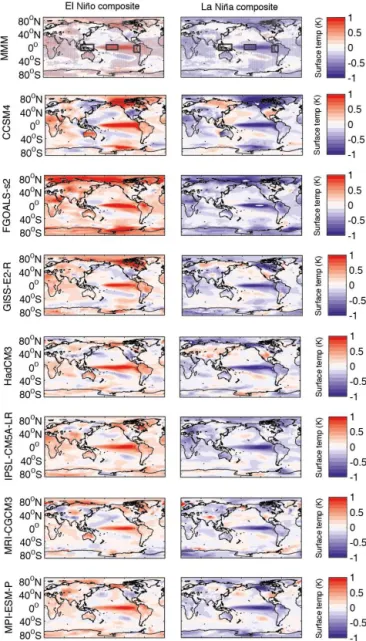
Figure 1.Composited anomaly maps for surface temperature (K) for CMIP5 models (left, El Niño episodes; right, La Niña episodes) for historical experiment, showing multi-model mean (MMM) and each model. Rectangular boxes indicate the West, Central and East Pacific regions. Stippling indicates where more than 80 % of the models agree on the sign of the ENSO-associated anomaly.
is commonly used to categorise ENSO episodes, it should be noted that there are other indices of ENSO that may also provide useful information beyond the central tropical Pacific conditions described by the NINO3.4 (see Figs. S1–3 in the Supplement).
2.2 Model experiments
CMIP5 simulations (Taylor et al., 2012) were used for the historical (1850–2005 CE) experiment, which is forced us-ing changus-ing atmospheric compositions due to observed
anthropogenic and volcanic influences, solar forcings and emissions of short-lived species from natural and anthro-pogenic aerosols. In addition, simulations were used of the Last Millennium (past1000; 850–1849 CE), in which recon-structed time-evolving exogenous forcings are imposed, in-cluding changes in volcanic aerosols, well-mixed greenhouse gases, land use, orbital parameters and solar changes. Each model’s pre-industrial control simulation (piControl) with non-evolving pre-industrial forcings was analysed.
Data (precipitation, pr, and surface temperature, ts) for six remaining models were regridded onto a common 1.5◦ lati-tude by 1.5◦longitude grid. For the piControl and past1000 experiments, monthly anomalies were calculated by subtract-ing the mean seasonal cycle for each model. For the histor-ical experiment the 100-year period of 1906–2005 is con-sidered. Additional experiments were analysed for CMIP5-participating models, where available. For GISS-E2-R and IPSL-CM5A-LR models, extended control simulations of > 500 years in duration were analysed and compared to forced, past1000 experiments.
2.3 Models and evaluation
The basic properties of El Niño-Southern Oscillation (ENSO) simulated in Coupled Model Intercomparison Project phase 5 (CMIP5) models (Taylor et al., 2012), rel-ative to observations, have been comprehensively evaluated in previous studies (e.g., Bellenger et al., 2013; Guilyardi et al., 2012). For example, Bellenger et al. (2013) examined ENSO through six metrics – (1) ENSO amplitude (Niño3 sea surface temperature (SST) standard deviation), (2) struc-ture (Niño3 vs. Niño4 amplitude), (3) frequency (root mean square error of Niño3 SST anomaly spectra), (4) heating source (Niño4 precipitation standard deviation), (5) the am-plitude of the ENSO biennial component (the ratio of the Niño3 SST anomaly time series power in the 3–8 and 1– 3 years bands) and (6) seasonality of ENSO (ratio between winter November-January over spring March– May average Niño3 SST anomalies standard deviations. The Bellenger et al. (2013) study showed a significant improvement in model skill compared with CMIP3 generation models, including improved sea surface temperature anomaly location, seasonal phase locking and ENSO amplitude.
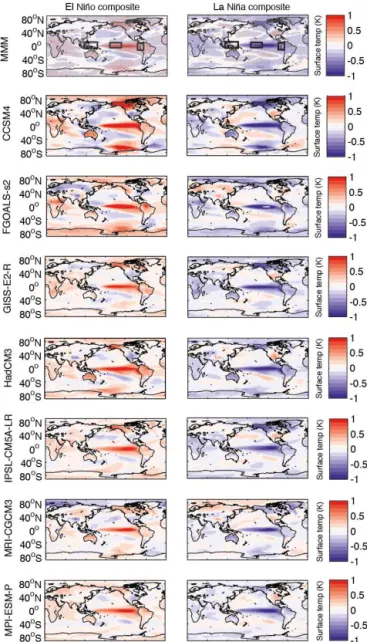
Figure 2.As for Fig. 1, but showing composites from Last Millen-nium experiment.
Models were compared to twentieth century reanalysis data (20CR; Compo and Whitaker, 2011), which are widely used as a proxy of observed climate (King et al., 2014; Klingaman and Woolnough, 2013). In order to focus on ENSO characteristics, we compare these data sets for the period of 1976-2005, rather than an extended historical pe-riod, due to greenhouse-forced non-stationarities over the post-industrial era. It should be noted that ENSO properties have changed over the last several decades, in particular with increased frequency of Central Pacific-centred events in re-cent decades, which have substantially different characteris-tics (Pascolini-Campbell et al., 2014). Hence model skill in recent decades does not ensure that all “flavours” of ENSO are equally well captured. CMIP5 historical simulations were compared to reanalysis precipitation and surface temperature
over the 1976–2005 period for several ENSO-related charac-teristics.
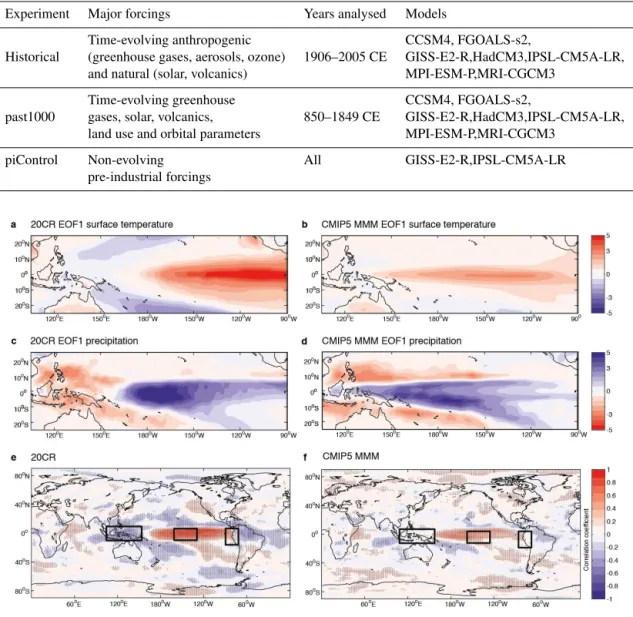
To investigate the model representation of ENSO spatial patterns, the first empirical orthogonal function of the tropi-cal Pacific surface temperature anomalies was tropi-calculated for 20CR reanalysis and CMIP5 multi-model mean (MMM) em-pirical orthogonal function (EOF) (Fig. 3a and b). Precipita-tion anomalies were also analysed (Fig. 3c and d). Surface temperature and precipitation patterns are qualitatively simi-lar for reanalysis and models; temperature patterns are gener-ally of the same sign, although the meridional width of trop-ical temperature anomalies is narrower than in the reanalysis estimates, and simulated precipitation patterns are similar to the reanalysis estimate in the central Pacific, although pos-itive anomalies are located too far westward in the CMIP5 MMM, compared with observations. In addition, the rela-tionship between NINO3.4 surface temperature anomalies and global precipitation fields in reanalysis was compared to the CMIP5 MMM (Fig. 3e and f). The correlation coef-ficients between NINO3.4 temperature anomalies and local precipitation are generally of the same sign in simulated and reanalysis fields, including positive correlations in the Cen-tral and East Pacific and negative correlations in the west Pacific. These reanalysis-model comparisons are broadly in-sightful about the model representations of ENSO.
3 Diagnosing ENSO changes and teleconnections
The location of ENSO activity in the historical and Last Mil-lennium experiments was first explored using the leading (EOF) of the tropical Pacific surface temperature (Fig. S5). Spatial patterns were compared to the NINO3.4 index to de-termine possible non-stationarities in the site of ENSO ac-tivity through time (Li et al., 2011). In both experiments, the surface temperature patterns are loaded in the NINO3.4 region, indicating that areal-average NINO3.4 temperatures provide a useful metric of ENSO activity in both experi-ments. It should be noted that EOF analysis does not neces-sarily reveal modes that can be readily interpreted physically. However, in this study we utilise an identical set of mod-els for each experiment, and hence possible biases in ENSO representations in the models are not considered prohibitive to investigating changes in the stability of teleconnections through time. A wavelet analysis was next used to exam-ine the frequency and amplitude of NINO3.4 surface tem-perature variability in each model for statistically significant changes. Wavelet analysis shows that the frequency and am-plitude of NINO3.4 exhibit statistically significant changes. The spectral power was calculated for the historical simula-tion (years 1906–2005) and compared to the range of spectral power displayed in the past1000 experiment, calculated us-ing ten 100-year epochs (Fig. 4).
Cen-Table 1.Details of CMIP5 experiments and models analysed. Further details can be found through the Program for Climate Model Diagnosis and Intercomparison (PCMDI).
Experiment Major forcings Years analysed Models
Time-evolving anthropogenic CCSM4, FGOALS-s2,
Historical (greenhouse gases, aerosols, ozone) 1906–2005 CE GISS-E2-R,HadCM3,IPSL-CM5A-LR, and natural (solar, volcanics) MPI-ESM-P,MRI-CGCM3
Time-evolving greenhouse CCSM4, FGOALS-s2,
past1000 gases, solar, volcanics, 850–1849 CE GISS-E2-R,HadCM3,IPSL-CM5A-LR, land use and orbital parameters MPI-ESM-P,MRI-CGCM3
piControl Non-evolving All GISS-E2-R,IPSL-CM5A-LR
pre-industrial forcings
Figure 3.Comparison of leading patterns (standardised, first EOFs) of monthly variability in surface temperature and precipitation for 20CR reanalysis (left:a, surface temperature;b, precipitation), CMIP5 models (b, surface temperature;d, precipitation). CMIP5 historical patterns are the multi-model mean (MMM) of the first EOF of each individual model for model years 1976-2005. Spatial correlation coefficients between NINO3.4 index and 20CR precipitation(e)and the CMIP5 MMM(f). Stippling indicates Spearman’s rank correlations significant at the 95 % level. Rectangular boxes indicate the East, Central and West Pacific regions. Only model years 1976–2005 are used for comparison as the historical experiment necessarily produces a non-stationary climate due to the time-evolving anthropogenic greenhouse gas forcings imposed.
tral and West) was diagnosed through several complemen-tary approaches. First, an ordinary least squares regression between monthly NINO3.4 mean surface temperature and re-mote area-mean surface temperature, and between monthly NINO3.4 mean surface temperature and remote area-mean precipitation was compared for the historical and Last Mil-lennium experiments, for each region. Second, the rela-tionship between local and NINO3.4 climates was consid-ered using the correlation between variables (Corr(local, remote)), analogous to considering land-surface coupling
strength (Lorenz et al., 2012). Correlations coefficients were calculated for monthly time series in ten 100-year epochs comprising the Last Millennium. Values were determined at each model gridbox and an area-weighted mean calculated for each region. The significance of correlations was assessed at the 95 % confidence level for each coefficient using attest. Third, the significance of identified changes in local-remote relationships during the Last Millennium was investigated.
0 2 4 6 8 0
50 100
CCSM4
0 2 4 6 8
0 50 100 150
FGOALS-s2
0 2 4 6 8
0 20 40 60
GISS-E2-R
0 2 4 6 8
0 20 40
HadCM3
0 2 4 6 8
0 20 40 60
IPSL-CM5A-LR
Period (years)
0 2 4 6 8
0 50 100
MPI-ESM-P
Period (years)
0 2 4 6 8
0 10 20
MRI-CGCM3
past1000
historical
past1000
historical
past1000
historical
past1000
historical
past1000
historical
past1000
historical
past1000
historical
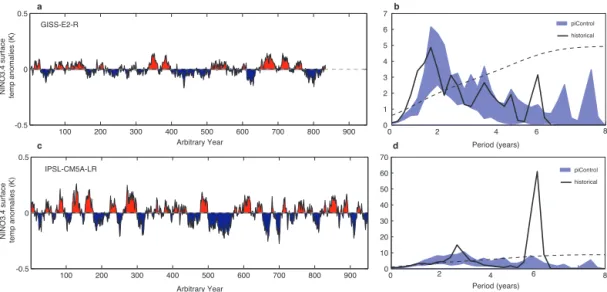
Figure 4. Global mean NINO3.4 power spectrum (K2/unit frequency, black) of Last Millennium simulations, relative to the red-noise (AR(1)) benchmark (dashed), for the multi-model mean (MMM) and each model analysed. The historical simulation is shown in black and the 5th–95th percentile range across the Last Millennium shown by purple envelope, calculated using 100-year epochs. Spectral power was calculated using a Morlet wavelet of degree 6.
precipitation anomalies were selected for each region. A two-sided Kolmogorov-Smirnov (KS) test was used to investi-gate whether the distribution of local climate variables in 100-year epochs within the Last Millennium could statisti-cally have been drawn from the same population (at the 5 % significance level). A two-sided KS test was applied to each ENSO phase for each variable (surface temperature, precipi-tation) in each region (East, Central, West) comparing every permutation of epochs sequentially (e.g. comparing El Niño-associated Central Pacific temperatures during 850–949 with 950–1049, then 1050–1149, then 1150–1249 etc.). A KS test was used for detecting changes in ENSO-remote climate re-lationships in the Last Millennium time series as it is non-parametric and requires no assumptions to be made regarding the distribution of the data. A change is detected where the null hypothesis (that the distributions considered were drawn from the same population) is rejected at the 5 % significance level.
4 ENSO during the Last Millennium
4.1 ENSO characteristics
Models demonstrate a range of variance in the ENSO-relevant band (2–8 years) for the historical experiment (Fig. 4). In the historical experiment, ENSO amplitude is
generally weaker at relevant periods for the MRI-CGMC3, GISS-E2-R and HadCM3 models. Notably, the amplitude of higher ENSO-relevant periods (6–8 years) in the historical simulations is generally outside the range exhibited in the Last Millennium for each model (Fig. 2). However, previous model-based studies (Coats et al., 2013; Wittenberg, 2009) that reveal strong inter-decadal to inter-centennial modula-tion of ENSO behaviour warn that such modulamodula-tion may not be fully revealed by the comparatively short instrumental cli-mate record available. Hence, large uncertainties may exist in ENSO metrics diagnosed from short records.
qual--0.5 0 0.5
Year
-0.5 0 0.5
Year
-0.5 0 0.5
Year
-0.5 0 0.5
Year
-0.5 0 0.5
Year
-0.5 0 0.5
Year
900 1000 1100 1200 1300 1400 1500 1600 1700 1800
-0.5 0 0.5
Year CCSM4
GISS-E2-R FGOALS-s2
NINO3.4 surface temp anomalies (K)
HadCM3
IPSL-CM5A-LR
MRI-CGCM3 MPI-ESM-P
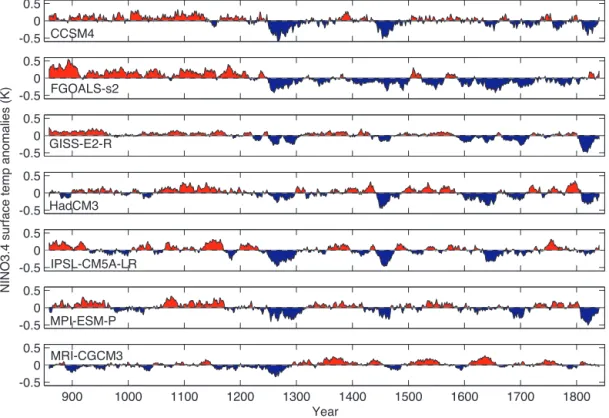
Figure 5.Running annual-mean surface temperature anomalies (K) over the NINO3.4 region (5◦N–5◦S, 170–120◦W) for Last Millennium simulation for each model. Red/blue shading highlights departures from each model’s long-term mean. Running means were calculated using a 240-month triangle smoother.
itatively similar variability to that shown in the externally forced Last Millennium experiment (Fig. 5). This similarity includes multi-decadal to centennial-scale El Niño- and La Niña-like phases.
4.2 ENSO impacts and teleconnections
Models show broadly similar global impacts associated with NINO3.4 regional temperature anomalies in the Last Millen-nium and historical experiments (Figs. 1 and 2). The com-posited patterns of global surface air temperature anomalies associated with positive (El Niño) and negative (La Niña) ENSO phases derived from all analysed models spatially co-herent across the experiments. However, both El Niño and La Niña anomalies associated with the historical period (1906– 2005) are generally of greater magnitude than for the Last Millennium, for the MMM and in various models includ-ing FGOALS-s2 and CCSM4. These experiments are most similar in the tropical Pacific, with larger differences evident at remote locations outside the equatorial Pacific, including over North America and the south Pacific.
For each Pacific region (East, Central, West) we exam-ine the relationship between NINO3.4 regional temperature anomalies and local temperature and precipitation using the correlation between variables(Corr(Local, Remote)). This approach is analogous to considering land-surface coupling
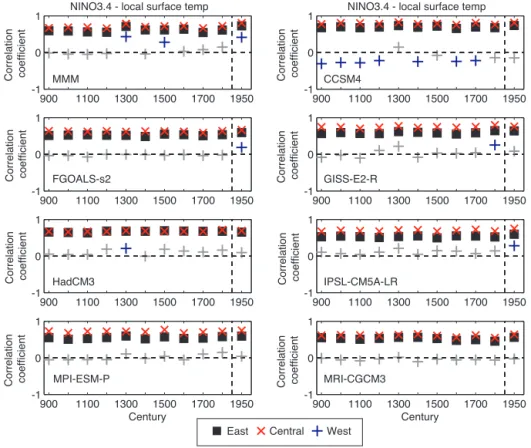
strength (Lorenz et al., 2012). We diagnose temporal stabil-ity using this correlation in ten 100-year epochs that com-prise the Last Millennium and the 100-year historical period of 1906–2005 (Figs. 7 and 8). The strength of the remote-local relationship varies temporally and is also both region-ally and climate variable dependent. In the West Pacific, par-ticularly, this coupling is generally weak and not found to be statistically significant for most epochs and models. It is notable that the strongest West Pacific-NINO3.4 correlation for the MMM, and FGOALS-s2 and IPSL-CM5A-LR mod-els is calculated for the historical experiment. There is, how-ever, a large dispersion in correlations calculated across the models, with negative correlations calculated from CCSM4, which also shows the strongest El Niño-related cool features in the warm pool region (Figs. 1 and 2). The remote-local temperature relationship is consistently stronger in the East and Central Pacific regions. The strongest local precipitation coupling occurs for the Central Pacific, with no statistically significant relationships found for the West and East Pacific across the model ensemble (with the exception of CCSM4; Fig. 8).
100 200 300 400 500 600 700 800 900 -0.5
0 0.5
Arbitrary Year
100 200 300 400 500 600 700 800 900 -0.5
0 0.5
GISS-E2-R
NINO3.4 surface temp anomalies (K)
NINO3.4 surface temp anomalies (K)
0 2 4 6 8
0 10 20 30 40 50 60 70
Period (years) IPSL-CM5A-LR
0 2 4 6 8
0 1 2 3 4 5 6 7
Period (years)
Arbitrary Year
piControl historical
piControl historical
a
d c
b
Figure 6.Running annual-mean surface temperature anomalies (K) over the NINO3.4 region (5◦N–5◦S, 170–120◦W) for extended piCon-trol simulations conducted with GISS-E2-R(a)and IPSL-CM5A-LR(c)models. Red/blue shading highlights departures from each model’s long-term mean. Running means were calculated using a 240-month triangle smoother. Control simulations are spun up to quasi-equilibrium and run for ideally > 500 years, providing an arbitrary time series of model internal variability. Global mean NINO3.4 power spectrum (K2/unit frequency, black), relative to the red-noise (AR(1)) benchmark (dashed) for GISS-E2-R(b)and IPSL-CM5A-LR(d)models.
El Niño- and La Niña-associated temperatures, for exam-ple, significantly vary in character through the Last Millen-nium and with the historical 100-year epoch for the multi-model mean. Temporal changes in local ENSO fingerprints (Corr(Local, Remote)) of the Last Millennium, also likely re-sult from external forcings and/or internal ocean-atmosphere dynamics, which are discussed further in Sect. 6. However, these same relationships were not explored in the extended control simulations because of the small number of contribu-tions available from different models. Differing teleconnec-tions may result at different points in time and may also differ from present-day relationships. In addition, Last Millennium variability in ENSO-local climate relationships across sites in the tropical Pacific suggests that global ENSO changes do not necessarily scale linearly to local scales and cannot be assumed to do so.
5 ENSO under differing boundary conditions
The CMIP5 archive also provides simulations of the mid-Holocene (mid-mid-Holocene, circa 6000 years ago) from multi-ple participating climate models, which are also investigated here. The mid-Holocene provides a well-constrained target for model-based studies (Schmidt et al., 2004) with substan-tially larger time-evolving forcings than those imposed dur-ing the Last Millennium, and this period has also been the target of palaeo-reconstructions. Mid-Holocene simulations are run for at least 100 years after reaching equilibrium and have changed orbital parameters and atmospheric concen-trations of greenhouse gases imposed. Other boundary con-ditions such as aerosols, solar constant, vegetation and
to-pography are prescribed as the same as in the pre-industrial control simulation. We note that although the limited 100 model years contributed by various models may not provide an exhaustive representation of ENSO behaviour in the mid-Holocene, they nonetheless provide valuable insight into the potential influences of varying boundary conditions.
900 1100 1300 1500 1700 1950 -1
0 1
900 1100 1300 1500 1700 1950 -1
0 1
900 1100 1300 1500 1700 1950 -1
0 1
900 1100 1300 1500 1700 1950 -1
0 1
900 1100 1300 1500 1700 1950 -1
0 1
900 1100 1300 1500 1700 1950 -1
0 1
900 1100 1300 1500 1700 1950 -1
0 1
Century
900 1100 1300 1500 1700 1950 -1
0 1
Century
Correlation coefficient
Correlation coefficient
Correlation coefficient
Correlation coefficient
Correlation coefficient
Correlation coefficient
Correlation coefficient
Correlation coefficient
CCSM4
GISS-E2-R FGOALS-s2
HadCM3 IPSL-CM5A-LR
MRI-CGCM3 MPI-ESM-P
MMM
NINO3.4 - local surface temp NINO3.4 - local surface temp
East Central West
Figure 7.Area-mean correlation coefficients (R) of NINO3.4 and local surface air temperature for the East (black square), Central (red cross) and West (blue cross) calculated for the MMM, and for each model. Data points show correlation coefficients calculated for ten 100-year epochs comprising the Last Millennium simulation and for the historical simulation (1906–2005). Plot markers in grey indicate correlations that are not statistically significant (at the 5 % significance level).
We consider the subset of participating CMIP5 mod-els with contributions of mid-Holocene simulations (MRI-CGCM3, IPSL-CM5A-LR, FGOALS-s2, CCSM4) and find a general reduction in spectral power across ENSO-relevant frequencies that has also been reported in model experiments of this period conducted prior to the release of CMIP5 (Chi-ang et al., 2009). This reduced spectral power in the ENSO band can be considered a metric for reduced ENSO am-plitude (Stevenson, 2012). Previous model and proxy-based studies have also hinted at subdued ENSO activity in the mid-Holocene. For example, early studies using simple nu-merical models of the coupled ocean-atmosphere system by Clement et al. (2000) demonstrate increasing ENSO variabil-ity throughout the Holocene in response to time varying or-bital forcings. The impact of mid-Holocene oror-bital changes on ENSO variability has not been demonstrated comprehen-sively from proxy records. However, various fossil coral re-constructions indicate that there may have been reductions in ENSO variability in the mid-Holocene (Cobb et al., 2013).
In addition, when CMIP5 mid-Holocene model data are composited into positive (El Niño) and negative (La Niña) phases, the magnitude of simulated mid-Holocene spatial patterns of ENSO impacts (Fig. S7) are subdued, relative to the historical. The relationship between NINO3.4 mean
sur-face temperature anomalies and regional (East, Central, West Pacific) temperature and precipitation was also examined and shows particularly that the relationship between West Pacific surface temperature anomalies and corresponding NINO3.4 temperature anomalies differs from the mid-Holocene and historical simulations. The frequency of high and low lo-cal surface temperature anomalies in the West Pacific during El Niño defined conditions is reduced in the mid-Holocene experiment compared with the historical. The NINO3.4 im-pacts on East and Central Pacific regional temperatures are broadly similar for the historical and mid-Holocene.
6 Towards reconstructing robust ENSO histories
900 1100 1300 1500 1700 1950 -1
0 1
900 1100 1300 1500 1700 1950 -1
0 1
900 1100 1300 1500 1700 1950 -1
0 1
900 1100 1300 1500 1700 1950 -1
0 1
900 1100 1300 1500 1700 1950 -1
0 1
900 1100 1300 1500 1700 1950 -1
0 1
900 1100 1300 1500 1700 1950 -1
0 1
Century
900 1100 1300 1500 1700 1950 -1
0 1
Century Correlation coefficient
East Central West Correlation coefficient
Correlation coefficient
Correlation coefficient
Correlation coefficient
Correlation coefficient
Correlation coefficient
Correlation coefficient
NINO3.4 - local precip NINO3.4 - local precip
CCSM4
GISS-E2-R FGOALS-s2
HadCM3 IPSL-CM5A-LR
MRI-CGCM3 MPI-ESM-P
MMM
Figure 8.As for Fig. 7 but showing correlation coefficients (R) of NINO3.4 and local precipitation.
remote-local temperature relationships consistently stronger in the East and Central Pacific regions. The relationships be-tween NINO3.4 and local precipitation are weak and found to be significant only in the Central Pacific. Furthermore, in the West Pacific particularly, El Niño- and La Niña-associated temperatures vary significantly in character throughout the Last Millennium and with the historical 100-year epoch.
Previous studies of ENSO variability over the period en-compassed in the CMIP5 past1000 simulations suggest that the most robust ENSO influence occurs over the Maritime Continent, in the western part of the Pacific basin, with teleconnections generally stronger when ENSO variance is higher (Li et al., 2013). Conversely, in our present study the correlation between West Pacific climates and NINO3.4 is lower than for the Central and East Pacific, and also most variable between epochs. This apparent mismatch has sev-eral possible causes. First, Li et al. (2013) focused on tree ring records, and the Maritime Continent region they de-scribe lies to the west of the West Pacific region we define to encompass published coral records. This is likely an im-portant difference in definition, due to the subtle shifts in the western extent of the warm tongue characterising positive (El Niño) episodes, and conversely to the cool anomalies charac-tering La Niña episodes. Furthermore, simulated climates of the Warm Pool region are likely highly sensitive to model bias (Brown et al., 2012, 2013) and hence model dispersion
is expected (e.g., CCSM4 model in Fig. 7). Hence, subtle changes in the Pacific basin may impact this region through several ocean-atmosphere mechanisms.
Although our current results appear to contradict those previously reported on ENSO teleconnections (e.g., Li et al., 2013), collectively these studies suggest that remote recon-structions of ENSO require a regional perspective. It may be inherently difficult to deconvolve variability in the NINO3.4 region and local-scale, teleconnected climatic change in re-mote regions. Palaeoclimate studies often utilise archives from single locations located in the Pacific Ocean to re-construct generalised basin-scale histories of ENSO. How-ever, multiple studies demonstrate that proxies in one loca-tion alone should not be considered regionally representative, or singularly insightful about robust ENSO reconstructions without explicit examination of the stability of ENSO tele-connections. We argue that proxy insights into change and variability in ENSO system are likely to be most robust when evidence is being synthesised over large spatial areas. That is, considering changes only at a singular location does not provide complete information about temporal changes in a large-scale system like ENSO.
likely to reveal the potentially subtle changes in ENSO-associated spatial patterns of temperature and precipitation perturbations across the Pacific. For remote regions outside the equatorial Pacific, the non-stationarity of ENSO telecon-nections is likely to be more problematic. These sites should be considered in conjunction with palaeo-reconstructions from within the central Pacific basin, the so-called “centre of action” of ENSO (Cobb et al., 2013). This provides a frame-work for enhanced interpretations of the invaluable informa-tion of palaeoclimatic change provided by proxy records. Under boundary conditions significantly different from the present, such as the mid-Holocene ENSO teleconnections are likely to be more variable, and hence potential non-stationarities in local-remote relationships require explicit consideration in proxy interpretations. Spatially integrated approaches have already been undertaken and provide valu-able information over the recent past (e.g. Li et al., 2013), and several multi-proxy reconstructions of ENSO are now available (e.g., Braganza et al., 2009; Wilson et al., 2010; Emile-Geay et al., 2013a, b). These provide highly valuable records of aspects of the ENSO system but are often limited in terms of temporal coverage to the past few centuries, or derived from extratropical record and hence not directly rep-resentative of ENSO variability.
In this study, we investigated teleconnected changes using NINO3.4 to represent ENSO, which was based on the deter-mined similarity of the leading EOF of the multi-model mean in the historical and Last Millennium simulations. However, important spatial changes in ENSO patterns are known to occur and have been identified over the observational pe-riod (McPhaden et al., 2011), with impacts of teleconnected patterns (Graf and Zanchettin, 2012). Furthermore, during periods of varying boundary conditions, such as the mid-Holocene it is likely that while ENSO remained active, there was an important change in the spatial pattern of the sea sur-face temperature anomalies (Karamperidou and Di Nezio, 2015). This change in the spatial structure of ENSO was not explicitly explored here, though explicit analysis of NINO3 and NINO4 (see Fig. S1) may be insightful about changes in the ENSO system and its teleconnections through time. In addition, various studies have linked remote proxy variability to the tropical Pacific (e.g., Li et al., 2013) and hence it would be useful in the future to investigate regions remote from the Pacific basin, such as in North America or China. Regardless of the spatial dynamics of surface temperature anomalies in the NINO3.4 region, we do not expect that the recommen-dation of considering proxy information from multiple lo-cations is dependent on the NINO3.4 metric used to define ENSO utilised here.
We have also identified decadal- to centennial-scale mod-ulation of ENSO behaviour, which has been highlighted pre-viously (e.g., Karnauskas et al., 2012; Borlace et al., 2013). As such, a range of ENSO variability may exist during the Last Millennium that is not fully revealed by the compar-atively short instrumental climate record. The existence of
varying ENSO characteristics throughout the Last Millen-nium is also supported by proxy-based climate reconstruc-tions (Cobb et al., 2003), which show variable ENSO char-acteristics include changing frequency and amplitude com-pared to the modern during the Last Millennium. In ENSO-sensitive regions, temporally limited proxy-based ENSO re-constructions, such as from corals, may provide only a snap-shot of ENSO history that cannot be extrapolated through time. The decadal- to centennial-scale modulations of ENSO may plausibly result from either internal variability or ex-ternal forcings, such as volcanic eruptions, or both. We find multi-decadal to centennial-scale El Niño- and La Niña-like phases in CMIP5 piControl simulations (with no im-posed external forcings). These are qualitatively similar to those shown in the externally forced Last Millennium exper-iment, suggesting that multi-decadal ENSO modulation can be stochastic. While Li et al. (2013), for example, agree that substantial stochastic ENSO modulation on these timescales can occur, model-based studies indicate that CMIP5 simu-lations of the Last Millennium demonstrate a more ener-getic and variable ENSO system on centennial timescales than in control runs (Ault et al., 2013). In Ault et al.’s study, control simulations did not agree with a suite of recent re-constructions while forced simulations are compatible, while Last Millennium simulations demonstrate ENSO variability closer to reconstructions. Overall, Ault et al. (2013) suggest that ENSO variability in models results from a thermody-namic response to reconstructed solar and volcanic activity.
ENSO response to large volcanic eruptions and suggests that short proxy records spanning periods of significant volcanic activity may be recording temporally specific influences.
Overall we suggest that (1) changes in ENSO do not nec-essarily scale linearly to local scale impacts, (2) that there is likely a sensitivity of ENSO to the background climate state and (3) the decadal- to centennial-scale modulation of ENSO behaviour may arise from internal variability and/or exter-nal forcings such as volcanic eruptions. However, we consid-ered only a subset of CMIP5 models that contributed palaeo-simulations and these contain systematic biases in ENSO representations (Power et al., 2013). If simulated ENSO and its teleconnected patterns are physically unrealistic, models provide limited insights to understanding proxy records in these regions. In their study focused on understanding ENSO responses to volcanic forcings, Emile-Geay et al. (2008) sug-gested further forcing/response insights could be provided by GCMs with realistic ENSO cycles and asked whether the cur-rent generation of models were up to the task. Deficiencies in our theoretical knowledge of ENSO and the difficulties in representing physically realistic ENSO cycles in GCMs (Guilyardi et al., 2012) are a limit on providing robust quan-titative understanding of forced and unforced changes in the ENSO system. Nonetheless, existing model simulations are useful for examining palaeoclimates, despite their biases and reveal spatially and temporally complex changes in ENSO and its teleconnected patterns under differing boundary con-ditions that should be considered when developing robust proxy interpretations and ENSO histories in order that these are most useful for constraining future ENSO behaviour un-der greenhouse forcings.
The palaeo-modelling type approaches utilised here do not attempt to replace proxy reconstructions, but rather demon-strate that combining multiple approaches can provide en-hanced interpretations of reconstruction of past climate guid-ing our understandguid-ing of the most consistent physical expla-nations for change (Schmidt, 2010). This study highlights several avenues for further model-based research on ENSO variability and teleconnections:
– Several models have known difficulties simulating as-pects of ENSO, such as the nonlinear response of rain-fall to extreme El Niño episodes (e.g., Cai et al., 2014). Additional targeted experiments within a single climate model would provide further insight into the apparent complexity of ENSO impacts through time.
– Our present study did not comprehensively investigate the relative influences on various external forcings (so-lar and volcanics) and internal variability on ENSO characteristic, which would provide useful information for comparison with proxy records. These mechanisms could be investigated, for example, using a suite of sim-ulations with single or varying forcings, which may pro-vide valuable general insight into ENSO response to
ex-ternal forcings, including increased anthropogenic ra-diative forcings.
– More direct comparisons between model output and proxy reconstructions can be provided by employ-ing pseudo-proxy techniques. Usemploy-ing this approach, a simulated time series intended to mimic actual proxy records (“pseudo-proxy”) is generated from a climate model simulation (Anchukaitis and Tierney, 2012). The pseudo-proxy approach can be used to interrogate the necessary proxy density required for producing skilful regional climate field reconstructions and provide guid-ance on interpretations of reconstructions from particu-lar locations (Smerdon, 2011; Wahl et al., 2014).
The Supplement related to this article is available online at doi:10.5194/cp-11-1347-2015-supplement.
Acknowledgements. This research was supported by Australian
Research Council Centre of Excellence for Climate System Science (grant CE110001028). We thank NASA GISS for institutional support; resources supporting this work were provided by the NASA High-End Computing (HEC) Program through the NASA Center for Climate Simulation (NCCS) at Goddard Space Flight Center. We thank NOAA for the C2D2 grant NA10OAR4310126 that supported the GISS-E2 last millennium simulations and thank all the groups that contributed to the CMIP archive. We acknowledge the WCRP’s Working Group on Coupled Modelling, which is responsible for CMIP. The U.S. Department of Energy’s PCMDI provides CMIP5 coordinating support.
Edited by: H. Goosse
References
Anchukaitis, K. J. and Tierney, J. E.: Identifying coherent spa-tiotemporal modes in time-uncertain proxy paleoclimate records, Clim. Dynam., 41, 1291–1306, doi:10.1007/s00382-012-1483-0, 2012.
Ault, T. R., Deser, C., Newman, M. and Emile-Geay, J.: Charac-terizing decadal to centennial variability in the equatorial Pacific during the last millennium, Geophys. Res. Lett., 40, 3450–3456, doi:10.1002/grl.50647, 2013.
Bellenger, H., Guilyardi, E. , Leloup, J., Lengaigne, M. and Vialard, J.: ENSO representation in climate models: from CMIP3 to CMIP5, Clim. Dynam., 42, 1999–2018, doi:10.1007/s00382-013-1783-z, 2013.
Borlace, S., Cai, W., and Santoso, A.: Multidecadal ENSO Ampli-tude Variability in a 1000-yr Simulation of a Coupled Global mate Model: Implications for Observed ENSO Variability, J. Cli-mate, 26, 9399–9407, doi:10.1175/JCLI-D-13-00281.1, 2013. Braganza, K., Gergis, J. L., Power, S. B., Risbey, J. S., and Fowler,
Brown, J. N., Sen Gupta, A., Brown, J. R., Muir, L. C., Risbey, J. S., Whetton, P., Zhang, X., Ganachaud, A., Murphy, B., and Wijf-fels, S. E.: Implications of CMIP3 model biases and uncertainties for climate projections in the western tropical Pacific, Climatic Change, 119, 147–161, doi:10.1007/s10584-012-0603-5, 2012. Brown, J. N., Langlais, C., and Maes, C.: Zonal structure and
variability of the Western Pacific dynamic warm pool edge in CMIP5, Clim. Dynam., 42, 3061–3076, doi:10.1007/s00382-013-1931-5, 2013.
Cai, W., Borlace, S., Lengaigne, M., and Van Rensch, P.: Increasing frequency of extreme El Niño events due to greenhouse warming, Nature Climate, doi:10.1038/nclimate2100, 2014.
Carre, M., Sachs, J. P., Purca, S., Schauer, A. J., Braconnot, P., Fal-con, R. A., Julien, M., and Lavallee, D.: Holocene history of ENSO variance and asymmetry in the eastern tropical Pacific, Science, 345, 1045–1048, doi:10.1126/science.1252220, 2014. Chiang, J. C. H., Fang, Y., and Chang, P.: Pacific Climate Change
and ENSO Activity in the Mid-Holocene, J. Climate, 22, 923– 939, doi:10.1175/2008JCLI2644.1, 2009.
Clement, A. C., Seager, R., and Cane, M. A.: Suppression of El Niño during the Mid-Holocene by changes in the Earth’s orbit, Paleoceanography, 15, 731–737, 2000.
Coats, S., Smerdon, J. E., and Cook, B. I.: Stationarity of the trop-ical pacific teleconnection to North America in CMIP5/PMIP3 model simulations, Geophys. Res. Lett., 40, 4927–4932, doi:10.1002/grl.50938, 2013.
Cobb, K. M., Charles, C. D., Cheng, H., and Edwards, R. L.: El Niño/Southern Oscillation and tropical Pacific cli-mate during the last millennium, Nature, 424, 271–276, doi:10.1038/nature01779, 2003.
Cobb, K. M., Westphal, N., Sayani, H. R., Watson, J. T., Di Lorenzo, E., Cheng, H., Edwards, R. L., and Charles, C. D.: Highly Vari-able El Nino-Southern Oscillation Throughout the Holocene, Science, 339, 67–70, doi:10.1126/science.1228246, 2013. Collins, M., An, S.-I., Cai, W., Ganachaud, A., Guilyardi, E., Jin,
F.-F., Jochum, M., Lengaigne, M., Power, S., Timmermann, A., Vecchi, G., and Wittenberg, A.: The impact of global warming on the tropical Pacific Ocean and El Niño, Nat. Geosci., 3, 391–397, doi:10.1038/ngeo868, 2010.
Compo, G. P. and Whitaker, J. S.: The Twentieth Century Reanalysis Project, Q. J. Roy. Meteor. Soc., 137, 1–28, doi:10.1002/qj.776, 2011.
Conroy, J. L., Overpeck, J. T., Cole, J. E., Shanahan, T. M., and Steinitz-Kannan, M.: Holocene changes in east-ern tropical Pacific climate inferred from a Galápagos lake sediment record, Quaternary Sci. Rev., 27, 1166–1180, doi:10.1016/j.quascirev.2008.02.015, 2008.
DiNezio, P. N., Kirtman, B. P., Clement, A. C., Lee, S.-K., Vecchi, G. A., and Wittenberg, A.: Mean Climate Controls on the Simu-lated Response of ENSO to Increasing Greenhouse Gases, J. Cli-mate, 25, 7399–7420, doi:10.1175/JCLI-D-11-00494.1, 2012. Emile-Geay, J., Seager, R., Cane, M. A., Cook, E. R., and Haug, G.
H.: Volcanoes and ENSO over the Past Millennium, J. Climate, 21, 3134–3148, doi:10.1175/2007JCLI1884.1, 2008.
Emile-Geay, J., Cobb, K. M., Mann, M. E., and Wittenberg, A. T.: Estimating Central Equatorial Pacific SST Variability over the Past Millennium, Part I: Methodology and Validation, J. Climate, 26, 2302–2328, doi:10.1175/JCLI-D-11-00510.1, 2013a.
Emile-Geay, J., Cobb, K. M., Mann, M. E., and Wittenberg, A. T.: Estimating Central Equatorial Pacific SST Variability over the Past Millennium, Part II: Reconstructions and Implications, J. Climate, 26, 2329–2352, doi:10.1175/JCLI-D-11-00511.1, 2013b.
England, M. H., McGregor, S., Spence, P., Meehl, G. A., Timmer-mann, A., Cai, W., Sen Gupta, A., McPhaden, M. J., Purich, A., and Santoso, A.: Recent intensification of wind-driven circula-tion in the Pacific and the ongoing warming hiatus, Nature, 4, 222–227, doi:10.1038/nclimate2106, 2014.
Gallant, A. J. E., Phipps, S. J., Karoly, D. J., Mullan, A. B., and Lorrey, A. M.: Nonstationary Australasian Teleconnections and Implications for Paleoclimate Reconstructions, J. Climate, 26, 8827–8849, doi:10.1175/JCLI-D-12-00338.1, 2013.
Guilyardi, E., Bellenger, H., Collins, M., Ferrett, S., Cai, W., and Wittenberg, A.: A first look at ENSO in CMIP5, Clivar Ex-changes, 17, 29–32, 2012.
Graf, H.-F. and Zanchettin, D.: Central Pacific El Niño, the “sub-tropical bridge,” and Eurasian climate, J. Geophys. Res.-Atmos., 117, D01102, doi:10.1029/2011JD016493, 2012.
Karamperidou, C. and Di Nezio, P. N.: The response of ENSO flavors to mid-Holocene climate: Implications for proxy interpretation, Paleoceanography, 30, 527–547, doi:10.1002/2014PA002742, 2015.
Karnauskas, K. B., Smerdon, J. E., Seager, R., and González-Rouco, J. F.: A Pacific Centennial Oscillation Predicted by Cou-pled GCMs*, J. Climate, 25, 5943–5961, doi:10.1175/JCLI-D-11-00421.1, 2012.
Khider, D., Stott, L. D., Emile-Geay, J., Thunell, R., and Ham-mond, D. E.: Assessing El Niño Southern Oscillation vari-ability during the past millennium, Paleoceanography, 26, doi:10.1029/2011PA002139, 2011.
King, A. D., Donat, M. G., Alexander, L. V., and Karoly, D. J.: The ENSO-Australian rainfall teleconnection in reanalysis and CMIP5, Clim. Dynam., 44, 2623–2635, doi:10.1007/s00382-014-2159-8, 2014.
Klingaman, N. P. and Woolnough, S. J.: On the drivers of inter-annual and decadal rainfall variability in Queensland, Australia, Int. J. Climatol., 33, 2413–2430, doi:10.1002/joc.3593, 2013. Lewis, S. C., LeGrande, A. N., Schmidt, G. A., and Kelley, M.:
Comparison of forced ENSO-like hydrological expressions in simulations of the pre-industrial and mid-Holocene, J. Geophys. Res.-Atmos., doi:10.1002/(ISSN)2169-8996, 2014.
Li, J., Xie, S.-P., Cook, E. R., Huang, G., D’Arrigo, R., Liu, F., Ma, J., and Zheng, X.-T.: Interdecadal modulation of El Niño amplitude during the past millennium, Nature Climate Change, 1, 114–118, doi:10.1038/nclimate1086, 2011.
Li, J., Xie, S.-P., Cook, E. R., Morales, M. S., Christie, D. A., John-son, N. C., Chen, F., D’Arrigo, R., Fowler, A. M., Gou, X. ,and Fang, K.: El Niño modulations over the past seven centuries, Nature Climate Change, 3, 822–826, doi:10.1038/nclimate1936, 2013.
Lorenz, R., Davin, E. L., and Seneviratne, S. I.: Modeling land-climate coupling in Europe: Impact of land surface represen-tation on climate variability and extremes, J. Geophys. Res.-Atmos., 117, 2012.
El Niño–Southern Oscillation, Geophys. Res. Lett., 31, doi:10.1029/2004GL019972, 2004.
McGregor, H. V., Fischer, M. J., Gagan, M. K., Fink, D., Phipps, S. J., Wong, H., and Woodroffe, C. D.: A weak El Niño/Southern Oscillation with delayed seasonal growth around 4,300 years ago, Nat. Geosci., 6, 949–953, doi:10.1038/ngeo1936, 2013. McGregor, S. and Timmermann, A.: The Effect of Explosive
Tropical Volcanism on ENSO, J. Climate, 24, 2178–2191, doi:10.1175/2010JCLI3990.1, 2011.
McPhaden, M. J., Lee, T., and McClurg, D.: El Niño and its relation-ship to changing background conditions in the tropical Pacific Ocean, Geophys. Res. Lett., 38, doi:10.1029/2011GL048275, 2011.
Moy, C., Seltzer, G., Rodbell, D., and Anderson, D.: Vari-ability of El Nino/Southern Oscillation activity at millennial timescales during the Holocene epoch, Nature, 420, 162–165, doi:10.1038/nature01194, 2002.
Pascolini-Campbell, M., Zanchettin, D., Bothe, O., Timmreck, C., Matei, D., Jungclaus, J. H., and Graf, H. F.: Toward a record of Central Pacific El Niño events since 1880, Theor. Appl. Clima-tol., 119, 379–389, doi:10.1007/s00704-014-1114-2, 2014. Power, S., Delage, F., Chung, C., Kociuba, G., and Keay, K.: Robust
twenty-first-century projections of El Niño and related precipita-tion variability, Nature, 502, 541–545, doi:10.1038/nature12580, 2013.
San Gupta, A., Jourdain, N. C., Brown, J. N., and Monselesan, D.: Climate Drift in the CMIP5 Models*, J. Climate, 26, 8597–8615, doi:10.1175/JCLI-D-12-00521.s1, 2013.
Santoso, A., McGregor, S., Jin, F.-F., Cai, W., England, M. H., An, S.-I., McPhaden, M. J., and Guilyardi, E.: Late-twentieth-century emergence of the El Nino propagation asymmetry and future pro-jections, Nature, 504, 126–130, doi:10.1038/nature12683, 2013. Schmidt, G. A.: Enhancing the relevance of palaeoclimate model/data comparisons for assessments of future climate change, edited by C. Caseldine, C. Turney, and A. Long, J. Qua-ternary Sci., 25, 79–87, doi:10.1002/jqs.1314, 2010.
Schmidt, G. A., Shindell, D. T., Miller, R. L., Mann, M. E., and Rind, D.: General circulation modelling of Holocene climate variability, Quaternary Sci. Rev., 23, 2167–2181, doi:10.1016/j.quascirev.2004.08.005, 2004.
Schmidt, G. A., Kelley, M., Nazarenko, L., Ruedy, R., Russell, G. L., Aleinov, I., Bauer, M., Bauer, S. E., Bhat, M. K., Bleck, R., Canuto, V., Chen, Y.-H., Cheng, Y., Clune, T. L., Del Genio, A., de Fainchtein, R., Faluvegi, G., Hansen, J. E., Healy, R. J., Kiang, N. Y., Koch, D., Lacis, A. A., LeGrande, A. N., Lerner, J., Lo, K. K., Matthews, E. E., Menon, S., Miller, R. L., Oinas, V., Oloso, A. O., Perlwitz, J. P., Puma, M. J., Putman, W. M., Rind, D., Ro-manou, A., Sato, M., Shindell, D. T., Sun, S., Syed, R. A., Taus-nev, N., Tsigaridis, K., Unger, N., Voulgarakis, A., Yao, M.-S., and Zhang, J.: Configuration and assessment of the GISS Mod-elE2 contributions to the CMIP5 archive, J. Adv. Model. Earth Sys., 6, 141–184, doi::0.1002/2013MS000265, 2014.
Smerdon, J. E.: Climate models as a test bed for climate reconstruc-tion methods: pseudoproxy experiments, WIREs Clim Change, 3, 63–77, doi:10.1002/wcc.149, 2011.
Stevenson, S. L.: Significant changes to ENSO strength and impacts in the twenty-first century: Results from CMIP5, Geophys. Res. Lett., 39, L17703, doi:10.1029/2012GL052759, 2012.
Taylor, K. E., Stouffer, R. J., and Meehl, G. A.: An overview of CMIP5 and the experiment design, B. Am. Meteor. Soc., 93, 485–498, doi:10.1175/BAMS-D-11-00094.1, 2012.
Timmreck, C.: Modeling the climatic effects of large explo-sive volcanic eruptions, WIREs Clim Change, 3, 545–564, doi:10.1002/wcc.192, 2012.
Trenberth, K. E.: The Definition of El Nino, B. Am. Meteor. Soc., 78, 2771–2777, 1997.
Vecchi, G. A. and Wittenberg, A. T.: El Niño and our future climate: where do we stand?, WIREs Climate Change, 1, 260–270, 2010. Wahl, E. R., Diaz, H. F., Smerdon, J. E., and Ammann, C. M.: Global and Planetary Change, Global Planet. Change, 122, 1–13, doi:10.1016/j.gloplacha.2014.08.005, 2014.
Wilson, R., Cook, E., D’Arrigo, R., Riedwyl, N., Evans, M. N., Tudhope, A., and Allan, R.: Reconstructing ENSO: the influ-ence of method, proxy data, climate forcing and teleconnections, edited by: Caseldine, C., Turney, C., and Long, A., J. Quaternary Sci., 25, 62–78, doi:10.1002/jqs.1297, 2010.