Computational Identification of Protein
Pupylation Sites by Using Profile-Based
Composition of
k
-Spaced Amino Acid Pairs
Md. Mehedi Hasan1☯, Yuan Zhou1☯, Xiaotian Lu1, Jinyan Li2, Jiangning Song3,4, Ziding Zhang1*
1State Key Laboratory of Agrobiotechnology, College of Biological Sciences, China Agricultural University, Beijing, 100193, China,2Advanced Analytics Institute and Centre for Health Technologies, University of Technology, Sydney, 81 Broadway, NSW 2007, Australia,3National Engineering Laboratory for Industrial Enzymes and Key Laboratory of Systems Microbial Biotechnology, Tianjin Institute of Industrial
Biotechnology, Chinese Academy of Sciences, Tianjin, 300308, China,4Monash Bioinformatics Platform and Department of Biochemistry and Molecular Biology, Faculty of Medicine, Monash University, Melbourne, VIC 3800, Australia
☯These authors contributed equally to this work. *[email protected]
Abstract
Prokaryotic proteins are regulated by pupylation, a type of post-translational modification that contributes to cellular function in bacterial organisms. In pupylation process, the pro-karyotic ubiquitin-like protein (Pup) tagging is functionally analogous to ubiquitination in order to tag target proteins for proteasomal degradation. To date, several experimental methods have been developed to identify pupylated proteins and their pupylation sites, but these experimental methods are generally laborious and costly. Therefore, computational methods that can accurately predict potential pupylation sites based on protein sequence information are highly desirable. In this paper, a novel predictor termed as pbPUP has been developed for accurate prediction of pupylation sites. In particular, a sophisticated se-quence encoding scheme [i.e. the profile-based composition ofk-spaced amino acid pairs (pbCKSAAP)] is used to represent the sequence patterns and evolutionary information of the sequence fragments surrounding pupylation sites. Then, a Support Vector Machine (SVM) classifier is trained using the pbCKSAAP encoding scheme. The final pbPUP predic-tor achieves an AUC value of 0.849 in10-fold cross-validation tests and outperforms other existing predictors on a comprehensive independent test dataset. The proposed method is anticipated to be a helpful computational resource for the prediction of pupylation sites. The web server and curated datasets in this study are freely available athttp://protein.cau.edu. cn/pbPUP/.
OPEN ACCESS
Citation:Hasan MM, Zhou Y, Lu X, Li J, Song J, Zhang Z (2015) Computational Identification of Protein Pupylation Sites by Using Profile-Based Composition ofk-Spaced Amino Acid Pairs. PLoS ONE 10(6): e0129635. doi:10.1371/journal. pone.0129635
Academic Editor:Yu Xue, Huazhong University of Science and Technology, CHINA
Received:February 5, 2015
Accepted:May 10, 2015
Published:June 16, 2015
Copyright:© 2015 Hasan et al. This is an open access article distributed under the terms of the Creative Commons Attribution License, which permits unrestricted use, distribution, and reproduction in any medium, provided the original author and source are credited.
Data Availability Statement:All relevant data are within the paper and its Supporting Information files.
Funding:MMH was financially supported by the China Scholarship Council (CSC). JL was supported by an ARC Discovery Project (DP130102124). JS is a recipient of the Hundred Talents Program of the Chinese Academy of Sciences (CAS).
Introduction
The bacterial prokaryotic ubiquitin-like protein (Pup) is initially perceived as a small protein related to post-translational modifications (PTMs). Pup is an intrinsically unstructured protein
consisting of 64 amino acids [1,2]. In the tagging system referred as pupylation, this protein
covalently attaches to target lysines for proteasomal degradation by forming isopeptide bonds
[3–5]. In eukaryotes, the ubiquitin-proteasome degradation pathway was discovered in the late
1970's [6], while the analogous Pup-proteasome pathway was not identified in prokaryotes
until recently [5,7,8]. To date, the proteasomal Pup has been discovered in the phyla
Actino-bacteria and Nitrospira species [9]. The evidence of Pup proteasome degradation pathway has
been rapidly accumulating in both thein vitro[10,11] andin vivosystems [12].
Pupylation and ubiquitylation are functionally identical but their enzymology is different. In general, ubiquitylation requires three types of enzymes: ubiquitin-activating enzymes,
ubi-quitin-conjugating enzymes, and ubiquitin ligases [13]. Comparatively, the pupylation process
involves two enzymes: one is the deamidase of Pup (DOP) which deamidates the C-terminal
glutamine of Pup to glutamate [14,15], and the other is the proteasome accessory factor A
(PafA) which proceeds the deamidase process by attaching Pup to a specific lysine [16,17].
More specifically, pupylation enzymes are originated from bacterial organisms and show no
homology to ubiquitylation enzymes [18,19].
The Pup-proteasome degradation pathway plays a nutritional role under nitrogen
starva-tion by recycling amino acids [20]. This proteasomal pathway is also critical for the virulence
of bacteria [21,22]. Therefore, identification of pupylated substrates is fundamentally
impor-tant for understanding both the physiological and pathological mechanisms. A number of large-scale proteomic studies have been performed to identify pupylated proteins based on the
molecular signature of pupylated sites [23–27]. Despite the increasing number of
experimental-ly determined pupylated proteins, the underexperimental-lying mechanism of protein pupylation specificity
remains largely unknown [25]. On the other hand, large-scale experimental identification of
pupylation substrates is laborious, time-consuming and costly. As an alternative, accurate and cost-effective prediction methods can be used to complement the experimental efforts.
Up to now, a few computational approaches have been developed to predict pupylation sites
[28–31]. Xue and co-workers [30] proposed the first predictor named GPS-PUP, which was
de-veloped from their original Group-based Prediction System (GPS) with three procedures (i.e. weight training, motif length selection, and matrix mutation) for performance improvement.
In 2013, Tung [29] used a training dataset collected from the PupDB database [32] and an
en-coding scheme called the composition ofk-spaced amino acid pair (CKSAAP) to develop a
predictor called iPUP. Support Vector Machine (SVM) together with a backward feature
selec-tion method was used to train the classifier. Both GPS-PUP [30] and iPUP [29] predictors
yielded good performance for predicting pupylation sites. In particular, they achieved higher
specificity, although their sensitivity was generally low. More recently, Chen et al. [31]
devel-oped a predictor PupPred based on balanced training data (1:1 ratio of positive to negative samples). To train the classifier, PupPred combined the k-nearest neighbor (KNN) algorithm with a variety of features including binary features, amino acid pairs, protein secondary struc-tures, position-specific scoring matrix (PSSM) and physicochemical properties. They demon-strated that the encoding of amino acid pairs, the implementation of F-measures for feature selection and the SVM-based classifier contributed to the improved performance of PupPred.
new SVM predictor named pbPUP based on an improved CKSAAP encoding, i.e. the
profile-based composition ofk-spaced amino acid pairs (pbCKSAAP). The traditional CKSAAP
en-coding has been widely and successfully used in diverse bioinformatics prediction tasks, such
as the prediction of pupylation sites [29], flexible/rigid region [33], O-glycosylation sites [34],
ubiquitination sites [35], palmitoylation sites [36], methylation sites [37] and phosphorylation
sites [38]. Compared with the traditional CKSAAP encoding, the pbCKSAAP encoding scheme
has the advantage of integrating the sequence evolutionary information from the profile (i.e. PSSM) generated by PSI-BLAST search. Originally developed for the prediction of membrane
protein [39], pbCKSAAP has revealed more powerful performance in some applications such
as the prediction of bacterial pathogen effectors [40].
In this study, the pbPUP predictor was constructed using the training dataset of iPUP [29].
An independent test dataset [25,29] was used for making fair performance comparison among
different methods. The results indicated that pbPUP achieved significantly improved perfor-mance on the independent tests compared with other existing methods. Moreover, we also conducted a series of computational analyses to provide in-depth understandings of the pbCKSAAP encoding. Finally, the proposed method pbPUP has been implemented as a web server. Taken together, the current study provides a useful tool for predicting pupylation sites as well as valuable insights into the important sequence patterns surrounding pupylation sites.
Materials and Methods
In brief, pbPUP is an SVM-based predictor, which was constructed using the pbCKSAAP se-quence encoding scheme. An overview of the computational framework of the proposed
pbPUP predictor is shown inFig 1.
Data preparation
In this study, two datasets were used to train and assess the proposed pbPUP predictor,
includ-ing the traininclud-ing dataset of iPUP (S1 Table) and an independent test dataset (S2 Table). The
ex-perimentally validated pupylation sites (lysine residues) were considered as positive samples, while all the remaining lysine residues that have not been verified as pupylation sites in these proteins were considered as negative samples (i.e. non-pupylation sites). Each site was repre-sented as a sequence fragment with lysine (K) in the center. These two datasets are also
sum-marized inTable 1.
The iPUP training dataset was previously compiled to train the iPUP predictor [29], which
includes 162 pupylated proteins covering 183 positive and 2205 negative sites. The iPUP train-ing dataset was also employed to train our pbPUP predictor. The numbers of positive and puta-tive negaputa-tive samples are highly imbalanced in the original iPUP training dataset (~1:12); this imbalance will hamper model training. Therefore, a relatively balanced dataset with a 1:2 ratio of positives to negatives (i.e. 183 positive sites and 366 randomly selected negative sites) was compiled to train our pbPUP predictor.
An independent test dataset was also compiled to benchmark the prediction performance of different predictors. First, 20 pupylated proteins, originally used as the independent test data of iPUP, was directly used in our work. Moreover, we also collected 55 pupylated proteins from a
recent work [25]. Among these 55 proteins, the lysine positions of four proteins did not match
with the UniProt database (http://www.uniprot.org/). Thus, these four proteins were removed
independent test, all the pupylation and non-pupylation sites were used to assess the perfor-mance of different predictors. We believe that the perforperfor-mance assessed using the highly imbal-anced data could reflect the real applications of different predictors.
Fig 1. Overview of the proposed pbPUP predictor.The full-length sequence of a pupylated protein is first used to generate the PSSM profile by running PSI-BLAST search against the NCBI NR90 database. Meanwhile, the PSSM matrixes corresponding to pupylation and non-pupylation sites are extracted from the whole profile. The encoded profile-based features are used as the input to train a SVM classifier. After optimization of the SVM parameters, the best SVM model is constructed based on the 10-fold cross-validation performance. Finally, a web server pbPUP is implemented and made available for interested users to predict the potential pupylation sites from the submitted proteins.
doi:10.1371/journal.pone.0129635.g001
Table 1. The statistics of pupylated proteins and their pupylation sites used in this study.
The iPUP training dataset Independent test dataset
Number of pupylated proteins 162 71
Number of pupylation lysines 183 86
Number of non-pupylation lysines 2205 (366) 1136
Values in parentheses represent the number of sites used in this study.
Encoding scheme of pbCKSAAP
The encoding scheme of pbCKSAAP has been used in previous studies [39,40]. Briefly, ak
-spaced amino acid pairs can be represented aspi{k}pj(i,j= 1, 2,. . ., 20), wherepiandpjdenote
any two residues of the 20 amino acid types. Whenk= 0,pi{k}pjstands for a dipeptide and a
total of 20×20 = 400 different dipeptides should be taken into account. In this work,k= 0, 1, 2,
3 and 4 were jointly considered (i.e.kmax= 4). Thus, the feature vector of each
pupylation/non-pupylation site has a dimensionality of 400×5 = 2000. To conduct the pbCKSAAP encoding, each protein sequence was searched by PSI-BLAST against the NCBI NR90 database (version of December 2010) to generate a profile (i.e. PSSM matrix). The e-value cutoff for the inclusion
of new sequences and iteration times were set as 1.0×10⁻⁴and 3, respectively. For each
pupyla-tion/non-pupylation site, the corresponding PSSM matrix was extracted from the whole
pro-file. If an amino acid pairpi{k}pjappears between the residue positionstandt+k+1 in the
PSSM matrix, the composition score can be calculated using the following equation:
Si;j¼ XN
maxfminfPSSMðt;piÞ;PSSMðtþkþ1;p
jÞg;0g ð1Þ
where PSSM (t,pi) denotes the score of amino acidpiat thetthrow position of PSSM, PSSM (t
+k+1,pj) stands for the score of amino acidpjat the (t+k+1)throw position of PSSM, N means
pi{k}pjappears N times in the pupylation/non-pupylation site. Furthermore, we normalizedSi,j
using the following formula:
S0i;j¼
Si;j
L k 1 ð2Þ
whereLdenotes the total length of sequence fragment, i.e. window size =L. Finally, we
generat-ed the pbCKSAAP encoding, which is a 2000-dimensional feature vector for each pupylation/ non-pupylation site.
To investigate the evolutionary conservation of pupylated or non-pupylated sites, we calcu-lated the average PSSM value (APV) of each position (i.e. the average of each row of the PSSM matrix) in the flanking sequence fragments of each pupylated/non-pupylated site. These APVs were further averaged. More specifically, because the optimal window size in this study was 57,
the APVs of the positions [–28,–1] were averaged to obtain the APV of the upstream sites,
while the APVs of the positions [+1,+28] were averaged to obtain the APV of the downstream sites.
Encoding scheme of CKSAAP
Compared with pbCKSAAP, the encoding scheme of CKSAAP is quite simple, which can be directly calculated from the sequence fragments of pupylation/non-pupylation sites. By effec-tively representing the short sequence motif information in protein sequences or fragments,
CKSAAP is an important encoding scheme in many prediction tasks [29,34–36,38,39]. In
this work, we retrained the SVM model using the CKSAAP encoding scheme with the purpose of comparing the performance between pbCKSAAP and CKSAAP. To conduct a stringent
comparison, the same window size and the samekmaxvalue were adopted. Thus, a
2000-di-mensional feature vector was also generated in the CKSAAP encoding scheme. More details
about the CKSAAP encoding can be found in our previous studies [34,35].
Feature selection
vector. It is well known that there could be some key residues or motifs which contribute
signif-icantly to the identification of PTM sites [34,41,42]. However, it would be challenging to
read-out the key residues or motifs directly from the high-dimensional feature vector of the pbCKSAAP encoding. Therefore, we employed a well-established dimensionality reduction
method, Chi-Squared (χ2) to characterize the top ranking features [39]. LetXbe a feature with
npossible valuesx1,x2,. . .,xnwith the probabilityP(X=xj) =pj. Then, for a dataset withctot
positive samples anddtotnegative samples, theχ2score of this feature can be calculated using
the following formula:
w2 ¼
Xn
j¼1
ðcj ctotpjÞ
2
ctotpj
þðdj dtotpjÞ
2
dtotpj
" #
ð3Þ
In addition to the aforementioned variables (pj,ctot,dtot),cjis the observed numbers of the
posi-tive samples whose feature valueX=xj, whiledjis the observed numbers of the positive
sam-ples whose feature valueX=xj. By definition, a larger value ofχ2indicates that the
corresponding feature has a greater impact on the discrimination capability of the predictor.
More information about theχ2feature selection method can be found in the literature [39].
Model training
In our study, SVM was used to build the classifiers to distinguish the pupylation sites from non-pupylation sites. As an efficient machine learning algorithm, SVM has been widely used in
pro-tein bioinformatics [43–48]. In this work, the LIBSVM package (http://www.csie.ntu.edu.tw/~
cjlin/libsvm/) was used as an implementation of SVM to train the classifiers [49]. The kernel
ra-dial basis function (RBF) was selected and two parametersCandγwere optimized based on the
training dataset through a grid search provided by the LIBSVM package. The ranges of bothC
andγwere set as [2−7, 28], which resulted in 225 grids. All the grids were evaluated based on
10-fold cross validation in order to find the optimal parameter combination ofCandγ.
Model evaluation and cross validation
10-fold cross-validation tests were performed to assess the performance of our prediction model. In the 10-fold cross-validation tests, the training dataset was divided into10 subgroups with ap-proximately equal size. At each cross-validation step, one subgroup was singled out as the test dataset to assess the performance of the classifier, while the classifier was trained using the re-maining 9 subgroups. The performance of each cross-validation produced a single estimation
and this procedure was repeated 10 times. To evaluate the model’s performance, four
measure-ments were calculated, including accuracy (Ac), sensitivity (Sn), specificity (Sp), and Matthews’
correlation coefficient (MCC). The following formulae are used to calculate these measures:
Ac¼ TPþTN
TPþTNþFPþFN ð4Þ
Sn¼ TP
TPþFN ð5Þ
Sp¼ TN
TNþFP ð6Þ
MCC¼ ffiffiffiffiffiffiffiffiffiffiffiffiffiffiffiffiffiffiffiffiffiffiffiffiffiffiffiffiffiffiffiffiffiffiffiffiffiffiffiffiffiffiffiffiffiffiffiffiffiffiffiffiffiffiffiffiffiffiffiffiffiffiffiffiffiffiffiffiffiffiffiffiffiffiffiffiffiffiffiffiffiffiffiffiffiffiffiffiffiffiffiffiffiffiffiffiffiffiffiffiffiffiffiTPTN FPFN
ðTNþFNÞ ðTPþFPÞ ðTNþFPÞ ðTNþFPÞ
WhereTP,FP,TN, andFNrepresent the numbers of true positive, false positive, true negative and false negative, respectively. Furthermore, the receiver-operating characteristic (ROC) curve, which plots Sn against 1-Sp at different thresholds, was also employed for performance assess-ment. To further quantify the performance, the areas under the ROC curves (AUCs) were
calcu-lated by the pROC package in R software [50,51].
Results and Discussion
Performance assessment on the training dataset
The iPUP training dataset was used to develop the pbPUP predictor. The ratio of positive to negative samples is nearly 1:12 in this dataset, which is highly imbalanced. It has been estab-lished that machine learning algorithms become computationally intractable and their
accura-cy is strongly affected due to the nature of the unbalanced datasets [52,53]. To address this,
many PTM site predictors employ a relatively balanced ratio of positives to negatives to train
the classification models, including the prediction of pupylation sites as well [31,54,55]. In the
current study, a 1:2 ratio of positives to negatives was used for the training dataset to develop the proposed SVM predictor.
The window size is an important factor of the prediction performance, which reflects the in-fluence of surrounding residues on the discrimination of pupylation from non-pupylation sites. The window sizes ranging from 25 to 61were optimized based on the AUC values. For each window size, the SVM parameters were optimized through the grid search, and the corre-sponding AUC value was obtained from the 10-fold cross-validation test on the training set. As
a result, the optimal window size of 57 (the corresponding optimal SVM parameters areC= 8
andγ= 2) was finally selected, though the performance increase with the window size ranging
from 45–57 was not prominent (S1 Fig).
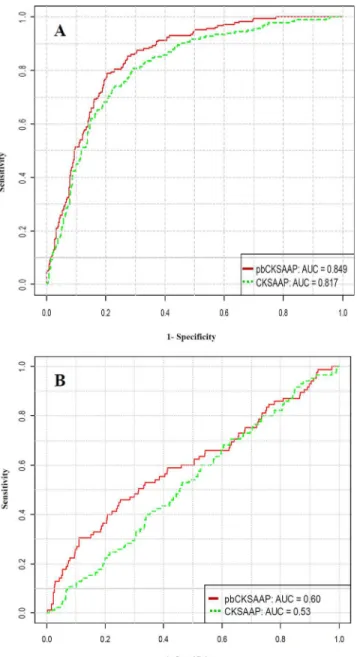
At the 90% specificity control (SVM score0.0), pbPUP reached an accuracy of 76.06%
(Sn = 48.15% and MCC = 0.44). Meanwhile, in terms of ROC curve (Fig 2A), pbPUP achieved
an AUC value of 0.849. Furthermore, we also conducted 4-, 6-, and 8-fold cross-validation tests, and the corresponding AUC values were 0.829, 0.838 and 0.846, respectively. In summa-ry, we conclude that pbPUP predictor provides a stable and promising performance in the cross-validation tests on the training dataset.
Performance comparison of pbPUP with three existing predictors on the
independent dataset
To compare the performance of pbPUP and three other existing predictors (iPUP, GPS-PUP, and PupPred), we compiled an independent dataset covering 71 pupylated proteins, which contain 86 pupylation and 1136 putative non-pupylation sites. Among these proteins, 20 pro-teins (i.e. the independent test set used in iPUP) were extracted from the original article of
iPUP [29] and 51 proteins were retrieved from a recent study [25]. Although pbPUP and these
a comparison. Similar to the other predictors, we also reported the performance of pbPUP at High, Medium and Low confidence thresholds. To make a fair comparison, the thresholds of High, Medium and Low in pbPUP were set to ensure that the corresponding specificities were
controlled at the same levels as those of GPS-PUP. As shown inTable 2, the pbPUP predictor
achieved an improved performance with approximately 4%, 5%, and 3% higher MCC values
under high, medium, and low confidence thresholds than iPUP (Table 2). The MCCs of the
pbPUP predictor were nearly 7%, 8%, and 2% higher than the GPS-PUP predictor at high,
me-dium, and low thresholds, respectively (Table 2). In addition, the pbPUP predictor achieved
MCC values of almost 9%, 5%, and 5% higher than PupPred at high, medium, and low
confi-dence thresholds (Table 2). The performance comparison results demonstrate that our
Fig 2. Performance comparison between pbCKSAAP and CKSAAP using ROC curves.(A) Performance comparison based on 10-fold cross-validation of the training dataset; (B) Performance comparison based on the independent test dataset.
proposed pbPUP predictor provides a better or competitive performance with the other three existing predictors, indicating the encoding scheme of pbCKSAAP is very useful and powerful.
Interestingly, pbPUP and the other three existing predictors showed significantly lower per-formance on the independent data. Our analysis suggests that the sequence patterns of pupyla-tion sites and surrounding regions in the training and independent datasets are highly
different. The position-specific amino acid occurrences for the pupylation and putative non-pupylation sites in the training and independent datasets were visualized using the
Two-Sam-ple-Logo [56] (Fig 3). Generally, the amino acid pattern around the pupylation sites is
some-what camouflaged in the independent dataset (Fig 3B), because the independent data was
collected from two distinct non-pathogenic bacteriaEscherichia coliandCorynebacterium
glu-tamicum[25,29]. The pupylation data of the latter organism has never been considered by any of the predictors. Therefore, the collected independent dataset was novel and challenging. On one hand, by intensively exploiting evolutionary information, pbPUP could achieve better per-formance on these novel data. On the other hand, there might exist species-specific pupylation
site patterns, similar to other PTM types such as acetylation [55]. Accordingly, more
compre-hensive predictors (e.g. species-specific predictors) need to be developed when more pupyla-tion data become available in the future.
The influence of sequence redundancy on the predictive performance
The sequence redundancy might lead to the overestimation of prediction performance.
There-fore, we adopted two approaches to remove the redundant sequences: 1) BLASTClust (http://
www.ncbi.nlm.nih.gov/BLAST/docs/blastclust.html) was applied to remove redundant protein sequences with the 30% identity cutoff (i.e. redundancy removal at the protein level); 2) An in-house PERL script was used to remove redundant pupylated/non- pupylated peptides (also with 30% identity cutoff) at the peptide level. It is noteworthy that, as mentioned above, the au-thors of iPUP combined the training and testing datasets when they constructed the iPUP serv-er. It is therefore not reasonable to submit any of the 20 proteins again to the iPUP servserv-er. To make a fair performance comparison, we had to keep these 20 proteins as they were (i.e., no
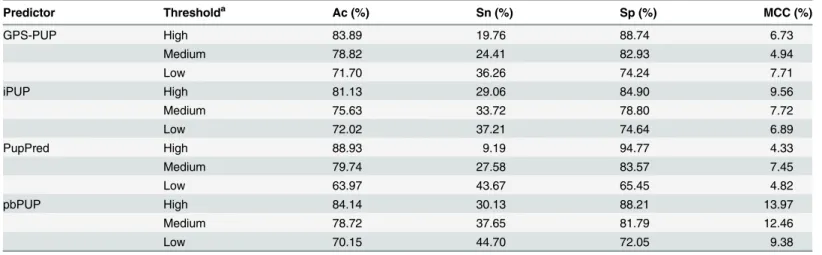
Table 2. The prediction performance of pbPUP and other existing predictors evaluated on the independent test dataset.
Predictor Thresholda Ac (%) Sn (%) Sp (%) MCC (%)
GPS-PUP High 83.89 19.76 88.74 6.73
Medium 78.82 24.41 82.93 4.94
Low 71.70 36.26 74.24 7.71
iPUP High 81.13 29.06 84.90 9.56
Medium 75.63 33.72 78.80 7.72
Low 72.02 37.21 74.64 6.89
PupPred High 88.93 9.19 94.77 4.33
Medium 79.74 27.58 83.57 7.45
Low 63.97 43.67 65.45 4.82
pbPUP High 84.14 30.13 88.21 13.97
Medium 78.72 37.65 81.79 12.46
Low 70.15 44.70 72.05 9.38
aThe threshold values of GPS-PUP, iPUP and PupPred were the same as those defined in the corresponding webservers. To make the performance comparison, the thresholds of High, Medium and Low in pbPUP were set as 0.06, 0.00 and -0.04, respectively. Thus, the corresponding specificities were controlled at the same levels as GPS-PUP.
redundancy removal procedure was applied to these 20 proteins), and used the performance
reported in their original literature to evaluate predictors’performance on these 20 proteins.
After removing the protein level sequence redundancy, we re-assembled a training dataset that contained 129 proteins with 149 pupylation and 298 non-pupylation sites (with the consis-tent 1:2 ratio of positives to negatives), and a testing dataset that contained 64 proteins with 76
pupylated and 1049 non-pupylation sites. As shown inS2 Fig, the overall performance of
pbPUP in the 10-fold cross-validation decreased slightly (AUC = 0.841) after removal of the protein sequence redundancy. Furthermore, pbPUP could still achieve the best performance
on the independent testing dataset (S3 Table). For example, when compared with iPUP,
pbPUP achieved MCC values of approximately 4%, 3% and 1% higher under high, medium, and low thresholds, respectively. pbPUP also achieved at least a 2% MCC improvement com-pared with PupPred and GSP-PUP at any of the three confidence thresholds. These
Fig 3. Sequence logo representations showing the amino acid occurrences between pupylation and putative non-pupylation sites.Only residues that were significantly enriched or depleted (t-test,P<0.05) flanking the centred pupylation sites are shown. Panel A represent the two-sample logo of the iPUP training dataset, while panel B plots the two-sample logo of the independent test dataset. The two-sample sequence logos were prepared using the web serverhttp://www.twosamplelogo.org/.
performance comparison results prove that pbPUP predictor provides a better or competitive performance with the other three existing predictors on the independent test datasets, even after removal of the protein sequence redundancy.
In addition, we examined the predictors’performance after removing the peptide-level
se-quence redundancy. A training dataset including 148 pupylated sites and 296 non-pupylated sites were accordingly obtained (with the consistent 1:2 ratio of positives to negatives). Similar to the situation after protein-level sequence redundancy removal, there was only a small change of the overall cross-validation performance (AUC = 0.837). The independent test dataset after removal of the peptide-level sequence redundancy included 79 pupylated sites and 992 non-pupylated sites. On this dataset, pbPUP achieved the MCC values of 4%, 2%, 1% higher than
iPUP at high, medium, and low confidence thresholds (S4 Table). Likewise, the MCC values of
the pbPUP predictor was nearly 7%, 5%, and 1% better than the GPS-PUP predictor and 10%,
4%, and 2% better than PupPred at the corresponding thresholds (S4 Table). Altogether, we
conclude that pbPUP predictor achieves a stable and competitive performance compared with other methods under both sequence-level and peptide-level sequence redundancy reduction conditions.
Comparison of the pbCKSAAP and CKSAAP encoding schemes
The CKSAAP encoding has been previously used for prediction of pupylation sites (i.e. the
iPUP predictor) [29], and the aforementioned independent test has clearly shown that our
pbPUP can outperform iPUP. Since the encoding schemes of pbCKSAAP and CKSAAP are de-veloped based on a similar strategy, it is of particular interest to comprehensively compare these two encoding schemes. To this end, we re-trained the CKSAAP-based SVM model using the training dataset in this work. Note that the window size and SVM parameters were the same as those used for training pbPUP. Based on the 10-fold cross-validation tests, pbCKSAAP
outperformed the conventional CKSAAP considerably (Fig 2A).The AUC value of pbCKSAAP
was approximately 3% higher than that of CKSAAP. Moreover, pbCKSAAP achieved MCC, Ac, and Sn of about 4%, 2%, and 7% higher than CKSAAP, respectively, at the fixed Sp of 90%. In addition, on the independent test dataset, the pbCKSAAP method also achieved an AUC
value of approximately 7% higher than CKSAAP for pupylation site prediction (Fig 2B). These
results again suggest that pbCKSAAP achieved a significant performance improvement over CKSAAP for predicting pupylation sites.
To further compare pbCKSAAP with CKSAAP, theχ² feature selection method was applied
to select the most important pbCKSAAP and CKSAAP features. In particular, we found that the
averageχ² feature score of pbCKSAAP features was much higher than that of CKSAAP features
(Fig 4A). This suggests that the pbCKSAAP features contained more important information than the CKSAAP features. To make a stringent comparison, we used the same feature score
cut-off (i.e.χ²3) to select more informative features from both CKSAAP and pbCKSAAP sequence
encodings. When this cutoff was applied, the number of selected pbCKSAAP features was 196,
while the number of selected CKSAAP features was only 169 (Fig 4B). The number of common
features shared by both pbCKSAAP and CKSAAP was 45 (Fig 4B). In summary, we conclude
that pbCKSAAP contained more informative features than CKSAAP, which provides an impor-tant evidence to explain the better performance of pbCKSAAP.
score (APV) of each residue surrounding pupylation and non-pupylation sites, as a useful in-dicator of residue conservation. The scores were calculated from each line of the PSSM matrix of the given sequences. In particular, the average PSSM values (APV) were summarized for the upstream (positions from -28 to -1), center (position 0 or central lysine) and downstream (positions from +1 to +28) regions surrounding pupylation sites. The evolutionary
conserva-tion scores of PSSM between pupylaconserva-tion and non-pupylaconserva-tion sites are illustrated inFig 5.
P-values were also calculated using the one-tailedt-test for residue positions in the upstream,
center and downstream regions between pupylation and non-pupylation sequence fragments.
As a result, we found that theP-values in the upstream and downstream regions were greater
than 0.05 (P= 0.333 and 5.44×10⁻², respectively), which means that the two groups of
sam-ples were not significantly different. Nevertheless, certain adjacent amino acid positions sur-rounding pupylation sites had significantly higher APV scores, especially the upstream positions -25, -8, -3,-4, -1 and downstream positions +3, +4, +7, +8, +11, +15, +18, +22, +25 (S3 Fig). On the other hand,P-value in the center region of lysine position was also less than
0.05 (P= 3.31×10⁻³), which suggests that pupylation sites are relatively more conserved
(Fig 5). Altogether, our results confirm that the local regions surrounding pupylation sites have more conserved sequence patterns than the non-pupylation counterparts, which might possibly explain why the pbCKSAAP scheme performed better than the simple CKSAAP scheme for this prediction task.
Fig 4. Comparison of the selected features in pbCKSAAP and CKSAAP using theχ² feature selection method.(A) Feature scores of pbCKSAAP and CKSAAP; (B) The numbers of selected features in
Significant features of pbCKSAAP
As mentioned above, a well-established feature selection methodχ²was used to select the most
important features from the high-dimensional pbCKSAAP encoding that contributed to the performance. We performed multiple rounds of experiments to select appropriate feature sets; however, it turned out that there was no significant improvement in the corresponding perfor-mance using the selected features. Probably due to the fact that SVM has a good tolerance of high-dimensional input features, the feature selection did not result in a better SVM model, which is consistent with the observations in our previous studies. Therefore, feature selection was not utilized in our final predictor. Although the feature selection strategy did not lead to significant performance improvement, we identified the top ranked 30 amino acid pairs for the purpose of investigating the most significant residues and positions surrounding pupylation and non-pupylation sites. The top 30 residue pair scores and their corresponding positions are
listed inS5 Table. These important features are also presented in a radar diagram (Fig 6). The
feature‘N×××E’(i.e. 3-spaced residue pair of‘NE’, where‘×’stands for any residue) was the
most important amino acid pair, representing the most enriched motif surrounding pupylation
sites. Similarly, the feature‘AA’which represents a 0-spaced residue pair of‘AA’is the most
important and enriched in the non-pupylated sites (Fig 6). Interestingly, the majority of the
top 30 features contain charged residues such as K, R, H, E, and D (Fig 6), indicating that
charged residues may play an important role in the recognition of pupylation sites. We also
ob-served that amino acid pairs that cover all possiblekvalues (i.e.k= 0, 1, 2, 3 and 4) were
includ-ed as the most significant features (Fig 6), suggesting that all spaced amino acid pairs are
necessary to make a collective contribution to the prediction of pupylation sites.
Although the SVM framework what pbPUP used is a black-box computational model, the above analyses have provided clues for interpreting the biological knowledge of the pbCKSAAP encoding scheme. That is, the pbCKSAAP encoding is able to represent and depict the weakly conserved motifs hidden in the surrounding sequences of pupylation sites. Three important
Fig 5. Box plots of the average PSSM values (APV) of amino acids positioned in the upstream, center, and downstream regions of pupylation and non-pupylation sites.Red color denotes pupylation sites, while green color denotes non-pupylation sites.
properties of this encoding should be highlighted. The first one is the usage ofk-spaced amino
acid pair. As a sketch of sequence motif,k-spaced amino acid pair could better reflect the
coor-dinated pairs of residues surrounding the pupylation sites. Indeed, as shown inFig 6andS5
Table, amino acid pairs covering all possiblekvalues (i.e.k= 0, 1, 2, 3 and 4) and almost all of the 20 amino acids (except rare amino acids like C, W, Y) could be found in the list of the top
30 most-informative features. These results indicate that the spectrum of possiblek-spaced
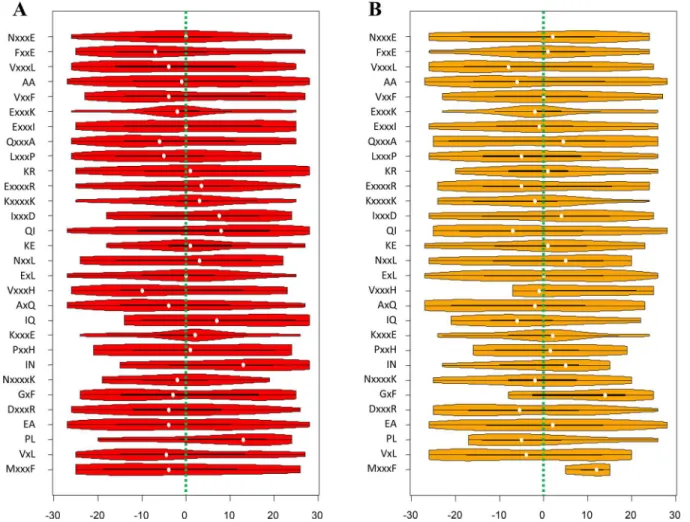
amino acid pairs could serve as an enriched and explicit representation of the sequence pat-terns. The second key property of the pbCKSAAP encoding is the usage of position-indepen-dent composition encoding. We mapped the top 30 informative amino acid pairs onto the
pupylated peptides in both the training and testing datasets, respectively (Fig 7). It is obvious
that most of them did not exhibit concentrated distributions, but were instead dispersed along the peptide fragment. Even for the amino acid pairs that showed obvious concentrated distri-butions (e.g. FxxE and KxxxxK), their distridistri-butions were still somehow different in the training
and testing samples (Fig 7). For instance, the distribution of FxxE shifted towards the
down-stream in the testing samples, while the distribution of KxxxxK shifted towards the updown-stream in the training samples. Therefore, in this situation, the position-independent encoding might be able to better describe the sequence patterns than a position-dependent encoding. On the other hand, it is also noticeable that pbCKSAAP did not completely disregard other informa-tive position-dependent amino acid patterns. For example, a conserved enrichment of E at
po-sitions -4 and +4 was observed in the flanking sequences of pupylation sites (Fig 3).
Accordingly, the amino acid pairs ExxxK and KxxxE were ranked among the top features (Fig
6) and exhibited conserved positional distributions in the training and testing samples (Fig 7).
Last but not least, pbCKSAAP embedded the evolutionary information into its encoding. Our previous analysis has shown that several positions flanking the pupylation sites were slightly
more conserved than the corresponding positions of non-pupylation sites (S3 Fig). pbCKSAAP
took advantage of this weak conservation pattern to prioritize the weakly conserved amino acid
pairs. To characterize the pbCKSAAP-specific features and CKSAAP-specific features (Fig 4B),
Fig 6. Top 30 amino acid pairs selected by theχ² feature selection method.Red color denotes pupylation sites, while blue color denotes non-pupylation sites. The radar diagram is represented by the composition of each residue pair whose length is proportional to the composition of pbCKSAAP features.
we compared the numbers of their matched pupylated peptides on the independent testing
dataset. As shown inS4 Fig, pbCKSAAP-specific features generally matched more pupylated
peptides than CKSAAP-specific features. Especially, the fraction of zero-matched features of pbCKSAAP-specific features was significantly smaller than that of CKSAAP-specific features, indicating that pbCKSAAP is able to extract weakly conserved amino acid pairs to achieve more accurate prediction performance.
Web server implementation
As an implementation of our method, a web server of pbPUP (profile-based pupylation site
predictor) has been made available athttp://protein.cau.edu.cn/pbPUP/to the research
com-munity. The web server was developed using Perl, CGI scripts, PHP and HTML. The input and
exemplar output web pages of the server are shown inS5A and S5B Fig, respectively. In the
input web page, users can submit their query sequence by pasting it into the text box. After sub-mitting the query sequence to the server, it will initially generate lysine fragments of all candi-date pupylation sites. Simultaneously, the server will generate the PSSM matrix of the query sequence by performing PSI-BLAST search and calculate the pbCKSAAP encodings for all the
Fig 7. The violin plots illustrating the positional distributions of the top 30 amino acid pairs of the pbCKSAAP encoding on the pupylated peptides. (A) The distributions on the pupylated peptides from the training samples; (B) The distributions on the pupylated peptides from the independent testing samples. The white dots indicate the median values, the black boxes indicate the ranges between 1stquartiles and 3rdquartiles, while the outskirt violin-like shapes denote the probability destiny plots. For clarity, green dashed lines indicating the position of the central lysines are also added.
generated fragments. Finally, the server will calculate the prediction scores of all the fragments with the assistance of SVM classifier. After the submission job is completed, the server will re-turn the prediction result in the output webpage, consisting of the job ID, the query protein name, residue position, and the SVM score of the predicted pupylation sites in a tabular form. Note that the current pbPUP server predicts pupylation sites at the 90% specificity control. Users can also view the results in the text format. The prediction results will be generated for all candidate lysine residues of the submitted sequence. User will receive a job ID and can save this ID for future query. Our server stores this job ID for one month.
Conclusion
In this study, we have developed an efficient approach termed as pbPUP for improving the pre-diction of protein pupylation sites. Benchmarking experiments based on cross-validation and independent tests have shown that pbPUP provides a competitive performance compared with several existing methods. We have also shown that the proposed sequence encoding scheme pbCKSAAP outperformed the conventional CKSAAP encoding scheme. Our analysis suggests that the pbCKSAAP encoding is able to capture important sequence evolutionary information, which plays an important role for the performance improvement. Moreover, we performed fea-ture selection experiments to characterize the contributive feafea-tures and facilitate better under-standing and interpretation of our prediction model. Computational analyses also demonstrate that our proposed method can be used as a powerful tool for understanding the mechanism of protein pupylation. Finally, we have also implemented a user-friendly web server for the
re-search community, which is freely available athttp://protein.cau.edu.cn/pbPUP/.
Supporting Information
S1 Table. List of training data.
(XLSX)
S2 Table. List of independent data.
(XLSX)
S3 Table. The prediction performance of pbPUP and other existing predictors on the inde-pendent test dataset after the removal of protein-level sequence redundancy.
(DOC)
S4 Table. The prediction performance of pbPUP and other existing predictors on the inde-pendent test dataset after the removal of peptide-level sequence redundancy.
(DOC)
S5 Table. The most important features and their corresponding feature selection scores.
(DOCX)
S1 Fig. AUC values for different window sizes based on 10-fold cross-validation tests.
(DOCX)
S2 Fig. ROC curves after the application of different sequence redundancy removal meth-ods (at either protein- or peptide-level), according to 10-fold cross-validation tests.
(DOCX)
S3 Fig. Average PSSM values (APV) at different positions of positive and negative frag-ments.P-values were calculated using the one-tailed t-test.,P<0.01.
S4 Fig. The distribution of matched pupylated peptides of the selected amino acid pair fea-tures in the testing dataset.The matched pupylated peptides of pbCKSAAP-specific features and CKSAAP-specific features were considered, respectively.
(DOCX)
S5 Fig.(A) The input page of the pbPUP server. Users can paste the query sequence into the text box and submit the prediction job; (B) The output page of the pbPUP server, which pro-vides an example output of the prediction result for the query sequence.
(DOCX)
Acknowledgments
The authors would like to thank Dr. Zhen Chen, Xuhan Liu, and Hong Li at the China Agricul-tural University for helpful discussions of this work.
Author Contributions
Conceived and designed the experiments: ZZ YZ MMH. Performed the experiments: MMH XL. Analyzed the data: MMH YZ XL JL JS ZZ. Wrote the paper: MMH YZ JL JS ZZ.
References
1. Liao S, Shang Q, Zhang X, Zhang J, Xu C, Tu X. Pup, a prokaryotic ubiquitin-like protein, is an intrinsi-cally disordered protein. The Biochemical journal. 2009; 422(2):207–15. Epub 2009/07/08. doi:10.
1042/BJ20090738PMID:19580545.
2. Chen X, Solomon WC, Kang Y, Cerda-Maira F, Darwin KH, Walters KJ. Prokaryotic ubiquitin-like pro-tein pup is intrinsically disordered. Journal of molecular biology. 2009; 392(1):208–17. Epub 2009/07/
18. doi:10.1016/j.jmb.2009.07.018PMID:19607839; PubMed Central PMCID: PMC2734869. 3. Burns KE, Darwin KH. Pupylation: A signal for proteasomal degradation inMycobacterium
tuberculo-sis. Sub-cellular biochemistry. 2010; 54:149–57. doi:10.1007/978-1-4419-6676-6_12PMID:
21222280.
4. DeMartino GN. PUPylation: something old, something new, something borrowed, something Glu. Trends in biochemical sciences. 2009; 34(4):155–8. doi:10.1016/j.tibs.2008.12.005PMID:19282181.
5. Pearce MJ, Mintseris J, Ferreyra J, Gygi SP, Darwin KH. Ubiquitin-like protein involved in the protea-some pathway ofMycobacterium tuberculosis. Science. 2008; 322(5904):1104–7. Epub 2008/10/04.
doi:10.1126/science.1163885PMID:18832610; PubMed Central PMCID: PMC2698935.
6. Etlinger JD, Goldberg AL. A soluble ATP-dependent proteolytic system responsible for the degradation of abnormal proteins in reticulocytes. Proceedings of the National Academy of Sciences of the United States of America. 1977; 74(1):54–8. PMID:264694; PubMed Central PMCID: PMC393195.
7. Burns KE, Darwin KH. Pupylation versus ubiquitylation: tagging for proteasome-dependent degrada-tion. Cellular microbiology. 2010; 12(4):424–31. doi:10.1111/j.1462-5822.2010.01447.xPMID:
20109157; PubMed Central PMCID: PMC3647454.
8. Ikeda F, Dikic I. Atypical ubiquitin chains: new molecular signals. 'Protein Modifications: Beyond the Usual Suspects' review series. EMBO reports. 2008; 9(6):536–42. doi:10.1038/embor.2008.93PMID:
18516089; PubMed Central PMCID: PMC2427391.
9. Iyer LM, Burroughs AM, Aravind L. Unraveling the biochemistry and provenance of pupylation: a pro-karyotic analog of ubiquitination. Biology direct. 2008; 3:45. Epub 2008/11/05. doi: 10.1186/1745-6150-3-45PMID:18980670; PubMed Central PMCID: PMC2588565.
10. Kraut DA, Matouschek A. Pup grows up: in vitro characterization of the degradation of pupylated pro-teins. The EMBO journal. 2010; 29(7):1163–4. doi:10.1038/emboj.2010.40PMID:20372178; PubMed
Central PMCID: PMC2857470.
11. Imkamp F, Striebel F, Sutter M, Ozcelik D, Zimmermann N, Sander P, et al. Dop functions as a depupy-lase in the prokaryotic ubiquitin-like modification pathway. EMBO reports. 2010; 11(10):791–7. doi:10.
1038/embor.2010.119PMID:20798673; PubMed Central PMCID: PMC2948181.
Mpa. FEBS letters. 2009; 583(19):3151–7. Epub 2009/09/19. doi:10.1016/j.febslet.2009.09.020PMID:
19761766.
13. Goldberg AL. Nobel committee tags ubiquitin for distinction. Neuron. 2005; 45(3):339–44. Epub 2005/
02/08. doi:10.1016/j.neuron.2005.01.019PMID:15694320.
14. Yun HY, Tamura N, Tamura T.Rhodococcusprokaryotic ubiquitin-like protein (Pup) is degraded by de-aminase of pup (Dop). Bioscience, biotechnology, and biochemistry. 2012; 76(10):1959–66. Epub
2012/10/11. doi:10.1271/bbb.120458PMID:23047115.
15. Striebel F, Imkamp F, Sutter M, Steiner M, Mamedov A, Weber-Ban E. Bacterial ubiquitin-like modifier Pup is deamidated and conjugated to substrates by distinct but homologous enzymes. Nature structural & molecular biology. 2009; 16(6):647–51. Epub 2009/05/19. doi:10.1038/nsmb.1597PMID:
19448618.
16. Sutter M, Damberger FF, Imkamp F, Allain FH, Weber-Ban E. Prokaryotic ubiquitin-like protein (Pup) is coupled to substrates via the side chain of its C-terminal glutamate. Journal of the American Chemical Society. 2010; 132(16):5610–2. Epub 2010/04/02. doi:10.1021/ja910546xPMID:20355727.
17. Guth E, Thommen M, Weber-Ban E. Mycobacterial ubiquitin-like protein ligase PafA follows a two-step reaction pathway with a phosphorylated pup intermediate. The Journal of biological chemistry. 2011; 286(6):4412–9. Epub 2010/11/18. doi:10.1074/jbc.M110.189282PMID:21081505; PubMed Central
PMCID: PMC3039397.
18. Striebel F, Imkamp F, Ozcelik D, Weber-Ban E. Pupylation as a signal for proteasomal degradation in bacteria. Biochimica et biophysica acta. 2014; 1843(1):103–13. Epub 2013/04/06. doi:10.1016/j.
bbamcr.2013.03.022PMID:23557784.
19. Barandun J, Delley CL, Weber-Ban E. The pupylation pathway and its role in mycobacteria. BMC biolo-gy. 2012; 10:95. Epub 2012/12/04. doi:10.1186/1741-7007-10-95PMID:23198822; PubMed Central PMCID: PMC3511204.
20. Elharar Y, Roth Z, Hermelin I, Moon A, Peretz G, Shenkerman Y, et al. Survival of mycobacteria de-pends on proteasome-mediated amino acid recycling under nutrient limitation. The EMBO journal. 2014; 33(16):1802–14. Epub 2014/07/06. doi:10.15252/embj.201387076PMID:24986881.
21. Darwin KH. Prokaryotic ubiquitin-like protein (Pup), proteasomes and pathogenesis. Nature reviews Mi-crobiology. 2009; 7(7):485–91. Epub 2009/06/02. doi:10.1038/nrmicro2148PMID:19483713; PubMed
Central PMCID: PMC3662484.
22. Salgame P. PUPylation provides the punch asMycobacterium tuberculosisbattles the host macro-phage. Cell host & microbe. 2008; 4(5):415–6. Epub 2008/11/11. doi:10.1016/j.chom.2008.10.009
PMID:18996341; PubMed Central PMCID: PMC3202434.
23. Cerda-Maira FA, McAllister F, Bode NJ, Burns KE, Gygi SP, Darwin KH. Reconstitution of the Myco-bacterium tuberculosispupylation pathway inEscherichia coli. EMBO reports. 2011; 12(8):863–70.
Epub 2011/07/09. doi:10.1038/embor.2011.109PMID:21738222; PubMed Central PMCID: PMC3147258.
24. Festa RA, McAllister F, Pearce MJ, Mintseris J, Burns KE, Gygi SP, et al. Prokaryotic ubiquitin-like pro-tein (Pup) proteome ofMycobacterium tuberculosis. PloS one. 2010; 5(1):e8589. Epub 2010/01/13. doi:10.1371/journal.pone.0008589PMID:20066036; PubMed Central PMCID: PMC2797603. 25. Kuberl A, Franzel B, Eggeling L, Polen T, Wolters DA, Bott M. Pupylated proteins inCorynebacterium
glutamicumrevealed by MudPIT analysis. Proteomics. 2014; 14(12):1531–42. Epub 2014/04/17. doi:
10.1002/pmic.201300531PMID:24737727.
26. Watrous J, Burns K, Liu WT, Patel A, Hook V, Bafna V, et al. Expansion of the mycobacterial "PUPy-lome". Molecular bioSystems. 2010; 6(2):376–85. Epub 2010/01/23. doi:10.1039/b916104jPMID:
20094657; PubMed Central PMCID: PMC2846642.
27. Poulsen C, Akhter Y, Jeon AH, Schmitt-Ulms G, Meyer HE, Stefanski A, et al. Proteome-wide identifica-tion of mycobacterial pupylaidentifica-tion targets. Molecular systems biology. 2010; 6:386. Epub 2010/07/16. doi:10.1038/msb.2010.39PMID:20631680; PubMed Central PMCID: PMC2925521.
28. Zhao X, Dai J, Ning Q, Ma Z, Yin M, Sun P. Position-specific analysis and prediction of protein pupyla-tion sites based on multiple features. BioMed research internapupyla-tional. 2013; 2013:109549. Epub 2013/ 09/26. doi:10.1155/2013/109549PMID:24066285; PubMed Central PMCID: PMC3770009.
29. Tung CW. Prediction of pupylation sites using the composition ofk-spaced amino acid pairs. Journal of theoretical biology. 2013; 336:11–7. Epub 2013/07/23. doi:10.1016/j.jtbi.2013.07.009PMID:
23871866.
30. Liu Z, Ma Q, Cao J, Gao X, Ren J, Xue Y. GPS-PUP: computational prediction of pupylation sites in pro-karyotic proteins. Molecular bioSystems. 2011; 7(10):2737–40. Epub 2011/08/19. doi:10.1039/
31. Chen X, Qiu JD, Shi SP, Suo SB, Liang RP. Systematic analysis and prediction of pupylation sites in prokaryotic proteins. PloS one. 2013; 8(9):e74002. Epub 2013/09/11. doi:10.1371/journal.pone. 0074002PMID:24019945; PubMed Central PMCID: PMC3760804.
32. Tung CW. PupDB: a database of pupylated proteins. BMC bioinformatics. 2012; 13:40. Epub 2012/03/ 20. doi:10.1186/1471-2105-13-40PMID:22424087; PubMed Central PMCID: PMC3314583. 33. Chen K, Kurgan LA, Ruan J. Prediction of flexible/rigid regions from protein sequences usingk-spaced
amino acid pairs. BMC structural biology. 2007; 7:25. Epub 2007/04/18. doi:10.1186/1472-6807-7-25 PMID:17437643; PubMed Central PMCID: PMC1863424.
34. Chen YZ, Tang YR, Sheng ZY, Zhang Z. Prediction of mucin-type O-glycosylation sites in mammalian proteins using the composition ofk-spaced amino acid pairs. BMC bioinformatics. 2008; 9:101. Epub 2008/02/20. doi:10.1186/1471-2105-9-101PMID:18282281; PubMed Central PMCID: PMC2335299. 35. Chen Z, Chen YZ, Wang XF, Wang C, Yan RX, Zhang Z. Prediction of ubiquitination sites by using the
composition ofk-spaced amino acid pairs. PloS one. 2011; 6(7):e22930. Epub 2011/08/11. doi:10. 1371/journal.pone.0022930PMID:21829559; PubMed Central PMCID: PMC3146527.
36. Wang XB, Wu LY, Wang YC, Deng NY. Prediction of palmitoylation sites using the composition ofk -spaced amino acid pairs. Protein engineering, design & selection: PEDS. 2009; 22(11):707–12. Epub
2009/09/29. doi:10.1093/protein/gzp055PMID:19783671.
37. Zhang W, Xu X, Yin M, Luo N, Zhang J, Wang J. Prediction of methylation sites using the composition ofK-spaced amino acid pairs. Protein and peptide letters. 2013; 20(8):911–7. Epub 2013/01/02. PMID:
23276225.
38. Zhao X, Zhang W, Xu X, Ma Z, Yin M. Prediction of protein phosphorylation sites by using the composi-tion ofk-spaced amino acid pairs. PloS one. 2012; 7(10):e46302. Epub 2012/10/31. doi:10.1371/ journal.pone.0046302PMID:23110047; PubMed Central PMCID: PMC3478286.
39. Chen K, Jiang Y, Du L, Kurgan L. Prediction of integral membrane protein type by collocated hydropho-bic amino acid pairs. Journal of computational chemistry. 2009; 30(1):163–72. Epub 2008/06/21. doi:
10.1002/jcc.21053PMID:18567007.
40. Dong X, Zhang YJ, Zhang Z. Using weakly conserved motifs hidden in secretion signals to identify type-III effectors from bacterial pathogen genomes. PloS one. 2013; 8(2):e56632. Epub 2013/02/26. doi:10.1371/journal.pone.0056632PMID:23437191; PubMed Central PMCID: PMC3577856. 41. Weinert BT, Wagner SA, Horn H, Henriksen P, Liu WR, Olsen JV, et al. Proteome-wide mapping of the
Drosophilaacetylome demonstrates a high degree of conservation of lysine acetylation. Science sig-naling. 2011; 4(183):ra48. Epub 2011/07/28. doi:10.1126/scisignal.2001902PMID:21791702. 42. Zhou Y, Liu S, Song J, Zhang Z. Structural propensities of human ubiquitination sites: accessibility,
cen-trality and local conformation. PloS one. 2013; 8(12):e83167. Epub 2013/12/19. doi:10.1371/journal. pone.0083167PMID:24349449; PubMed Central PMCID: PMC3859641.
43. Yan RX, Si JN, Wang C, Zhang Z. DescFold: a web server for protein fold recognition. BMC bioinfor-matics. 2009; 10:416. Epub 2009/12/17. doi:10.1186/1471-2105-10-416PMID:20003426; PubMed Central PMCID: PMC2803855.
44. Song J, Tan H, Shen H, Mahmood K, Boyd SE, Webb GI, et al. Cascleave: towards more accurate pre-diction of caspase substrate cleavage sites. Bioinformatics. 2010; 26(6):752–60. Epub 2010/02/05. doi:
10.1093/bioinformatics/btq043PMID:20130033.
45. Si JN, Yan RX, Wang C, Zhang Z, Su XD. TIM-Finder: a new method for identifying TIM-barrel proteins. BMC structural biology. 2009; 9:73. Epub 2009/12/17. doi:10.1186/1472-6807-9-73PMID:20003393; PubMed Central PMCID: PMC2803183.
46. Chen Z, Zhou Y, Zhang Z, Song J. Towards more accurate prediction of ubiquitination sites: a compre-hensive review of current methods, tools and features. Briefings in bioinformatics. 2014. Epub 2014/09/ 13. doi:10.1093/bib/bbu031PMID:25212598.
47. Chen Z, Zhou Y, Song J, Zhang Z. hCKSAAP_UbSite: improved prediction of human ubiquitination sites by exploiting amino acid pattern and properties. Biochimica et biophysica acta. 2013; 1834 (8):1461–7. Epub 2013/04/23. doi:10.1016/j.bbapap.2013.04.006PMID:23603789.
48. Wang M, Zhao XM, Tan H, Akutsu T, Whisstock JC, Song J. Cascleave 2.0, a new approach for predict-ing caspase and granzyme cleavage targets. Bioinformatics. 2014; 30(1):71–80. Epub 2013/10/24. doi:
10.1093/bioinformatics/btt603PMID:24149049.
49. Chang CC, Lin CJ. LIBSVM: A Library for Support Vector Machines. ACM transactions on intelligent systems and technology2011; 2(3). doi: Artn 27 doi:10.1145/1961189.1961199PMID:
ISI:000208617000010.
50. Gribskov M, Robinson NL. Use of receiver operating characteristic (ROC) analysis to evaluate se-quence matching. Computers & chemistry. 1996; 20(1):25–33. doi:10.1016/S0097-8485(96)80004-0
51. Centor RM. Signal detectability—the use of ROC curves and their analyses. Medical decision making.
1991; 11(2):102–6. doi:10.1177/0272989x9101100205PMID:ISI:A1991FF53200005.
52. Provost F. Machine learning from imbalanced data sets 101. AAAI Workshop on learning from imbal-anced data set. 2000:1–3.
53. Lin C-J CY-W. Combining SVMs with various feature selection strategies. NIPS 2003 feature selection challenge. 2003:1–10.
54. Shi SP, Qiu JD, Sun XY, Suo SB, Huang SY, Liang RP. PLMLA: prediction of lysine methylation and ly-sine acetylation by combining multiple features. Molecular bioSystems. 2012; 8(5):1520–7. Epub 2012/
03/10. doi:10.1039/c2mb05502cPMID:22402705.
55. Li Y, Wang M, Wang H, Tan H, Zhang Z, Webb GI, et al. Accuratein silicoidentification of species-spe-cific acetylation sites by integrating protein sequence-derived and functional features. Scientific reports. 2014; 4:5765. Epub 2014/07/22. doi:10.1038/srep05765PMID:25042424; PubMed Central PMCID: PMC4104576.
56. Vacic V, Iakoucheva LM, Radivojac P. Two Sample Logo: a graphical representation of the differences between two sets of sequence alignments. Bioinformatics. 2006; 22(12):1536–7. Epub 2006/04/25.