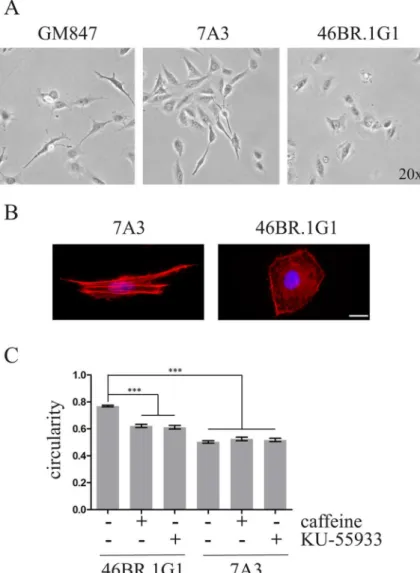
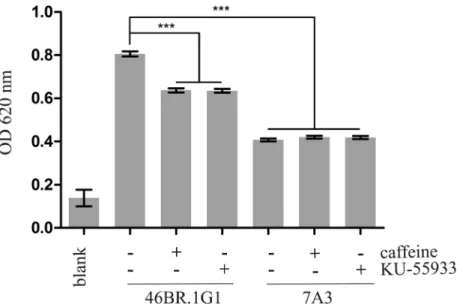
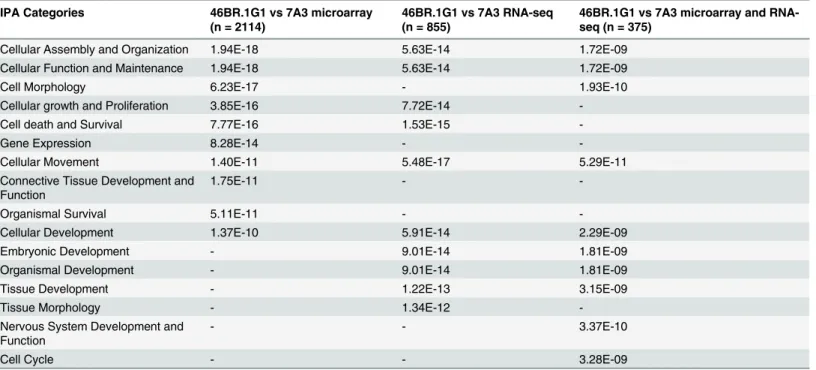
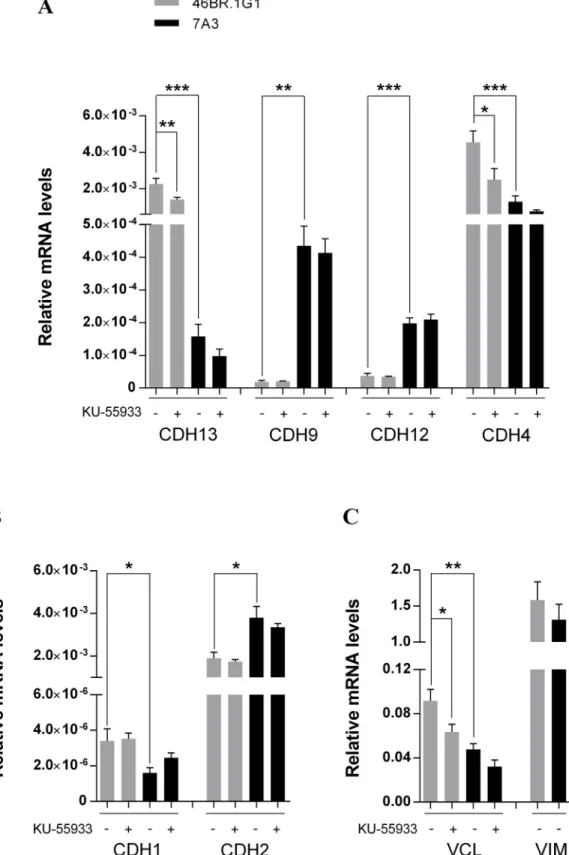
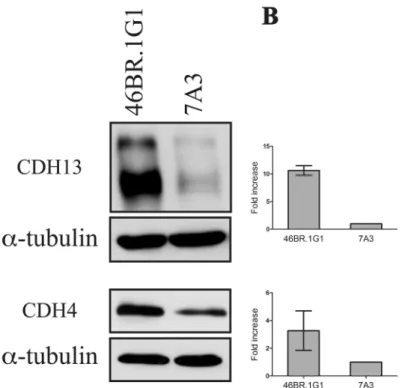
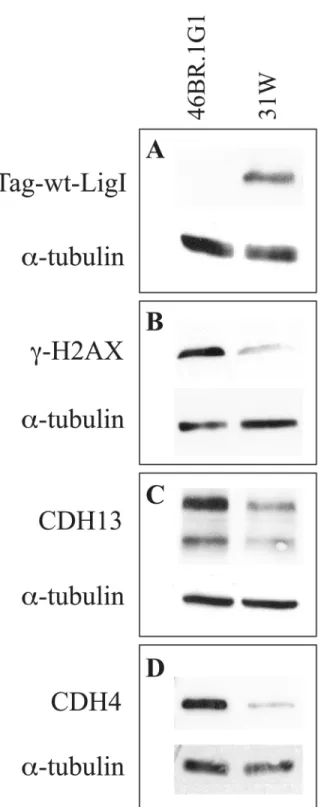
Chronic Replication Problems Impact Cell Morphology and Adhesion of DNA Ligase I Defective Cells.
Texto
Imagem

Documentos relacionados
The probability of attending school four our group of interest in this region increased by 6.5 percentage points after the expansion of the Bolsa Família program in 2007 and
Periodic expression o f nuclear and m itochondrial DNA replication genes during the trypanosom atid cell
3- Transcript levels of some important genes that regulate Ran regulation, transition and termination of DNA replication, chromosome condensation in prometaphase
miR-30c signi fi cantly inhibited HBV replication and the expressions of HBV pgRNA, capsid-associated virus DNA and Hbx in hepatoma cells, as well as suppressed cell proliferation
Collectively, the above results demonstrate that while over-expression of K13 effectively blocks lytic replication-induced cell death by inhibiting the induction of RTA-target
Previous works have shown that: 1)- b -lactam antibiotics that target the transpeptidase domain of PBP3 (ceftazidime) and do not directly damage DNA or affect replication in E.coli
DNA microarray analysis showed enhanced expression of WNT10A, and our subsequent study revealed that WNT10A stimulates the growth of both microvascular endothelial cells and
Regulation of herpes simplex virus type 1 replication in Vero cells by Psychotria serpens : relationship to gene expression, DNA replication, and protein
