Environmental Effects of Driving Automobiles in the
University of Malaya Campus: A Pilot Study
S.Y. Kong, Aniza Abdul Aziz, S.P. Rao and Nila Inangda
Department of Architecture, Faculty of Built Environment, University of Malaya, 50603 Kuala Lumpur, Malaysia, [email protected]
Abstract
With the increase of human population there has been an evident increase in per capita automobile use and ownership, significantly to a point that almost every urban university campus faces serious challenges from the heavy traffic movement as well as the associated parking shortages. Multiple factors, including lack of land for new parking lots, high cost of building parking structures and the desire to preserve the air quality and campus green spaces are leading many educational institutions towards a new vision based upon expanded transit access, better bicycle and pedestrian facilities and financial incentives for students and staff to drive less. (Toor and Havlick, 2004) This is in stark contrast to the traditional approach to campus transportation planning of the University of Malaya (UM), Kuala Lumpur, Malaysia that allows students, staff and visitors to drive in the campus.
The objective of this study is to investigate the related issues and environmental impact of allowing automobile driving in the campus. Studies will also be done to analyse the relationship between university campus planning and traffic condition. Air quality and noise pollution data of 3 selected sites in the campus will be recorded. Subsequently, the air pollutant index and noise pollution level will be identified and data analyses will be done on the data samples. Simultaneously, a survey questionnaire will be conducted to gauge the student’s attitude and degree of awareness with air and noise pollution in the campus. This pilot study reveals that the increasing use of automobiles within the campus has a negative impact on local environment and the quality of life in campus.
Keywords: Campus environment, Pollution, Parking shortages, University planning, automobile traffic
Introduction
The growth of motorisation is reflected in the ever increasing traffic in the streets, the ever lengthening rows of cars parked along the roads, and the ever greater congestion of the car parks space.
Automobile transportation depends on the supply of petroleum products
possibilities of creating ecological or sustainable city that uses fewer automobiles for their transportation.
The University of Malaya (UM) is strategically located n the heart of Kuala Lumpur. Although there are various modes of public transport within the city and in the campus, the most common mode of transport among the students is still the automotive transportation. With the increasing number of students each year, there is a driving force to increase the number of car parks within the campus. The car dependant attitude of the students is much related to the policy of the university that allows students to drive within the campus. This may lead to further problems when the students graduated and become the leaders and decision makers of the country.
Most of the students drive within the campus due to the limited public transportation. The bus service is not regular in the campus. Students also refuse to walk under the hot sun as there is not enough covered walkway or shaded trees. Some of the students drive to the campus for safety reason as their class normally finishes late in the evenings.
However, multiple factors - including lack of land for new parking lots, the high cost of building parking structures, and the desire to preserve air quality and campus green spaces-are leading many institutions nowadays towards a new vision based upon expanded transit access, better bicycle and pedestrian facilities and financial incentives for students, faculty and staff to drive less. This is a stark contrast to the traditional approach to campus transportation planning of the universities which tend to assume that the primary solution to
increased demand is to build new parking spaces. According to the latest statistics by UM security office, there is still a serious shortage of car parks within the campus although the total number of car park space has been increased to about 5100. Insufficient car parking space may lead to the loss of green spaces through the construction of new parking structures in the future.
Campus Air Quality and Traffic
The concentration of pollutants emitted from vehicles exhausts will depends on the driving mode (Maccarrone, 1986). In general, as the average speed increases, emissions increase for Nitrogen Oxide (NOx) and decrease for Carbon monoxide (CO) and Hydrogen chloride (HCl). Hickman (1976) indicates that the CO concentration was found to be higher at locations which have access to an elevated ring road, and a set of traffic lights compared to other locations with a free flow of traffic. The reason is that vehicles spend longer time near junctions due to queuing and the acceleration and deceleration phase they go through are more polluting than steady speed cruising. Phase periods of idling mode increases emissions of all pollutants (Zellner and Mousiopoulos, 1989).
freeways with two to three times higher traffic volumes. The study has also shown that CO concentrations measured in the queue zone at the intersections can be attributed to the high rate of CO emissions from idling engines of vehicles stopping during red traffic signal cycle and reduced dispersion due to lack of traffic generate turbulence.
The nature of surrounding buildings has been found to be influencing the traffic pollutants (Hickman, 1973). The buildings and structures affect the pollutant concentration. These have been discussed by Hassan et al., (1998a, 1998b) and Hongchang et al., (2001). Study by Hongchang et al., (2001) gave some input on how the concentration level of pollutant is difficult to predict due to complex dispersion processes near high-rise buildings. The impact of air pollution on the environment has become an important research issues, leading to numerous simulation studies related to the influence of buildings and other structures on pollutant accumulation and dissipation pattern (Sotiris et al., 2003).
Promoting Non-Motorised Transportation
There are benefits of promoting non-motorised transportation in campuses. The primary reasons to encourage walking and cycling include cost savings to institutions, student’s health, safety benefits and environmental benefits.
Universities such as University of Washington and University of British Columbia have pioneered innovations in facilities that support non-motorised
transportation, in fact many universities in Canada and United States nowadays have banned cars from campus. Campus communities in these universities are well-suited for high levels of walking and cycling due to the short distance of many trips and the age and ability of student populations ( Toor and Havlick, 2004).
Non-motorised transportation has significant health benefits. Obesity among young people and adults has become a serious problem. In the last few years, health researchers have begun to look closely at the link between land use, transportation choices and health (Will Toor and Havlick, 2004). Surveys done by Toor have indicated that people who have easy access to pedestrian walkways are much more likely to be physically active.
Walking to campus is one of the most common forms of transportation, especially among students whose housing is clustered within a mile (Toor and Havlick, 2004). Distance and the time involved traversing is certainly a major reason why more students do not choose this simple and healthy form of transportation. Another factor many students cite is the lack of safe & convenient access to their destination. Often lack of aesthetic interest contributes to a hostile pedestrian environment.
general recreation and exercise purposes. Some of the reasons they are so widely used in Europe is because they are quick, energy efficient, relatively inexpensive, pollution free and their use contributes to a reduction in automobile traffic.
Research Methodology
In order to achieve the objectives of this research, studies have been conducted within the university campus. The methodology of this research comprises of 4 strategies:
• Library and online research
Data has been collected from several libraries in the UM, internet websites and online journals. Literature review was done to provide the basic picture and information about the campus transportation and the impacts assessments
.
• Site observation and pilot study Site visit to a few areas in the campus is done to observe and evaluate the outdoor air quality and level of noise pollution. Three sites are selected for environmental impact assessment.
• Collection of data
1. The field study is carried out through site investigations to collect the objective and subjective data:
• Outdoor Air Quality:
Measurement of the concentration of CO2 and CO in parts per million (ppm.)
• Noise Pollution: Measurement of the sound generated by the passing vehicles in dB
2. Checklist to describe impacts and provide some measurements and predictions
3. Total of 150 Survey Questionnaires are distributed to the students (100% feedback).
4. Interviews with the students and policy maker
5. Counting of the cars to reflect the traffic condition at two busiest gates of the university
6. Five year traffic and car park statistics from the UM Security Office
• Analysis and discussions
The documentation of this research was carried simultaneously with data collecting stage. Analysis will be done based on the collected data and feedback from the questionnaires.
Preliminary study of the three selected sites includes a series of walk-through appraisals of the air quality and noise pollution level. The traffic conditions of the three sites were analysed by means of site observations and by studying the existing campus planning and land use.
increased use of automobile within campus. The measurement and survey were done in three consecutive days. The collected CO data will be converted into index value using the equation below:
CO concentration
Index Value = x 100
CO goal concentration 9 ppm The index value will then be compared with the Malaysia Air Quality Index rating system.
Air Pollutant Rating Index (API)
0-50 Good
51-100 Moderate
101-200 Unhealthy
201-300 Very Unhealthy
301-500 Hazardous
>500 Emergency
Table 1: Malaysia Air Quality Index
(Source: Department of Environment, Ministry of Natural Resources and Environment)
Results and Analysis
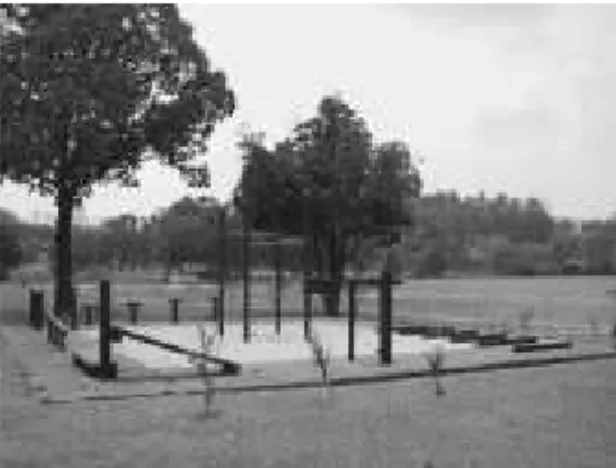
Site 01: Varsity Green
The first selected site is the recreation area adjacent to the main road called Varsity Green. The site was chosen because the location is only 3 minutes walk from the main gate, along the busy main road with the first bus stop and the university’s bus terminal opposite the road. Survey questionnaires will reveal the student’s opinion on exercising in a field that possibly is disturbed by noise pollution and poor air quality.
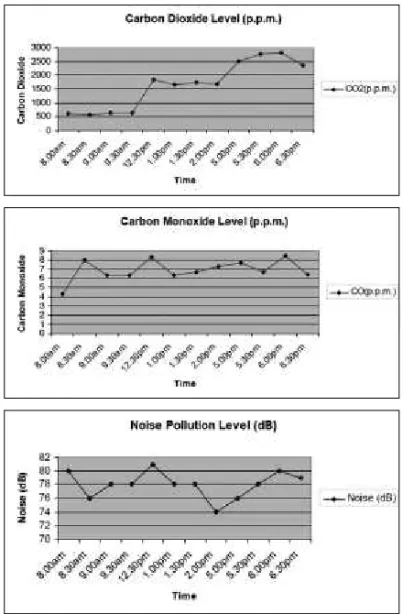
From the data collected, the air quality of Site 01 can still achieve an acceptable or moderate level even during peak hours. The fact that the site is an open site with a lot of big trees and greenery helps to improve the air quality. Trees utilized CO2 to conduct photosynthesis. 90% of the survey questionnaires respondents agreed that they are comfortable with the air quality at Varsity Green.
The air quality is best in the morning before 8.30am where there is only minimum use of motor vehicles. Respondents (interviewed between 8am and 9am) rated the air quality as 4.2/5. The air quality worsened after 8.30am as there are approximately 800 motor vehicles passing by the main road within an hour. However, due to the lush greenery in Varsity Green, only 5% of the respondents complained that they experienced discomforts when walking next to the main road.
On the other hand, the noise pollution at Varsity Green is not satisfactory. The vehicles are accelerating along the main road and the engines create heavy noise pollution. 42% of respondents are not
Figure 1: Recreation area adjacent to the
comfortable with the noise pollution level, especially for those who are doing exercise and recreation activities. The noise pollution can reach more than 80 dB during peak hours. Noise of 80 dB is equivalent to being in a noisy high street corner (Branch and Beland, 1970). An ideal place for recreation activity should have noise limited within the range of 40-50 dB. The busy main road has disturbed the recreation activities in Varsity Green.
Figure 2: Results at Site 01
Figure 3: Main drop-off of Faculty of
Science is facing the busiest junction in the campus.
The main drop-off at Faculty of Science is directly facing the busiest junction in the campus. There are classes located next to the junction and a few open study areas facing the junction. The environmental impact assessment and survey questionnaires will help to determine whether the pollution and noise generated will affect the health and concentration of the students at the open study areas.
From the data collected, the air quality of Site 02 is considered not satisfactory during the peak hours. Claggett (1991), have observed that
pollution concentrations are higher near traffic junctions, where queuing occurs, than at the intermediate links. The data collected in this study supports Claggett’s statement and shows that CO concentrations measured in the queue zone can be attributed to the high rate of CO emissions from idling engines of stopping vehicles. 55% of the students being interviewed think that the air quality needs to be improved.
The noise pollution also creates problems for students who utilised the outdoor study area. The respondents rated 2.7/5 for the comfort level of studying
next to the main road. The noise from the traffic is the main disturbance to the students.
A good study environment should have noise pollution level less than 60 dB (Branch and Beland, 1970). The data collected shows that the noise from the traffic often exceeds 70 dB in the peak hours. Noise of 70 dB is equivalent to the sound generated by a vacuum cleaner which may be very disturbing to students who are reading or studying next to the busy main road.
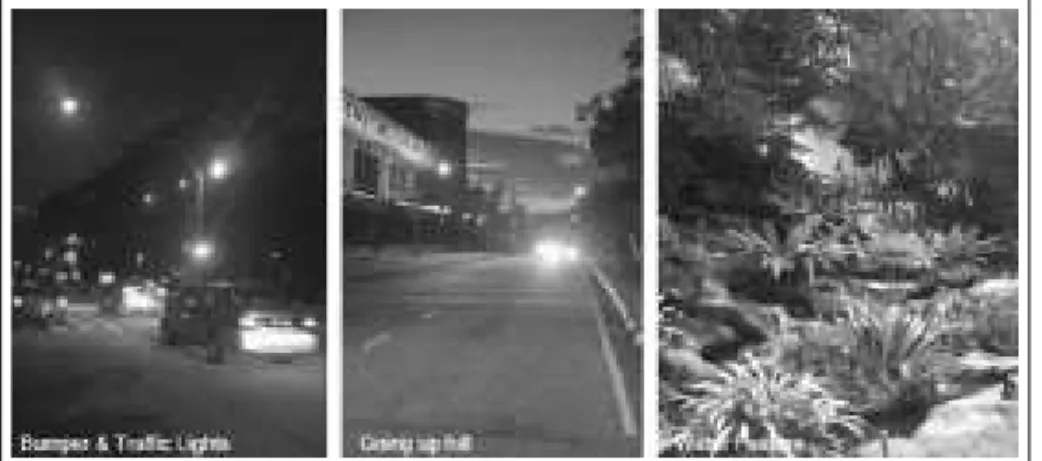
Site 03: Tunku Canselor Hall (DTC)
Site 03 has been chosen for environmental impact assessment because of the presence of road bumper to slow down traffic, traffic light, hilly terrain and water feature. The water feature near to Tunku Canselor Hall is located directly next to the main road at the traffic light.
Data of air quality and noise pollution level collected from this spot will help to determine whether the presence of water element and sounds of running water will improve the air quality while simultaneously minimizing the sound pollution.
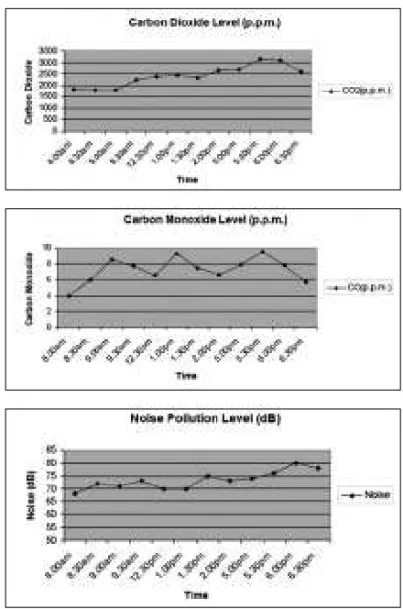
From the data collected, the air quality of Site 03 is considered as bad as Site 2 especially during peak hours where temporary traffic jam occurs. But surprisingly, only 48% of the respondents think that the air quality is bad. The remaining 52% of the respondents think that the air quality is at an acceptable level. This may due to the present of a water feature at Site 03. Although the water feature does not contribute to the improvement of air quality on site, but the sounds of flowing water does give a calming effect to the passing-by pedestrian. The water feature has given a psychological effect to the pedestrian’s perception on the air quality. The present of bumper and traffic lights force vehicles to queue, decelerate or accelerate near to Site 03 which generate more pollutants to the air.
70% of the respondents (interviewed between 8am and 5pm) think that the noise pollution is at an acceptable level although they are walking next to a busy main road. The ‘sound masking’ effect by using the flowing water may explain this phenomenon. Sound masking is the addition of natural or artificial sound into an environment to cover-up unwanted
Figure 5: Present of road bumper, traffic lights, hilly terrain and water
The noise and air pollution are worst after the office hour. With the increased use of motor vehicles within the campus, temporary traffic jam that last for approximately 1.5 hours (from 5pm to 6.30pm) occurs at the main road in front of DTC that leads to the KL Gate. 86% of the respondents (interviewed from 5pm to 6.30pm) agreed that the noise and air pollution are at a very uncomfortable level. Some of the respondents experienced eye irritation, noticeable
Figure 6: Results at Site 03.
odours and sneering when they walk beside the main road during the traffic congestion. The noise from idling engine of a heavy vehicle passing by the main road can reach up to 85 dB. The noise of 85 dB is equivalent to the sound generated by a milling machine.
Comparison Study
The air quality of the three selected sites is different. The present of greenery, traffic condition and water element are some of the factors that will affect the outdoor air quality. Comparison study of the three selected sites will provide a basic understanding on the factors that influence the environmental quality in the campus.
The noise pollution level of the three sites will also be compared in terms of road noise generated by the traffic. “Road noise” is defined as the superposition of sound energy emanating from cars, motorcycles and heavy vehicles (Heimann, 2007). This emission can generally be associated with two physical phenomena of mechanical origin: the first one is linked to the engine-exhaust chain; the second one is due to the mechanical contact between tyres and the road (Franceschi, 2007). Depending on the speed and the kind of vehicle, motor noise and tyre-road noise compete: for light vehicles, it is considered that above 50 km/h tyre-noise dominates, whereas the limit is between 50 •80 km/h for heavy
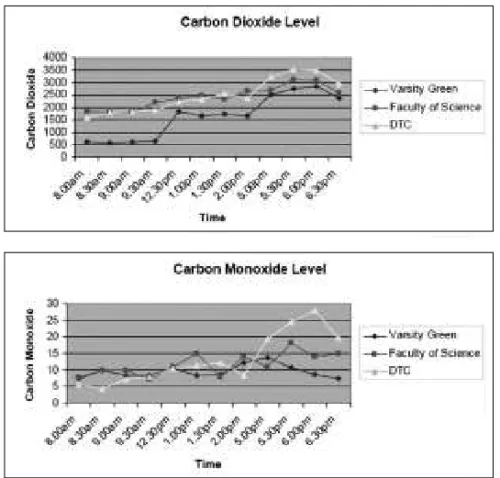
Figure 7: Comparison of CO and CO2 pollution levels at the three
vehicles (Lercher, 2007), below these limits motor noise is predominant.
The presence of vegetation helps tremendously in improving the campus air quality. The air quality data collected for Site 01 (Varsity Green) supports the statement. The rating for Air Pollutant Index (API) is between good and moderate. Varsity Green serves as the ‘green lung’ of University of Malaya Campus. Trees and various flora help to reduce the carbon based pollutants in the air.
The air quality in Site 02 is affected by the pollutants from motor vehicles
emissions. The main drop off at the science faculty is directly facing the junction where vehicles will stop. The rating for Air Pollutant Index (API) is between moderate and unhealthy. Compare to Site 01, Site 02 has considerably higher min value of carbon dioxide and carbon monoxide concentration. This is because vehicles in Site 02 spend longer time near junctions while queuing, decelerating or accelerating which generate more pollutants than during the steady cruise. The main road adjacent to Site 01 is relatively straight for a stretch of few
hundred meters where vehicles do not stop for queuing.
Air quality of Site 03 (DTC) is considered the worst among the three selected sites because of the temporary traffic congestion that occurs during peak hours. The rating for Air Pollutant Index (API) is between moderate and very unhealthy. The present of water element at Site 03 does not contribute to the drastic improvement of air quality. In fact, the carbon dioxide and carbon monoxide concentration of Site 03 is generally higher compared to Site 01 and Site 02 at the same time throughout the day. The sound of running water does give a calming effect to the pedestrians. Survey questionnaire reveals that the sound of water helps to improve noise pollution while simultaneously make people perceive that the air quality is better.
The main source of noise pollution at the three selected sites is from the busy traffic. Site 01 (Varsity Green) and Site 03 (DTC) which are rather straight for a stretch of few meters are associated with the tyre-road noise. The average speed
for vehicles in Site 01 and Site 03 is above 50 km/h. The mechanical contact between tyres and road surfaces and the engine of vehicles which are accelerating will generate noise to the surroundings. All these factors have contributed to the noise pollution which disturbs the recreational activities in Site 01.
On the other hand, Site 02 which directly facing the main junction in campus is under the problem of motor noise from the vehicles. Unlike the tyre-road noise, the motor noise from engine is emitted when vehicles are stopping at junctions. The road noise of Site 02 is mainly caused by the fact that vehicles spend longer time near the junction. Queuing, decelerating or accelerating will make the engine emit noise to the surroundings.
Survey Results
The survey managed to gauge the student’s attitude and degree of awareness of air and noise pollution in campus. It
also reflects their willingness to participate in the sustainable campus transportation to reduce individual carbon footprint.
Private motor vehicle is still the main mode of transport for most of the survey respondents. Students that drive to campus normally live more than 5km from the campus due to limited on-campus student accommodation and scarcity of affordable housing off-campus. Most of the students living on-campus are willing to walk or cycle to their faculty everyday. Some students that live near to the LRT or bus station come to campus by public transportation to save money and travel time.
The survey also shows that most of the respondents are unable to perceive the benefits of non-motorised transportation. This may due to their ‘ecological distance’. They maybe cognitively
distanced from the ecosystem, so they don’t know which natural systems they consume and pollute and to what extent. Proper environmental education needs to be given to the students so that they may do their part in reducing their individual carbon footprint.
Most of the respondents do realised that the increase use of automobile in the campus will cause pollution and disturb the learning environment. Traffic congestion and car parking shortages will occur following the surge of campus vehicles. This will lead to the inevitable deterioration of quality living in campus. Insufficient car park may results in the loss of green spaces through construction of new parking structures.
The ‘compactness’ of the overall campus planning will determine the choice of students’ transportation. According to Toor (2004), good walking
distance is about 1 to 2 km, while cycling distance is about 1 to 5 km. The UM Campus is rather spread out with many destinations requiring trips longer than this, thus the campus population will prefer to use private vehicles for daily intra-campus trips.
The respondents highlighted a few factors of difficulty to promote non-motorised transportation within UM Campus. Firstly, most of the intra travel in UM campus between faculties or other facilities are beyond walking distance. Secondly, limited covered or shady pedestrian walkways deter the students from walking in the hot and humid climate. Thirdly, some of the respondents who have class until late evening think that walking or cycling will not be an option for them as it would raise safety issue. The policy makers might need to improve the pedestrian facilities and revise the campus planning to encourage more students to walk and cycle.
According to Toor (2004), the approaches to transportation that students learnt in university are likely to influence their future transportation choices. Results from survey shows that most of the respondents are planning to own private cars despite the rise of petrol price. Only minority of the respondents consider cycling or walking as an option for travelling to office in the future.
Conclusions
The data collected in this research reveals that the use of automobile will affect the campus learning environment. Motor vehicles also have a major negative impact on quality living in campus. The
measurement of air quality and road noise further justify that the air and noise pollution in the campus are related to the use of automobile.
The measurements done on Site 01 (Varsity Green) show that greenery and landscaping do contribute to the improvement of air quality. Unlike the air quality, the noise pollution level in Site 01 is considered bad due to the fact that motor vehicles are accelerating and moving fast along the road adjacent to Varsity Green. The noise pollution has disturbed the recreational activity in Varsity Green.
Data collected at Site 02 reveals that the pollutants concentrations are found to be higher at traffic junctions, where queuing occurs. Site 02 also has noise pollution problems where the road sound has disturb the study environment of the students.
The environmental condition of Site 03 is the worst among the three sites due to the road design and temporary traffic congestion during peak hours. However, the addition of artificial sound created by the cascading mini water fall functions both for sound masking and as a physical barrier to road noise. Most of the respondents have given positive feed back on the sound of flowing water. The water feature may change the psychological perception of the pedestrians on air quality and noise pollution but in reality, the water feature has not contributed to the improvement of air quality at Site 03.
as their travel distance is relatively short. This can help to reduce the student’s carbon footprint while at the same time improve their health.
Most of the respondents also agree walking or cycling under the rain or hot blazing sun would be the main problem of designing sustainable campus in the tropics. The addition of facilities that support walking and cycling may change the student’s perception about non-motorised transportation in the campus.
Policies and decisions made on transportation will affect the planning, appearance and feel of the campus. Decisions about parking will affect the amount of green space, the amount of impervious surface and the amount of land available for building. Besides making the right decisions and policies, it is vital for UM to have a thoughtful campus land-use planning that can foster travel patterns and enable a reduced number of trips and distance driven.
Most of the general architectural concepts which spilled over in the university design came from the work done in urban planning. There is a need for segregation between different forms of traffic and creation of pedestrian precincts in UM Campus by variation of the Radburn plan - feeding traffic laterally from a main route into cul-de-sacs with a traffic-free zone beyond. This can help to solve the current problem in Site 01 where the vehicles are circulating around Varsity Green continuously.
Most of the students live beyond walking / cycling distance from the campus leading from the scarcity of student housing in-campus. Motor vehicles become the main mode of transport for students living in outlying
areas that are not well-served by campus transport system. Almost 2000 vehicles per hour pass through KL and PJ Gate during the peak hours.
In general, people are willing to walk for trips under 1km and UM Campus is rather spread out with many destinations requiring trips longer than this, thus the campus population will use other modes for daily intra-campus trips.
There is a strong connection between transportation and land use planning. The volume of traffic generated within campus are largely affected by the various activity based on land use zoning & planning. Mitchell (1954) observed that the location pattern of the land uses is able to change the traffic at a particular site. In the early days, designers and planners of UM campus have clustered most of the student’s activities near Site 02 to increase the campus density, hoping to encourage more students to walk. Throughout the years, new faculties and student housings have been added, but at some distance away from the student’s activity cluster.
Future planning of new campuses and re-planning of existing campuses in the tropics should consider the ‘university in the garden’ concept and transportation mode of the staff and student within the campus to promote sustainable green campus.
References
Barrow, C.J., (1995) Developing the Environment: Problems and Management, Harlow, London.
Branch, Melville C. & Beland, R. Dale, 1970
environment; case study of Los Angeles, with special reference to aircraft, by Melville C. Branch, with R. Dale Beland, incorporating work by Mahendra N. Bora [and others] Introd.: Vern O. Knudsen
Dept. of City Planning, Los Angeles. Clagget, M., Shrock,J., Noll, E.K., (1991):
Carbon Monoxide Near an Urban Intersection, Atmospheric Environment, Vol. 15 no 7, 1633-1642
Gagnon, C., (1995) Social Impact Assessment in Quebec: Issues and Perspectives for
Sustainable Community Development,
Impact Assessment 13(3), 273-88. Gilpin, A., (1995) Environmental Impact
Assessment: Cutting Edge for the Twenty-First Century, Cambridge University Press, Cambridge.
Graham Smith, L., (1993) Impact Assessment
and Sustainable Resource Management,
Harlow, Longman.
Heer, J.E. & Hagerty, D.J., (1977)
Environmental Assessment and Statement, Van Nostrand Reinhold, New York. Heimann D., de Franceschi M., Emeis S.,
Lercher P., Seibert P. (Eds.) (2007), Air Pollution, Traffic Noise and Related Health Effects in the Alpine Space •A Guide for
Authorities and Consulters; ALPNAP
comprehensive report. Università degli Studi di Trento, Dipartimento di Ingegneria Civile Ambientale, Trento, Italy, 335 pp. Howitt, R., (1995) SIA: Sustainability and
Developmentalist Narratives of Resource Regions, Impact Assessment, 13(4), 387-402.
Klose, Dietrich, (1965) Multi-Storey Car Parks and Garages, The Architectural Press, London.
Hassan, A.A., Crowther, J.M. (1998), A Simple Model of Pollutant Concentrations in a Street Canyon, Environmental Monitoring and Assessment 52, 281-297.
Hassan, Hasnah, Singh, M.P., Gribben, R.J., Srivasta, L.M., Radojevic, M., Latif, Azhar.
(2000), Application of a Line Source Air Quality Model to the Study of Traffic Carbon Monoxide in Brunei Darussalam, ASEAN Journal on Science and Technology for Development, Vol 17 No.1, 59-76.
Hickman, A.J. (1973), Atmospheric Pollution from Vehicle Emissions: Measurements at Four Sites in Coventry, TRRL Laboratory Report 695, Department of the Environment.
Hickman, A.J., (1976). Atmospheric Pollution
Measurements in West London, TRRL
Laboratory Report 709, Department of the Environment.
Hongchang Zhao & Daniel Sperling, (2001)
Traffic Emission Pollution Sampling And Analysis On Urban Streets With High-rising Buildings, Transportation Research Part D: Transport and Environment, Vol. 6, Issue 4, 269-281.
Khairani Alladin @ Jalaludin, (1993)
Pengangkutan Darat: Kesannya terhadap Alam Sekitar-Kajian Kes di Kuala Lumpur, Dewan Bahasa dan Pustaka, Kuala Lumpur. Koo Son Tian, (2001) Kajian ke atas Perhubungan Pencemar Gas Karbon Monoksida dengan Bilangan Kenderaan di sebuah Persimpangan Berlampu Isyarat, MA Thesis, School of Civil Engineering, USM
Kozlowski, J.M., (1989) Integrating Ecological Thinking into the Planning Process: A
Comparison of EIA and UET Concepts,
WZR Paper, Berlin
Barrow, C.J., (1997) Environmental and Social Impact Assessment,Oxford Uni. Press Inc., NY
Maccarrone, A. (1989) Air Pollutant Levels Near Roads, Australia Road Research, 19(3), September 1989, 234-242.
Matzoros, A. (1992) A Model Of Air Pollution
From Road Traffic, Based On The
Transportation Research & Part II-Model Results, Vol.26A, No.4, 331-355, 315-330. Moseholm, L., Silva, J., Larson, T. (1996),
Forecasting Carbon Monoxide Concentration Using Video Traffic
Surveillance and Neural Network,
Transportation Research Part D1, Vol. 1, No 1, 15-28.
Muhammad Awang, Abdul Latif and Azman Zainal Abidin. (1988), Monitoring and Assessment of Kuala Lumpur Ambient Atmospheric Concentrations of CO, NOX, SO2 and its climatic Conditions Tropical
Urban Ecosystems Studies, Technical
Report Working Group on Urban Ecosystems Malaysian National MAB Committee.
Mohamad Tajuddin Mohamad Rasdi (2001),
Campus Design in Malaysia: Of
Motorcycles and Mediocrit, Dept of
Architecture, UTM
Mitchell, R.B., C. Rapkin. (1954), Urban Traffic: A Function of Land Use, Columbia University Press, New York
Nilsson, M.E., Andehn M., Lesna P.: Evaluating roadside noise barriers using an annoyance-reduction criterion , The Journal of the Acoustical Society of America December 2008, Issue 6, pp. 3561-3567 Noor Zaitun Yahaya. (2001), A Mathematical
Modeling of Relationship Between Traffic Volume and Pollutant Concentration Level (CO and SO2) on Urban Streets; A Case
study of Ipoh City, School of Civil
Engineering Saminar, USM, 21 September, 2001.
Noor Zaitun Yahaya & Ahmad Farhan Mohd Sadullah (2002), Atmospheric Pollution (CO) From Vehicle Emissions: A Comparison Between An Urban Freeway and Urban Intersection At Different
Surrounding, Proceedings Malaysian
Universities Transport Research Forum (MUTRF), UM, Kuala Lumpur, 22-23 October, 2002.
Noor Zaitun Yahaya, Sharifah Rosfashida Syed Abd. Latif, Ahmad Farhan Mohd Sadullah. (2003), Carbon Monoxide (CO) Emission Study from Motor Vehicles at Different
Urban Surroundings in Malaysia,
Proceedings Environment 2003 Conference, School of Chemical Engineering, USM, Penang, 18-19. February. 2003.
Rakowski, C.A., (1995) Evaluating a Social Impact Assessment: Short-term and Long Term Outcomes in a Developing Country, Society and Natural Resources 8(6), 525-40.
Sotiris V., Bernard E.A. Fisher, Koulis P., Norbert Gonzalez-Flesca. (2003),
Modelling Air quality In Street Canyons: A Review, Atmospheric Environment, No 37, 155-182
Toor, W. & Havlick S. W., (2004) Transportation and Sustainable Campus Communities: Issues, Examples, Solutions, Island Press, United States.
Walsh, M., J. Shah (1997), Clean Fuel for Asia, Technical Options for Moving toward unleaded Gasoline and Low-Sulphur Diesel, World Bank Technical Paper No 377.
Wong Wei Hoong (1992), Observations Of The Air Quality Of Selected Heavy Trafficked Areas In Kuala Lumpur, BSc. Thesis, UPM. Zellner K., Moussiopoulos N. (1989), Ozone formation from motor vehicle emissions: