Submitted1 April 2016
Accepted 8 September 2016
Published4 October 2016
Corresponding author
Jennifer C. Potts, jennifer.potts@noaa.gov
Academic editor
Karine Rousseau
Additional Information and Declarations can be found on page 14
DOI10.7717/peerj.2543
Distributed under
Creative Commons Public Domain Dedication
OPEN ACCESS
Age, growth, and natural mortality of
schoolmaster (Lutjanus apodus) from the
southeastern United States
Jennifer C. Potts, Michael L. Burton and Amanda R. Myers
NOAA National Marine Fisheries Service, Beaufort, NC, United States
ABSTRACT
Ages of schoolmaster (n=136) from the southeastern Florida coast from 1981–2015 were determined using sectioned sagittal otoliths. Opaque zones were annular, forming March–July (peaking in May–June). Schoolmaster ranged in age from 1–42 years; the largest fish measured 505 mm total length (TL) and was 19 years old. The oldest fish measured 440 mm TL. Estimated body size relationships for schoolmaster were:
W =9.26×10⁻⁶ TL3.11 (n=256,r2=0.95);W =2.13×10⁻⁵ FL2.99 (n=161,r2=
0.95); TL=1.03 FL+10.36 (n=143,r2=0.99); and FL=0.96 TL−8.41 (n=143,
r2=0.99), whereW =whole weight in g, FL=fork length in mm, and TL in mm. The fitted von Bertalanffy growth equation was:Lt=482 (1−e−0.12(t+2.79)) (n=136).
Based on published life history relationships, a point estimate of natural mortality for schoolmaster wasM=0.10, while age-specific estimates ofM ranged from 1.57–0.18 for ages 1–42.
SubjectsAquaculture, Fisheries and Fish Science, Ecosystem Science, Marine Biology
Keywords Lutjanidae, Life history, Age and growth, Natural mortality
INTRODUCTION
The schoolmaster (Lutjanus apodusWalbaum 1792), a medium-sized member of the family Lutjanidae, is distributed in the western Atlantic Ocean from Bermuda to Brazil (Mateo et al., 2010), including the Caribbean Sea and southeast Florida, including the Florida Keys. Schoolmaster are among the most abundant lutjanids found in the waters of the Cuban shelf (Claro & Parenti, 2001). The species is also found in the eastern tropical Atlantic from Cote d’Ivoire to Equatorial Guinea (Lloris & Rucabado, 1990). The majority of juveniles settle out into seagrass beds or mangrove habitats. Adults are typically found in shallow clear waters over rocky or coral reef areas up to 60 m in depth. Schoolmaster feed mainly on fishes, shrimp, crabs, gastropods and cephalopods (Allen, 1985;Rooker, 1995) and are known to form resting aggregations during the day.
anglers from both Florida waters and the US Caribbean. Annual numbers of schoolmaster landed by anglers fishing from private recreational boats and charter boats in Florida averaged 11,167 fish from 2004–2014, and private anglers from Puerto Rico averaged 9,066 fish annually during the same time period (estimated by the NMFS Marine Recreational Information Program, MRIP, T Sminkey, 2014, unpublished data). The majority of schoolmaster landed in the SEUS are from the southeast Florida-Florida Keys-Dry Tortugas region.
Schoolmaster are currently classified as an ‘‘ecosystem species’’ by the South Atlantic Fishery Management Council’s (SAFMC) Snapper-Grouper Fishery Management Plan (FMP) (SAFMC, 2015). This designation means there are no federal management regulations in place for the species, but that it is acknowledged as part of the fish species community associated with managed species of the Snapper Grouper Complex of the SAFMC . The species is managed by the Florida Fish and Wildlife Commission (FWCC) in state waters with a 10 inch (254 mm) total length size limit and a bag limit of 10 schoolmaster per person per day, within an aggregate 10 snapper per person overall bag limit, in both Atlantic and Gulf of Mexico waters of Florida. Schoolmaster are not currently scheduled for a NMFS stock assessment under the Southeast Data, Assessment and Review (SEDAR) program, likely due to low annual landings and management prioritization of other species considered more important commercially and recreationally.
There are several published studies detailing schoolmaster habitat preference (Dorenbosch et al., 2004; Hammerschlag-Peyer & Layman, 2010;Hammerschlag-Peyer & Layman, 2012;Mateo et al., 2010;Rooker & Dennis, 1991) and trophic and feeding ecology (Rooker, 1995). There is a dearth of information on basic life history such as age-growth or mortality.
Information about size-at-age and growth rates of reef fishes is valuable to fishery managers. The preferred method of aging reef fish is to use sagittal otoliths (Manooch, 1987). The sagittae may be read as whole structures in some species but are usually sectioned into several thin sections, which are then examined under a microscope to determine the age of the fish. Age is determined by counting alternating opaque and translucent bands deposited due to fluctuations in environmental conditions, such as water temperature. Nonlinear regression relating the measured length of the fish to the estimated age determined from the otoliths leads to the generation of growth curves, which are one of the most important inputs used in stock assessments, the procedure used by NMFS to provide scientific advice to fishery managers (K Siegfried, NMFS Beaufort Laboratory, pers. comm., 2015).
MATERIALS AND METHODS
Age determination and timing of opaque zone formation
Schoolmaster were opportunistically sampled by NMFS and state agencies’ port agents sampling the recreational and commercial fisheries landings in the SEUS from 1981–2015. The age samples, sagittal otoliths, were randomly selected from all fish measured by the port agents. The otoliths were stored dry in coin envelopes. All specimens used in this study were killed as part of legal fishing operations and were already dead when sampled by the port agents, thus all research was conducted in accordance with the Animal Welfare Act (AWA) and with the US Government Principles for the Utilization and Care of Vertebrate Animals Used in Testing, Research, and Training (USGP) OSTP CFR, May 20, 1985, Vol. 50, No. 97. All specimens were captured by conventional vertical hook and line gear. Fork lengths (FL) and total lengths (TL) of specimens were recorded in millimeters (mm). Whole weight (W) in grams (g) and sex of the specimen from macroscopic examination was recorded for fish landed in the recreational fishery when time allowed. Fish landed commercially were eviscerated at sea, thus whole weights and information about sex were unavailable. All data recorded by the port agents for each specimen were reviewed for accuracy and provided for the study.
Otoliths were processed for age readings using the following methods. They were sectioned in the transverse plane on a low-speed saw, following the methods ofPotts & Manooch (1995). Three serial 0.5 mm sections were taken near the otolith core. Sections were mounted on microscope slides with thermal cement and covered with mounting medium before analysis. The sections were viewed under a dissecting microscope at 12.5X using reflected or transmitted light. The section which encompassed the core was used primarily for age reading. The other sections could be used if the core section was compromised. Each sample was assigned an opaque zone, or ring, count by two experienced readers (MLB and JCP) (Burton, 2001;Burton, 2002;Burton, Potts & Carr, 2012;Potts, 1998;
Potts & Manooch, 1999). Sections were read with no knowledge of date of capture or fish size. We calculated between-reader indices of average percent error (APE) following the methodology ofBeamish & Fournier (1981).
Growth
Estimating growth of a fish is an important step in assessing the population and determining where the species fits into the community of fishes in its habitat. The most commonly used growth model for adult fish,Von Bertalanffy (1938)growth model, was used to estimate the parameters fit to the observed size-at-age data. Initially, parameter estimation was done using PROC NLIN, a non-linear regression procedure using least squares estimation and the Marquardt iterative algorithm option in SAS statistical software (vers. 9.3;SAS Institute, Inc., 1987). Because most of the samples for this study were obtained from fishery landings, the estimate of growth at the youngest ages may be skewed due to minimum size regulations imposed on the fishery or selectivity of the fish by the fishers. For that reason, the von Bertalanffy growth parameters were estimated using a left-truncated normal probability density function on length for fish subject to the minimum size limit (254 mm TL) regulation,as developed by McGarvey & Fowler (2002). For samples in this study not subject to minimum size limit, the full, untruncated nomal likelihood was used. Parameters were estimated by minimizing the negative sum of log-likelihoods with the AD Model Builder estimation software (Otter Research Ltd., Sidney, B.C., Canada).
Body-size relationships
For weight-length relationships, we regressedW on TL (n=256) and FL (n=161) using all available data collected by the SRHS from 1981–2015. Whole weights were recorded in grams, and lengths were recorded in mm. We examined both a non-linear fit by using nonlinear least squares estimation (SAS Institute, Inc., 1987) and a linearized fit of the log-transformed data, examining the residuals to determine which regression was appropriate. For length-length relationships, we regressed TL on FL and FL on TL (n=136) for all aged fish in this study.
Natural mortality
We estimated the instantaneous rate of natural mortality (M) using two methods: (1)Hewitt & Hoenig’s(2005)longevity mortality relationship:
M=4.22/tmax
wheretmaxis the maximum age of the fish in the sample, and
(2)Charnov, Gislason & Pope’s (2013; hereafter referred to as Charnov) method using life history parameters:
M=(Lt/L∞)−1.5×K
whereL∞andKare the von Bertalanffy growth equation parameters, andLtis fish length at
age. TheHewitt & Hoenig (2005)method uses longevity to generate a single point estimate. The Charnov method, which incorporates life history information via estimated growth parameters, is based upon evidence suggesting thatM decreases as a power function of body size. We used the midpoint of each age (e.g., 0.5, 1.5, 2.5, etc.) to calculate age-specific
Also, for stock assessment purposes where the integer age is used to describe the entire year of the fish’s life, the mid-point gives the median value ofM for that age. This method is currently in use in stock assessments in the US South Atlantic (E Williams, NMFS Beaufort Laboratory, pers. comm., 2013).
RESULTS
Age determination and timing of opaque zone formation
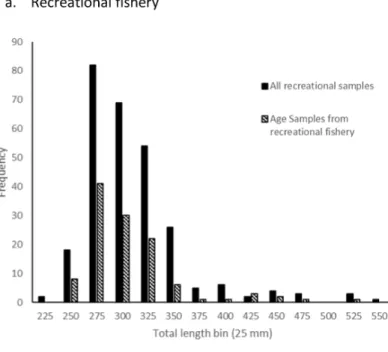
A total of 140 sagittal otoliths of schoolmaster were collected fishery landings along the east coast of Florida, except one fish collected by fishery-independent sampling in Beaufort, NC. There appeared to be no bias in selection of fish for otolith removal compared to all fish sampled from the fisheries (Fig. 1). From all age samples we were able to assign an opaque zone count to 136 (97%) schoolmaster otolith sections. Four specimens were excluded because sections were illegible.
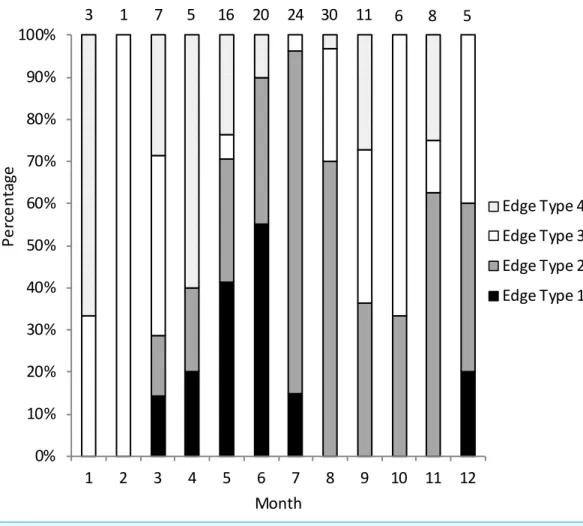
We assigned an edge type to all readable samples for our analysis of opaque zone periodicity. Schoolmaster deposited opaque zones on the otolith marginal edge March through July (Fig. 2), with peak formation in June. A transition to a narrow translucent edge occurred beginning in July. Schoolmaster otoliths were without an opaque zone on the edge from August through February, with the exception of one fish caught in December. The widest translucent edge, type 4, occurred in all months except July, which immediately follows month of peak opaque zone formation, but the rate of otoliths determined to have a type 4 edge was very low in the second half of the year compared to the first half of the year. We concluded that opaque zones on schoolmaster otoliths were annuli. Calendar ages based on edge analysis were assigned as follows: for fish caught January through July and having edge types of 3 and 4, the annuli count was increased by one; for fish caught in that same time period with edge types 1 and 2, as well as for fish caught from August to December, the calendar age was equivalent to the annuli count.
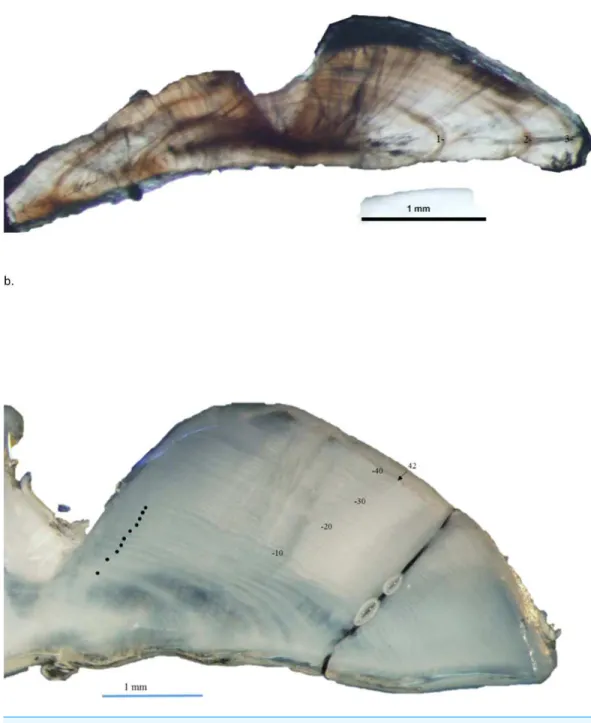
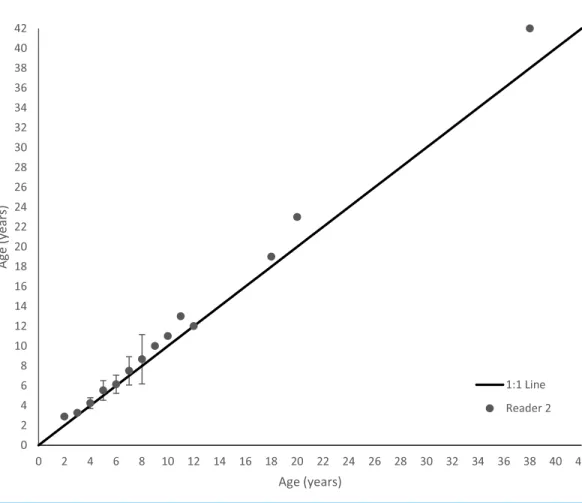
Schoolmaster otolith sections were relatively easy to interpret (Fig. 3). Agreement was good between readers. Average percent error, or APE, was 4.47% (n=136), which is less than Campana’s (2001) threshold level of acceptability of 5% for species of moderate longevity and reading complexity. Direct agreement between readings was 60%, and agreement for ±1 year was 90%. An age-bias plot indicates that the second reader overestimated schoolmaster ages very minimally for ages 1–7, with an average difference between readers of 0.27 years (Fig. 4). These ages encompassed 90% of our samples (122 out of 136 fish). The second reader overestimated schoolmaster ages with respect to the first reader slightly more for older ages (average difference between readers was 0.81 years for ages 8–11). When readings differed between readers, the samples were re-examined and consensus on age readings was reached for all discrepancies. The largest discrepancy between initial readings was a difference of four for the oldest fish in our study, a 42 year old fish.
Growth
0% 10% 20% 30% 40% 50% 60% 70% 80% 90% 100%
1 2 3 4 5 6 7 8 9 10 11 12
P
e
rc
e
n
ta
g
e
Month
Edge Type 4
Edge Type 3
Edge Type 2
Edge Type 1 3 1 7 5 16 20 24 30 11 6 8 5
Figure 2 Monthly percentage of edge types on schoolmaster (Lutjanus apodus) otoliths (n=136). Edge codes: 1, opaque zone on edge; 2, small translucent zone, <30% of previous increment; 3, moderate translucent, 30%–60% of previous increment; 4, wide translucent, >60% of previous increment. Monthly sample sizes are above each bar.
equation was:
Lt=492(1−e−0.09(t+5.76))(n=136;Fig. 5,Table 2).
There was one fish less than age—2 available to us, no doubt because hook-and-line gear or fishers generally select for larger fish. Consequently, the model was unable to depict initial growth of the youngest fish, thus explaining the moderately negative estimate oft0. Also, the FWCC size limit of ten inches (254 mm) TL may have excluded smaller fish from the landings and thus our samples, leading to difficulty in accurately estimating size at the youngest ages. We therefore re-ran the growth model using the method ofMcGarvey & Fowler (2002). The resulting von Bertalanffy growth equation was:
Lt=482(1−e−0.12(t+2.79))(n=136;Fig. 5,Table 2).
Body-size relationships
Figure 3 Dorso-ventral section from otolith of schoolmaster (Lutjanus apodus): (A) 245 mm TL, age 3 yrs, and (B) 440 mm TL, age 42 yrs. Age was determined by counting opaque increments along the dorsal axis and sulcus using transmitted and reflected light, respectively, at 12.5 X magnification.
linearized ln-transform fit of the data was appropriate. The relationships are described by the following regressions:
Figure 4 Age bias plot for 136 schoolmaster sampled from the southeastern United States from 1981– 2015 and aged by two primary readers.The second reader’s mean age estimates are plotted against the first reader’s age estimates. Error bars are 95% confidence intervals.
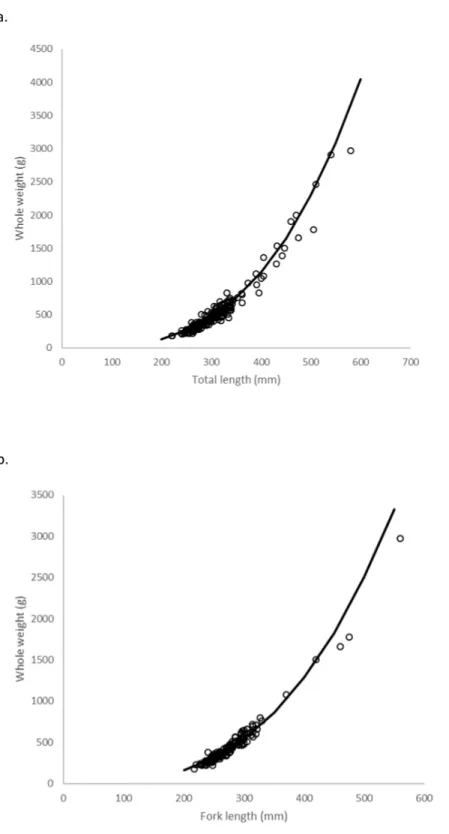
These equations were transformed back to the formW=a(L)bafter adjusting the intercept
for log-transformation bias with the addition of one-half of the mean square error (1/2 MSE) (Beauchamp & Olson, 1973), resulting in the relationships:
W =9.26×10⁻⁶TL3.11(Fig. 6A) and
W =2.13×10⁻⁵FL2.99(Fig. 6B).
The relationships between TL and FL are described by the equations:
TL=1.03×FL+9.96(n=117;r2=0.99) and FL=0.95×TL−5.43(n=117;r2=0.99).
Natural mortality
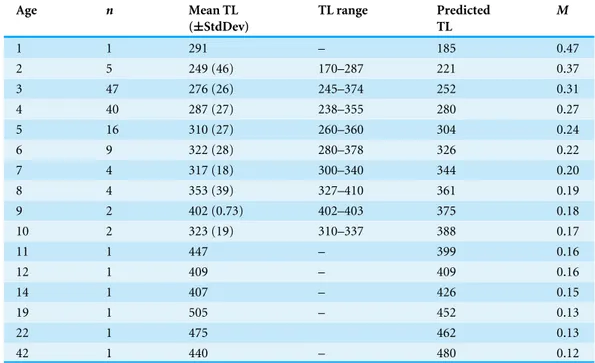
Table 1 Observed and predicted mean total length (TL) from the bias-corrected growth model, mea-sured in millimeters, and natural mortality at age (M,Charnov, Gislason & Pope, 2013) data for school-master (Lutjanus apodus) collected from 1981–2015 from the southeastern United States.Standard de-viations of the means (StdDev) are provided in parentheses.
Age n Mean TL (±StdDev)
TL range Predicted TL
M
1 1 291 – 185 0.47
2 5 249 (46) 170–287 221 0.37
3 47 276 (26) 245–374 252 0.31
4 40 287 (27) 238–355 280 0.27
5 16 310 (27) 260–360 304 0.24
6 9 322 (28) 280–378 326 0.22
7 4 317 (18) 300–340 344 0.20
8 4 353 (39) 327–410 361 0.19
9 2 402 (0.73) 402–403 375 0.18
10 2 323 (19) 310–337 388 0.17
11 1 447 – 399 0.16
12 1 409 – 409 0.16
14 1 407 – 426 0.15
19 1 505 – 452 0.13
22 1 475 462 0.13
42 1 440 – 480 0.12
Table 2 Growth parameters for schoolmaster estimated from the freely run model and the truncated likelihood model to account for minimum size limit bias.Standard errors are included for each parame-ter.
Method L∞(SE) k(SE) t0(SE)
Freely estimated 492 (29.20) 0.09 (0.02) −5.76 (1.30) Size limit bias-corrected 482 (26.43) 0.12 (0.02) −2.79 (0.94)
DISCUSSION
Otolith edge analysis demonstrated that schoolmaster deposited one annulus per year between March and July, with peak annulus formation in June. This peak is similar to timing of annulus formation for other snappers in the SEUS, which tend to form annuli in spring and summer months (Burton, 2001;Burton, 2002;Garcia et al., 2003;Potts, 1998).
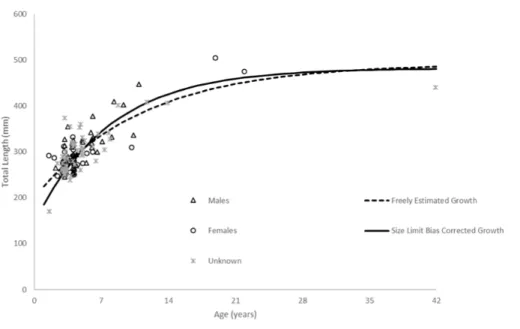
Figure 5 Comparison of SEUS schoolmaster observed size at age to von Bertalanffy growth curves for freely estimated (unweighted) and size limit bias-corrected model runs (McGarvey & Fowler, 2002).
Schoolmaster grew moderately slowly, attaining an average observed size of 248 mm TL by age—2, 275 mm by age—3, and 322 mm by age—6 (Table 1). Mean observed size at age is not very informative beyond age—6 because of small sample sizes. There is moderate variability in size at age, with an average size range of 112 mm for ages 2–6 (Table 1;Fig. 5). This is not unusual for long-lived species of lutjanids. The two largest lutjanids in the US Atlantic, cubera snapper and red snapper exhibited proportionally large variability in size at age. The cubera snapper will range close to 500 mm at several ages (e.g., 470–960 mm FL range for age—8 fish, and 617–1,100 mm FL range for age—17 fish) (M Burton, 2016, unpublished data). A recent assessment of red snapper (SEDAR, 2010) showed similar variability in size at age (e.g., age—4, 247–865 mm TL size range; age—7, 557–905 mm TL size range). It is worth mentioning here that our oldest fish was 42 years and 440 mm, and our largest fish was 505 mm and 19 years.
Our predicted growth curve of schoolmaster using the bias-corrected growth parameters fit the observed data well (Fig. 5). The von Bertalanffy parameterK, or the Brody growth coefficient, which estimates the rate of attainment of maximum size, was comparable to estimates from other lutjanids from the SEUS (mutton snapper, Lutjanus analis—0.16 (Burton, 2002); gray snapper,Lutjanus griseus—0.13 (Burton, 2001)). There was little difference between parameters estimated by the unweighted, freely-estimated model and the bias-corrected model, except for thet0parameter (Fig. 5). The bias-corrected model resulted in a more biologically reasonablet0value that generated more realistic estimates of sizes at the youngest ages, thus we decided it was the most appropriate model to describe overall growth.
the research conducted on the life history traits of lutjanids in the US Atlantic, generally sexually dimorphic growth has not been found (SEDAR, 2010;Burton, 2001;Burton, 2002).
Figure 5shows the observed size-at-age of males, females and unknown sex schoolmaster in our dataset. Even though the data are limited, there does not appear to be any evidence of dimorphic growth.
Natural mortality (M) of wild fish populations is difficult to measure but is an important input into stock assessments. A point estimate ofM (Hewitt & Hoenig, 2005) for the entire life span of a fish seems unreasonable, because as fish grow they become less vulnerable to predation. Given the longevity of the species, we thought that our point estimate of
M was reasonable for fully recruited ages in our study but was an insufficient estimate of
M for all ages. The age-varyingM calculated using Charnov seems a more appropriate estimator for the younger ages. The initial Charnov estimates ofM starting with the fully recruited age—4 are approximately 3×theHewitt & Hoenig (2005)estimate, reflecting higher natural mortality at younger ages. The age-specific estimates ofM for the older ages are approximately double the Hewitt & Hoenig (2005)estimate ofM by age—14 (Table 1). When considering the cumulative estimate of survivorship to the fully recruited ages, theHewitt & Hoenig (2005)method estimated 2.0% survivorship, while the Charnov estimate was 0.3%. Very few of the fish in our samples were older than age—8 (9 of 143), and only two were age—22 or older. Though sample size in this study was limited, the age-frequency distribution suggests that the chance of survivorship to the oldest age may truly be lower than 1%. The two estimators ofM are based on different life history traits. A long-lived species would be expected to have a lower M, asHewitt & Hoenig (2005)
theorize. In contrast, given the smaller maximum size of this fish, compared to similar long-lived snappers, it may be more susceptible to predation than larger growing congeners, asCharnov, Gislason & Pope (2013)theorize. There is no evidence that hook and line gear is dome-selective for this species or its congeners (SEDAR, 2010;SEDAR, 2015): thus our study had the potential to collect the largest and oldest fish in the population. These observations give weight to the argument to use Charnov’s estimate ofM at age.
Another limitation of our study is the long period of time over which samples were collected (>30 yrs). Population parameters can vary inter-annually for various reasons (e.g., variable recruitment, environmental reasons), and it is certain that parameter estimates based on samples collected over 30 years would have increased variability when compared to estimates generated from samples collected over a much shorter time period. Unfortunately, less frequently caught species such as schoolmaster, species that are not prioritized by sampling programs because of their lack of abundance in the landings, will likely never be obtained in quantities large enough to allow us to eliminate this source of variance in the parameter estimates.
This study is the first published study of schoolmaster life history in the SEUS. We have shown that otolith sections of schoolmaster contain annuli that are relatively easy to enumerate and that otolith sections are therefore likely reliable structures for aging. Growth rings on schoolmaster sagittae are assumed to be deposited once a year in late spring–early summer, and growth is generally fast for the first seven years and then slows considerably. Our estimates ofM are reasonable for a fish with a moderately long life span and longevity to age 42. We believe the results of this study accurately describe the fished population of schoolmaster in the SEUS. The relatively small overall landings of this species in the commercial and recreational fisheries of the SEUS make it an unlikely candidate for a stock assessment through the NMFS SEDAR process. A more likely use of these data would be their application to studies of the population dynamics of US Caribbean stocks (US Virgin Islands and Puerto Rico). The US Caribbean is typically a data poor region and studies from the SEUS could be used as proxies in analyses for the region.
ACKNOWLEDGEMENTS
We gratefully acknowledge the many headboat and commercial port samplers over the years whose efforts made this study possible. Nathan Bacheler, James Morris and Patti Marraro and two anonymous reviewers provided valuable reviews that greatly improved the manuscript.
ADDITIONAL INFORMATION AND DECLARATIONS
Funding
Funding for this research was provided by funds granted by the US Congress to the NOAA National Marine Fisheries Service. The funders had no role in study design, data collection and analysis, decision to publish, or preparation of the manuscript.
Grant Disclosures
The following grant information was disclosed by the authors: NOAA National Marine Fisheries Service.
Competing Interests
Author Contributions
• Jennifer C. Potts conceived and designed the experiments, performed the experiments, analyzed the data, contributed reagents/materials/analysis tools, wrote the paper, prepared figures and/or tables, reviewed drafts of the paper.
• Michael L. Burton conceived and designed the experiments, performed the experiments, analyzed the data, wrote the paper, prepared figures and/or tables, reviewed drafts of the paper.
• Amanda R. Myers contributed reagents/materials/analysis tools, reviewed drafts of the paper, sample processing.
Animal Ethics
The following information was supplied relating to ethical approvals (i.e., approving body and any reference numbers):
All research was conducted in accordance with the Animal Welfare Act (AWA) and with the US Government Principles for the Utilization and Care of Vertebrate Animals Used in Testing, Research, and Training (USGP) OSTP CFR, May 20, 1985, Vol. 50, No. 97.
Data Availability
The following information was supplied regarding data availability: The raw data has been supplied asSupplemental Information.
Supplemental Information
Supplemental information for this article can be found online athttp://dx.doi.org/10.7717/ peerj.2543#supplemental-information.
REFERENCES
Allen GR. 1985. Snappers of the world: an annotated and illustrated catalogue of lutjanid species known to date. In:FAO Fisheries Synopses (Book 125, Volume 6). Rome: FAO, 208 p.
Beamish RJ, Fournier DA. 1981.A method for comparing the precision of a set of age determinations.Canadian Journal of Fisheries and Aquatic Science38:982–983
DOI 10.1139/f81-132.
Beauchamp JJ, Olson JS. 1973.Corrections for bias in regression estimates after logarithmic transformations.Ecology 54:1403–1407DOI 10.2307/1934208.
Burton ML. 2001.Age, growth, and mortality of gray snapper from the east coast of Florida.Fishery Bulletin99:245–256 DOI 10.1016/S0165-7836(02)00007-3.
Burton ML. 2002.Age, growth and mortality of mutton snapper,Lutjanus analis, from the east coast of Florida, with a brief discussion of management implications.
Fisheries Research59:31–41DOI 10.1016/S0165-7836(02)00007-3.
Burton ML, Potts JC, Carr DR. 2012.Age, growth and natural mortality of rock hind,
Epinephelus adscencionis, from the Gulf of Mexico.Bulletin of Marine Science
Campana SE. 2001.Accuracy, precision and quality control in age determination, including a review of the use and abuse of age validation methods.Journal of Fish Biology59:197–242DOI 10.1111/j.1095-8649.2001.tb00127.x.
Charnov EL, Gislason H, Pope JG. 2013.Evolutionary assembly rules for fish life histories.Fish and Fisheries14:212–224DOI 10.1111/j.1467-2979.2012.00467.x.
Christensen VC, Walters J, Ahrens R, Alder J, Buszowski J, Christensen LB, Cheung WWL, Dunne J, Froese R, Karpouzi V, Kaschner K, Kearney K, Lai S, Lam V, Palomares MLD, Peters-Mason A, Piroddi C, Sarmiento JL, Steenbeek J, Sumaila R, Watson R, Zeller D, Pauly D. 2009.Database-driven models of the world’s large marine ecosystems.Ecological Modelling 220:1987–1996
DOI 10.1016/j.ecolmodel.2009.04.041.
Claro R, Parenti LR. 2001. The marine ichthyofaunal of Cuba. In: Claro R, Lindeman KC, Parenti LR, eds.Ecology of the marine fishes of Cuba. Washington, D.C.: Smithsonian Institution Press, 21–57.
Dorenbosch M, Van Riel MC, Nagelkerken I, Van der Velde G. 2004.The relationship of reef fish densities to the proximity of mangrove and seagrass nurseries.Estuarine Coastal and Shelf Science60:37–48DOI 10.1016/j.ecss.2003.11.018.
Garcia ER, Potts JC, Rulifson RA, Manooch III CS. 2003.Age and growth of yellowtail snapper,Ocyurus chrysurus, from the southeastern United States.Bulletin of Marine Science72:909–921.
Hammerschlag-Peyer CM, Layman CA. 2010.Intrapopulaiton variation in habitat use by two abundant coastal fish species.Marine Ecology Progress Series415:211–220
DOI 10.3354/meps08714.
Hammerschlag-Peyer CM, Layman CA. 2012.Factors affecting resource use variation for an abundant coastal fish predator,Lutjanus apodus, in a Bahamian wetland system.Bulletin of Marine Science88:211–230DOI 10.5343/bms.2011.1024.
Harris PJ, Wyanski DM, White DB, Mikell PP, Eyo PB. 2007.Age, growth, and repro-duction of greater amberjack off the southeastern US Atlantic coast.Transactions of the American Fisheries Society136:1534–1545DOI 10.1577/T06-113.1.
Hewitt DA, Hoenig JM. 2005.Comparison of two approaches for estimating natural mortality based on longevity.Fishery Bulletin103:433–437.
Lloris D, Rucabado J. 1990. Lutjanidae. In: Quéro JC, Hureau JC, Karrer C, Post A, Saldanha L, eds.Check-list of the fishes of the eastern tropical Atlantic (CLOFETA). Paris: UNESCO, 773–779.
Manooch III CS. 1987. Age and growth of snappers and groupers. In: Polovina JJ, Ralston S, eds.Tropical snappers and groupers: biology and fisheries management. Boulder: Westview Press.
Mateo I, Durbin EG, Appeldoorn RS, Adams AJ, Jaunes F, Kingsley R, Swart P, Durant D. 2010.Role of mangroves as nurseries for French gruntHaemulon flavolineatum
McGarvey R, Fowler AJ. 2002.Seasonal growth of King George whiting (Sillaginodes punctata) estimated from length-at-age samples of the legal-size harvest.Fishery Bulletin100:545–558.
Potts JC. 1998.Age and growth of vermilion snapper,Rhomboplites aurorubens, from the southeastern United States.Transactions of the American Fisheries Society
127:787–795DOI 10.1577/1548-8659(1998)127<0787:AAGOVS>2.0.CO;2.
Potts JC, Manooch III CS. 1995.Age and growth of red hind and rock hind collected from North Carolina through the Dry Tortugas, Florida.Bulletin of Marine Science
56:784–794.
Potts JC, Manooch III CS. 1999.Observations on the age and growth of graysby and coney from the southeastern United States.Transactions of the American Fisheries Society128:751–757DOI 10.1577/1548-8659(1999)128<0751:OOTAAG>2.0.CO;2.
Rooker JR. 1995.Feeding ecology of schoolmaster snapper, Lutjanus apodus (Walbaum) from southwestern Puerto Rico.Bulletin of Marine Science56:881–894.
Rooker JR, Dennis GD. 1991.Diel, lunar and seasonal changes in a mangrove fish assemblage off southwestern Puerto Rico.Bulletin of Marine Science49:684–698.
SAFMC. 2015.South Atlantic Fishery Management Council. Schoolmaster.Available at
http:// safmc.net/ fish-id-and-regs/ schoolmaster(accessed on 11 March 2016).
SAS Institute, Inc. 1987. SAS/STAT guide for personal computers. Version 6. Cary, NC: SAS Institute, Inc.
SEDAR. 2010.SEDAR24—Stock assessment report: South Atlantic Red Snapper.
Available athttp:// sedarweb.org/ docs/ sar/ SEDAR%2024_SARRedSnap_Final.pdf
(accessed on 4 March 2016).
SEDAR. 2015.SEDAR15A—Stock assessment of mutton snapper (Lutjanis analis) of the US South Atlantic and Gulf of Mexico through 2013. SEDAR update assess-ment.Available athttp:// sedarweb.org/ docs/ suar/ SEDAR%20Update%20Stock%
20Assessment%20of%20Mutton%20Snapper%202015_FINAL.pdf (accessed on 6 July
2016).