Vol.46, n. 4 : pp. 711-721, December 2003
ISSN 1516-8913 Printed in Brazil
BRAZILIAN ARCHIVES OF
BIOLOGY AND TECHNOLOGY
A N I N T E R N A T I O N A L J O U R N A LWater Quality in Watershed of the Jaboatão River
(Pernambuco, Brazil): a Case Study
Antonio Donizetti Gonçalves de Souza
*and José Galizia Tundisi
Programa Pós-Graduação Ecologia e Recursos Naturais; UFSCar; Via Washington Luiz, km 235; 13565-905; São Carlos - SP - Brazil
ABSTRACT
The purpose of the present work was to evaluate anthropogenic influences on the water quality and to offer a subsidy to the establishment of water quality goals in the Jaboatão River Basin (Pernambuco State, Brazil). Eight sampling points were established and were sampled monthly during one hydrological cycle (March/98-February/99). The following variables were analyzed: temperature, pH, conductivity, chlorine, alkalinity, dissolved oxygen, biochemical oxygen demand, fecal coliforms, nitrate, total phosphorus and total solids. The most critical variables related to water quality objectives were dissolved oxygen, fecal coliforms and total phosphorus. Maps of land use, legally protected areas, area industries, and water withdrawals were utilized in order to propose division of the watershed into regions and to provide water quality management information.
Key words: Watershed; Water quality; Environmental management
*
Author for correspondence
INTRODUCTION
Human society utilizes water for purposes such as domestic, irrigation, navigation, assimilation of residues, etc. These uses cause conflicts that require effective water management, for which several instruments exist that aid in the rational use of water resources in the watersheds. In this context, the classification of water bodies according to uses is a powerful tool in water quality management. The classification systems of water bodies are usually established according to legal standards. Subsequently, in each watershed, the reaches of the rivers are classified accordingly. Seager (1993) stated that this provided a firm basis for protecting water quality and to provide improvements where required. Barth (1999) affirmed that water quality classification of rivers should be seen as a goal to be reached over time.
Water body classification by use is also one of the instruments provided for in federal law n°. 9433/97, which defined the National Water Resources Policy for Brazil and created the National Water Resources Management System (Brasil, 1997). Water quality evaluations and comparisons with legal classification norms are crucial for identifying the critical locations and providing subsidies for decision making, and thus facilitating selection of priorities in adopting corrective measures. The purpose of the present work was to evaluate anthropogenic influences on water quality and to offer a subsidy in the establishment of water quality goals in the Jaboatão watershed (Pernambuco State, Brazil).
STUDY AREA
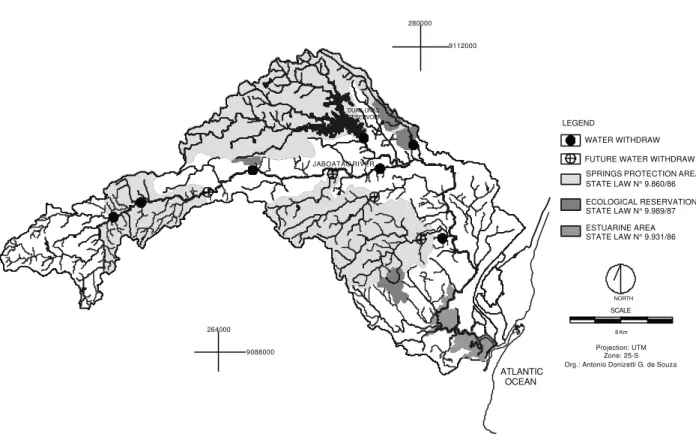
The Jaboatão watershed, located in Northeastern Brazil, in Pernambuco State (8°00'-8°14' S and 34°50'-35°15' W), is 413 km2 in area and 75 km in length. The river crosses the Metropolitan Region of Recife (MRR), the mouth is on the Atlantic Ocean. (Fig. 1). The annual mean temperature is approximately 24°C. Annual rainfall varies from 2000 mm in the littoral region to 700 mm in the upper basin (CPRH, 1995). The regional year can be divided in two different periods: the winter season, with frequent rain (March to August) and the summer season, with lower amounts of rain (September to February). The specific and decenal flows are 3.40 L/s.km2 and 2034.00 L/s respectively (Acquaplan 1990).
The watershed drains six municipalities: Vitória de Santo Antão, Cabo de Santo Agostinho, Moreno, São Lourenço da Mata, Jaboatão dos Guararapes, and Recife. The main sources of pollution are a
mill, usina Bulhões that in summer discharges
effluents into the river, and Portela, a paper and cellulose manufactures, both located in Jaboatão dos Guararapes. In addition, untreated sewage also impacts water quality. The Jaboatão River is not yet classified according to CONAMA resolution 20/86.
MATERIALS AND METHODS
Figure 1 - Location of sampling sites along the Jaboatão watershed.
RESULTS AND DISCUSSION
According to Peters and Meybeck (2000), water quality mirrors the combined effect of many processes occurring along its banks. In developing country metropolitan regions, spatial disorganization in particular worsens river contamination (Pegram, 1999). These problems were found in MRR in the area of the Jaboatão River basin, and indicated the need of an integrated approach for the watershed planning and decision making relating to its environmental recovery.
Figure 2 shows land use in the watershed, mainly sugarcane, with 58.31% of the total area and the few remaining forests (0.57%). In Figure 3, legal protection areas and present and future water withdrawals appear. Most industries are located in the littoral region, in the town of in Jaboatão dos Guararapes (Fig. 4).
The results of water quality analyses are showed in Table 1. In general, during the summer, median values were more elevated for variables related to ionic content of the water (conductivity, alkalinity, chlorine, and total solids). This could be explained
by the higher ion concentration in the water in this period; in winter, the inverse phenomenon occurred, with dilution of these elements due to rain. Maier (1977) reported this same occurrence for the Mogi-Guaçu River.
Spatially, except for the JB-75 site located at the estuary of the river, stations JB-35 and JB-41 registered the highest values for the conductivity, alkalinity, and chlorine. The spatial distribution of dissolved oxygen showed an anoxic state in practically the entire reach studied. The median values registered varied from 0.00 mg/L to 3.80 mg/L. The BOD values showed an inverse relation with oxygen; the highest median values were registered at sites JB-41 and JB-20 (135.40 mg/L and 134.95 mg/L, respectively).
Most sampling sites showed maximum values for fecal coliforms (1600000 NMP/100 ml). The highest median values were found at stations located in urban areas: 10, 20, 22, JB-35, and JB-41. Sites JB-55 and JB-75 showed lower median values during the study period. The results indicated anthropogenic influences in practically all the samplings points monitored.
JB-10
JB-15
JB-20 JB-22
JB-35
JB-41
JB-55
JB-75
ATLANTIC OCEAN
DUAS UNAS RESERVOIR
JABOATÃO RIVER
8 Km SCALE
NORTH
Projection: UTM Zone: 25-S Org.: Antonio Donizetti G. de Souza 264000
9088000
280000
The impacts caused by usina Bulhões were detected at station JB-20, which showed elevated values for temperature, BOD, total phosphorus, and nitrate, and low levels of oxygen during the period of its operation (summer). In addition, the water withdrawals in this period for use in processing sugarcane caused a dilution capacity decrease of the river. The elevated values of pH, conductivity, alkalinity, and total solids at site JB-35 indicated the influence of the industrial area upstream. Dimitrova et al. (1998) reported pH peaks at sampling points situated in downstream industrial areas. Prat and Munné (2000) registered a longitudinal conductivity gradient caused by urban and industrial water uses along the drainage area of lotic environments. At site JB-41, the higher median alkalinity values in summer probably indicated discharges from Portela. According to Leitão (1999) and Guaglianoni (1998), this type of industry produced effluents with high concentrations of chlorine and NaOH, used in removal of lignin from wood in the paper production process.
Fecal contamination was more evident at sampling points located near urban areas, which
showed a spatial decrease gradient towards the mouth of the river in the estuary. This was also found by Mallin et al. (2000). According to these authors, headwater stations were more influenced by pollution due to their location near urban areas; on the other hand, estuarine sites reflected the dilution process and also salinity. Several studies have demonstrated that fecal coliforms survival decreased in waters of high salinity (Hanes and Fragala, 1967; Evison, 1988).
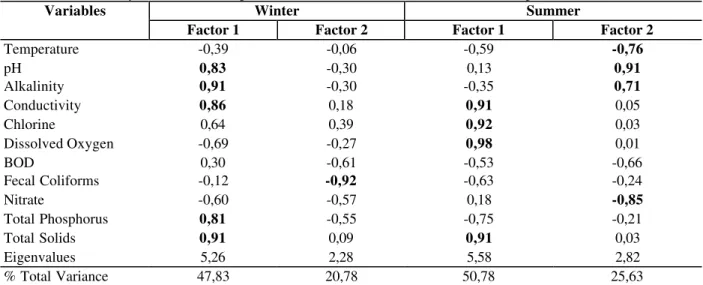
Factor analyses are represented in Table 2 and Figure 5. For winter, two factors explained 68.61% of the variance. Factor 1 presented high positive correlation of the following variables: pH, alkalinity, conductivity, total phosphorus, and total solids. Factor 2 indicated fecal coliforms with negative correlation. Figure 5 showed the highest correlation two the sites JB-35 with factor 1 due to high water ionic richness in winter. Sites JB-41 and JB-55 showed an ionic concentration gradient. The other sampling points had less correlation with factor 1 due to both less ionic richness and total phosphorus values.
Figure 3 - Legal protection areas and water withdrawals in Jaboatão watershed.
Figure 4 - Industrial sources of pollution in the Jaboatão watershed. LEGEND
SPRINGS PROTECTION AREA STATE LAW N° 9.860/86 ECOLOGICAL RESERVATION STATE LAW N° 9.989/87 ESTUARINE AREA STATE LAW N° 9.931/86
JABOATÃO RIVER ATLANTIC OCEAN DUAS UNAS RESERVOIR WATER WITHDRAW FUTURE WATER WITHDRAW
280000
9112000
264000
9088000 Projection: UTMZone: 25-S
Org.: Antonio Donizetti G. de Souza
8 Km SCALE NORTH 12 3 2 1 4 8 5 6 7 9 10 13 14 11 15 16 17 18 19 20 21 24 22 23 DUAS UNAS RESERVOIR SCALE 8 Km NORTH Projection: UTM Zone: 25-S Org.: Antonio Donizetti G. de Souza
ATLANTIC OCEAN
9088000 264000
280000
9112000 N° INDUSTRY
In the summer, factor 1 explained 50.78% of the variance and contributed highly to: conductivity, chlorine, dissolved oxygen, and total solids. Factor 2 explained 25.63% of the variance and included pH, alkalinity (positive correlation) temperature, and nitrate (negative correlation). The distribution of factors along the sites showed that station JB-75 was highly correlated with factor 1. All other sites showed little influence of this factor due its correlation with oxygen (0.98). For factor 2, sites JB-20 and JB-22 were most correlated by having the highest nitrate and temperature values. The higher homogeneity registered for the summer period showed water quality decline in most variables analyzed, specially with reference to oxygen, nitrate, total phosphorus, in addition to maintenance of fecal contamination levels.
The results of the comparison between water quality and classes determined by CONAMA resolution 20/86 showed that all sites should be included within class 3 and 4 limits, which are less restrictive (Fig. 6). In both studied periods (winter
and summer), the critical variables were dissolved oxygen, total phosphorus, and fecal coliforms. These variables were also reported as critical in similar work by Gama et al. (1998) and Pereira and Lanna (1998) and indicated the anthropogenic impacts that occurred along the river.
For establishing water quality goals and classes in accordance with CONAMA resolution 20/86, the watershed was subdivided into representative areas with water use restrictions. These areas are represented in Figure 7 which shows water way segments in groups with the following characteristics:
Group 1: Springs
This group contained water bodies used as sources of urban supply and future withdrawals goals. This area included the rivers within the spring protection area and ecological reservations, besides others not listed but included anyway because of headwaters location. The classes to be proposed for this area were Special and Class 1.
Table 1 - Results of the variables registered at sampling sites of the Jaboatão watershed.
Sites Period Statistic Temperature pH Alkalinity Conductivity Cl
Descritive (°C) (mg/L) (Us/cm) (mg/L)
Winter Median 27,25 6,65 54,50 181,25 25,40
JB-10 Std. Dev. 1,03 0,15 12,28 28,42 3,93
Summer Median 28,75 7,00 66,30 261,00 37,60
Std. Dev. 0,41 0,46 82,31 213,31 20,32
Winter Median 27,50 6,55 41,50 150,90 23,25
JB-15 Std. Dev. 1,26 0,16 5,66 7,36 1,63
Summer Median 29,25 6,85 61,95 205,50 29,75
Std. Dev. 1,18 0,55 11,83 27,89 4,75
Winter Mediana 28,00 6,85 48,25 176,05 25,95
JB-20 Std. Dev. 3,92 0,82 20,37 101,51 14,53
Summer Median 31,75 6,45 85,90 422,50 53,55
Std. Dev. 3,54 1,18 29,11 147,44 18,66
Winter Median 27,75 6,75 61,25 216,50 35,30
JB-22 Std. Dev. 1,91 0,19 13,20 55,30 5,83
Summer Median 31,50 6,45 96,00 433,50 61,70
Std. Dev. 3,11 0,90 28,75 179,90 22,41
Winter Median 27,00 7,20 190,00 549,00 73,30
JB-35 Std. Dev. 1,11 0,17 66,00 190,80 24,38
Summer Median 29,00 7,75 414,85 1265,00 158,60
Std. Dev. 1,30 0,56 150,12 425,98 59,68
Winter Median 27,75 6,95 122,75 390,50 43,30
JB-41 Std. Dev. 2,27 0,25 63,13 99,57 15,09
Summer Median 30,00 6,90 202,00 794,00 80,20
Std. Dev. 2,00 0,48 113,19 249,53 25,83
Winter Median 27,50 7,00 106,45 300,50 41,10
JB-55 Std. Dev. 0,90 0,07 29,18 73,64 13,64
Summer Median 28,50 7,00 191,10 577,00 71,10
Std. Dev. 0,53 0,44 81,70 258,99 31,52
Winter Median 27,75 7,00 105,40 833,00 213,40
JB-75 Std. Dev. 1,61 0,11 29,71 9102,71 3729,37
Summer Median 27,75 7,20 125,00 20000,00 10692,00
Std. Dev. 0,90 0,35 85,46 0,00 1846,79
(Cont. Table 1)
Sites Period Statistic Dissolved
Oxygen
BOD Fecal
Coliforms
Nitrate Total
Phosphoru s
Total solids
Descritive (mg/L) (mg/L) (NMP/100ml) (µµg/L) (µµg/L) (mg/L)
Winter Median 1,20 8,75 160000,00 40,50 260,00 162,40
JB-10 Std. Dev. 0,72 5,33 68719,12 30,05 86,86 14,07
Summer Median 0,90 31,80 160000,00 42,50 370,00 200,40
Std. Dev. 1,02 27,57 0,00 20,12 634,74 140,79
Winter Median 0,10 3,35 4650,00 18,00 170,00 136,80
JB-15 Std. Dev. 2,34 1,75 2683,75 74,38 53,81 9,84
Summer Median 1,50 2,40 1700,00 20,00 135,00 178,15
Std. Dev. 1,52 2,67 34986,66 5,56 48,10 18,78
Winter Mediana 2,60 4,10 160000,00 87,00 280,00 152,00
JB-20 Std. Dev. 1,22 107,73 58889,73 110,57 47,58 220,90
Summer Median 0,20 134,95 160000,00 320,00 2585,00 425,65
Std. Dev. 2,79 589,21 63480,00 170,98 1394,73 280,89
Winter Median 1,60 5,15 160000,00 109,00 350,00 178,20
JB-22 Std. Dev. 0,79 11,66 0,00 54,55 61,12 38,07
Summer Median 0,00 89,00 160000,00 136,00 2095,00 414,05
Std. Dev. 1,46 99,30 0,00 134,11 1133,82 231,01
Winter Median 0,00 8,00 160000,00 26,00 980,00 376,00
JB-35 Std. Dev. 0,32 2,49 0,00 17,73 145,32 109,71
Summer Median 0,00 23,00 160000,00 16,50 2435,00 828,25
Std. Dev. 0,15 6,58 50000,00 5,87 1119,43 252,03
Winter Median 0,00 34,00 160000,00 45,50 890,00 351,00
JB-41 Std. Dev. 0,00 21,80 0,00 28,61 312,51 128,43
Summer Median 0,00 135,40 160000,00 29,00 1770,00 334,00
Std. Dev. 0,64 64,71 52000,00 18,38 750,96 263,00
Winter Median 0,00 4,35 26900,00 22,00 480,00 275,40
JB-55 Std. Dev. 0,61 6,41 63978,28 29,04 174,42 68,94
Summer Median 0,00 9,25 10500,00 31,00 1305,0 446,60
Std. Dev. 0,44 12,99 56418,39 85,33 495,7 165,49
Winter Median 0,60 3,95 40000,00 23,50 460,00 525,25
JB-75 Std. Dev. 0,67 1,74 24914,86 13,98 245,31 7455,35
Summer Median 3,80 2,60 31500,00 150,00 120,00 21435,00
Std. Dev. 0,59 1,17 19828,96 100,80 146,78 4558,38
Group 2: Estuary
The water bodies of this group are located in the lower portion of the watershed, within the protected estuarine area. They were part of mangrove areas and require, like the area group 1, special protection measures. Studies should be made to determine the zone of influence of the tide. In their absence, it appeared that this region should be included in classes 7 and 8 (brackish waters)
Group 3: Urban
This group included water bodies in urban areas within the watershed. These areas required recovery measures and control and organization of urban expansion, including collection and
treatment of domestic, industrial effluents, and solid residues. They were obviously critical reaches where the class 2 standard should be established as the goal.
Group 4: Urban/Industry
Table 2 - Factor analysis. Factor loading of variables measured for winter and summer periods.
Winter Summer
Variables
Factor 1 Factor 2 Factor 1 Factor 2
Temperature -0,39 -0,06 -0,59 -0,76
pH 0,83 -0,30 0,13 0,91
Alkalinity 0,91 -0,30 -0,35 0,71
Conductivity 0,86 0,18 0,91 0,05
Chlorine 0,64 0,39 0,92 0,03
Dissolved Oxygen -0,69 -0,27 0,98 0,01
BOD 0,30 -0,61 -0,53 -0,66
Fecal Coliforms -0,12 -0,92 -0,63 -0,24
Nitrate -0,60 -0,57 0,18 -0,85
Total Phosphorus 0,81 -0,55 -0,75 -0,21
Total Solids 0,91 0,09 0,91 0,03
Eigenvalues 5,26 2,28 5,58 2,82
% Total Variance 47,83 20,78 50,78 25,63
WINTER
JB-20 JB-10
JB-22 JB-15
JB-55
JB-35
JB-41 JB-75
-2 0 2
-2 0 2
Factor 1
Factor 2
SUMMER
JB-41
JB-15 JB-10
JB-22
JB-20 JB-55 JB-35
JB-75
-2 0 2
-2,5 0 2,5
Factor 1
Factor 2
Figure 5 - Distribution of sampling sites (factor scores) according to factors 1 and 2.
The groups of uses and water quality classes suggested above could serve as a basic framework lending support to more detailed studies on the watershed. This study showed a condition of environmental degradation as attested by several water quality variables analyzed in the Jaboatão watershed. In the stations representing urbanized areas, JB-10, JB-20, JB-22, JB-35, and JB-41, the worst water quality conditions were found, specially in the summer period, resulting from industrial and domestic effluents. The critical variables were dissolved oxygen, fecal coliformes,
and total phosphorus, which placed the area within class 3 and 4 according CONAMA resolution 20/86. Water use regulation was proposed as an useful tool in beginning discussion of water quality goals according classification system proposed by the CONAMA resolution.
Class 3
Class 4 Class 2 Class 1
0 1 2 3 4 5 6
JB-10 JB-15 JB-20 JB-22 JB-35 JB-41 JB-55 JB-75
Dissolved oxygen (mg/L)
Winter Summer
Class 2 Class 1 Class 3
1,0E+00 1,0E+01 1,0E+02 1,0E+03
JB-10 JB-15 JB-20 JB-22 JB-35 JB-41 JB-55 JB-75
Log BOD (mg/L)
Winter Summer
Class 1,2,3
1,0E+00 1,0E+01 1,0E+02 1,0E+03 1,0E+04
JB-10 JB-15 JB-20 JB-22 JB-35 JB-41 JB-55 JB-75
Log Total phosphorus (mg/L)
Winter Summer
Class 2 Class 1 Class 3
1,0E+00 1,0E+01 1,0E+02 1,0E+03 1,0E+04 1,0E+05 1,0E+06
JB-10 JB-15 JB-20 JB-22 JB-35 JB-41 JB-55 JB-75
Log Fecal coliforms (NMP/100ml)
Winter Summer
Figure 6 - Comparison of water quality registered and classes of CONAMA resolution 20/86.
Figure 7 - Groups of the water restricted uses propose for Jaboatão watershed.
Projection: UTM Zone: 25-S Org.: Antonio Donizetti G. de Souza
8 Km
SCALE
NORTH
GROUP 4 - URBAN/INDUSTRY GROUP 3 - URBAN
GROUP 1 - SPRINGS GROUP 2 - ESTUARY LEGEND
ATLANTIC OCEAN
280000
9112000
264000
9088000
G1
G1
G2 G3
ACKNOWLEDGEMENTS
The authors express their thanks to Companhia Pernambucana do Meio Ambiente (CPRH) for the institutional and operational support in this study and to Conselho Nacional de Desenvolvimento Científico e Tecnológico (CNPq).
RESUMO
O presente estudo teve como objetivos avaliar as influências antrópicas sobre a qualidade da água na bacia do rio Jaboatão (Pernambuco, Brasil) e fornecer subsídios ao enquadramento dos corpos d'água em classes de usos. Foram realizadas coletas mensais de água durante o período de março/98 a fevereiro/99 em oito estações de amostragem. As seguintes variáveis foram medidas: temperatura, pH, condutividade, alcalinidade, Cl, oxigênio dissolvido, DBO, coliformes fecais, nitrato, fósforo total e sólidos totais. As variáveis oxigênio dissolvido, coliformes fecais e fósforo total, foram as mais críticas para o enquadramento. Foram delimitados grupos de usos da água na bacia e sugeridas classes de qualidade para cada grupo, fornecendo, desta maneira, elementos para auxiliar o gerenciamento da qualidade da água
REFERENCES
Acquaplan (1990), Estudo de impacto ambiental da
barragem do rio Jaboatão, Recife, ACQUAPLAN. Apha - Awwa- Wpcf (1995), Standard methods for the
examination of water and wastewater, 19th ed. American Public Health Association, American Water Works Association, Water Polution Control Federation, Washington, DC, USA.
Barth, F. T. (1999), Aspectos institucionais do gerenciamento de recursos hídricos. In: Rebouças, A. Braga, C. B. and Tundisi, J. G. (eds.). Águas doces do Brasil. São Paulo : Escrituras Editora. pp. 565-599. BRASIL (1986), CONAMA - Conselho Nacional do
Meio Ambiente, Resolução n° 20 de 18/06/1986. Dispõe sobre a classificação das águas doces, salobras e salinas do território nacional.
BRASIL (1997), Lei n° 9433 de 08/01/1997. Institui a Política Nacional de Recursos Hídricos, cria o Sistema Nacional de Gerenciamento de Recursos Hídricos.
CPRH (1995), Relatório Anual de Atividades. Recife : CPRH
.
Dimitrova, I.; Kosturkov, J. and Vatralova, A. (1998), Industrial surface water pollution in the region of Devnya, Bulgaria. Water Science and Technology, 37, 45-53.
Evison, L. M. (1998), Comparative studies on the survival of indicator organisms and pathogens in fresh and sea water. Water Science and Technology, 20, 309-315.
Fidem (1987a), Proteção dos mananciais. Série Desenvolvimento Urbano e Meio Ambiente. Fidem, Recife.
Fidem (1987b), Reservas Ecológicas .Série Desenvolvimento Urbano e Meio Ambiente. Fidem, Recife.
Fidem (1987c), Proteção das Áreas Estuarinas. Série Desenvolvimento Urbano e Meio Ambiente. Fidem, Recife.
Fidem (1995), Mapa da cobertura vegetal da Região
Metropolitana do Recife, escala 1:100.000. Fidem, Recife.
Gama, A. M. C. F., Cavalcanti, D. J. and Farias, V. (1998), O enquadramento e a classificação da qualidade atual dos rios da bacia do rio Pirapama. Simpósio Internacional sobre gestão de recursos hídricos, 5-8 outubro, Gramado, Brasil.
Guaglianoni, L. G. (1998), A remoção de compostos
organoclorados tetraclorocatecol e tetracloroguaniacol contidos em efluentes da industria de papel e celulose. Tese (Doutorado), Universidade de São Paulo, São Carlos, Brasil. Hanes, N. B. and Fragala, R. (1967), Effect of seawater
concentration on survival of indicator bacteria.
Journal of the Water Pollution Control Federation, 39, 97-104.
Leitão, R.C. (1991), Avaliação do processo eletrolítico para remoção de cor devida lignina. Dissertação (Mestrado), Universidade de São Paulo, São Carlos, Brasil.
Maier, M. H. (1977), Estudo da variação sazonal das
condições físicas e químicas ao longo de um trecho do rio Mogi-Guaçu - Cachoeiras de Emas, Estado de
São Paulo. Dissertação (Mestrado), Universidade Federal de São Carlos, São Carlos, Brasil.
Mallin, M. A.; Williams, K. E.; Esham, E. C. and Lowe, R. P. (2000), Effect of human development on bacteriological water quality in coastal watersheds.
Ecological Applications, 10, 1047-1056.
Pegram, G. C.; Quibell, G. and Hinsch, M. (1999), The nonpoint source impact of per-urban settlements in South Africa: implications for their management.
Water Science and Technology, 39, 283-290.
Peters, N. E. and Meybeck, M. (2000), Water quality degradation effects on freshwater availability: impacts to human activities. Water International, 25, 214-221.
Prat, N. and Munné, A. (2000), Water use and quality and stream flow in a Mediterranean stream. Water
Resource, 34, 3876-3881.
Seager, J. (1993), Statutory water quality objectives and river water quality. Journal of the institution of water
and environmental management, 7, 556-563.