Concerted Spatio-Temporal Dynamics of Imported DNA
and ComE DNA Uptake Protein during Gonococcal
Transformation
Heike Gangel1., Christof Hepp1., Stephanie Mu¨ller1., Enno R. Oldewurtel1
, Finn Erik Aas2, Michael Koomey2, Berenike Maier1*
1Department of Physics, University of Cologne, Cologne, Germany,2Department of Biosciences, University of Oslo, Oslo, Norway
Abstract
Competence for transformation is widespread among bacterial species. In the case of Gram-negative systems, a key step to transformation is the import of DNA across the outer membrane. Although multiple factors are known to affect DNA transport, little is known about the dynamics of DNA import. Here, we characterized the spatio-temporal dynamics of DNA import into the periplasm ofNeisseria gonorrhoeae. DNA was imported into the periplasm at random locations around the cell contour. Subsequently, it was recruited at the septum of diplococci at a time scale that increased with DNA length. We found using fluorescent DNA that the periplasm was saturable within minutes with,40 kbp DNA. The DNA-binding protein ComE quantitatively governed the carrying capacity of the periplasm in a gene-dosage-dependent fashion. As seen using a fluorescent-tagged derivative protein, ComE was homogeneously distributed in the periplasm in the absence of external DNA. Upon addition of external DNA, ComE was relocalized to form discrete foci colocalized with imported DNA. We conclude that the periplasm can act as a considerable reservoir for imported DNA with ComE governing the amount of DNA stored potentially for transport through the inner membrane.
Citation:Gangel H, Hepp C, Mu¨ller S, Oldewurtel ER, Aas FE, et al. (2014) Concerted Spatio-Temporal Dynamics of Imported DNA and ComE DNA Uptake Protein during Gonococcal Transformation. PLoS Pathog 10(4): e1004043. doi:10.1371/journal.ppat.1004043
Editor:Gary Dunny, University of Minnesota, United States of America
ReceivedSeptember 30, 2013;AcceptedFebruary 17, 2014;PublishedApril 24, 2014
Copyright:ß2014 Gangel et al. This is an open-access article distributed under the terms of the Creative Commons Attribution License, which permits unrestricted use, distribution, and reproduction in any medium, provided the original author and source are credited.
Funding:HG, CH, SM, and BM were supported by the Deutsche Forschungsgemeinschaft through grants MA3898. The work of MK and FEA was supported in part by Research Council of Norway grants 183613 and 183814 and by funds from the Center for Molecular Biology and Neurosciences of the University of Oslo. The funders had no role in study design, data collection and analysis, decision to publish, or preparation of the manuscript.
Competing Interests:The authors have declared that no competing interests exist.
* E-mail: [email protected]
.These authors contributed equally to this work.
Introduction
Natural competence for transformation is widespread among different bacterial species [1]. Transformation is thought to speed up adaptive evolution but it is also discussed in the context of genome maintenance [2] [3]. The currently available data from Gram-positive species strongly supports the idea of a coordinated DNA transformation machine that binds DNA at the extracellular side, powers translocation of DNA through the cell envelope and hands the DNA over to the recombination machine at the intracellular side [4] [5]. With the only known exception of
Helicobacter pylori, all characterized naturally competent species are associated with the type IV pilus (T4P) system for DNA import. At the extracellular side, T4P proteins are essential for DNA binding although it is unclear whether long pilus filaments are necessary [1]. Whereas DNA binding to the competence pilus has been demonstrated inStreptococcus pneumoniae[6],Neisseria gonorrhoeaethat generate non-retractile T4P show strongly impaired binding efficiency [7]. In the following, the nomenclature ofN. gonorrhoeae
will be used to describe the proteins required for transformation. The major pilin subunit is essential for binding and import of DNA [8] [7] but replacing the gonococcal pilin PilE by the major subunit of Pseudomonas aeruginosa or of Fracisella tularensis
supports DNA import and transformation as well [9,10]. The
transformation rate is modulated by the relative levels of the minor pilins ComP. PilV acts antagonistically at the level of DNA binding with ComP increasing transformability in a dose-dependent fashion and PilV decreasing it [7,11]. PilV appears to exert its inhibitory effects by competing with ComP for access to the Tfp assembly machinery [11]. The presence of a 12 bp DNA Uptake Sequence (DUS) strongly enhances the probability for DNA-import by N. gonorrhoeae [12] [3]. ComP binds DNA in a sequence-specific manner, selecting for DNA containing the DUS [13] [7]. The outer membrane channel formed by PilQ is essential for T4P extrusion and DNA import into a DNase-resistant state and moreover shows DNA-binding potential [14,15]. In the periplasm, three components are linked to transformation. The DNA-binding protein ComE has four identical gene-copies on the gonococcal genome [16]. Gradual deletion of these copies leads to gradual decrease in transformation rate by decreasing the probability for DNA import [16]. The DNA-binding peptidogly-can-linked lipoprotein ComL and the lipoprotein tetrapac (Tpc) which is associated with separation of dividing diplococci are not essential for DNA uptake but for transformation [17] [18]. ComA proteins form the channel through which DNA is transported from the periplasm to the cytoplasm [19]. In the Gram-positive species
strand binding proteins have been proposed to generate a reservoir of ssDNA in the cytoplasm and to direct the DNA to homologous recombination inB. subtilisandStreptococcus pneumoniae[21] [4]. For
N. gonorrhoeaethere is evidence that ssDNA forms transiently in the periplasm [22].
DNA import has been characterized at the single molecule level forB. subtilisandH. pylori[23] [24] [25] [26]. DNA uptake inB. subtilis proceeds at a rate of 80 bp/s at low external forces. Application of force using laser tweezers showed that the import was irreversible for forces up to 50 pN. The speed of DNA import was considerably larger inH. pylori with 1.3 kbp/s at low force. Application of 23 pN or more triggered extrusion of the previously imported DNA here, demonstrating the import into the periplasm is reversible. Transport through the outer and the inner membrane ofH. pyloriare not coupled in time.H. pylori imports fluorescently labeled Cy3-DNA into the periplasm at a somewhat decreased rate relative to unlabelled DNA [24]. Like the case of the ComEC channel based system in B. subtilis, the H. pylori
ComEC-based system does not support transport of Cy3-DNA into the cytoplasm [24], suggesting that the processes for inner membrane transport are analogous between these competent species [27].
In rod-likeB. subtilis, DNA uptake complexes form at the poles or at the growing septa [28] [20]. They are stable even when the cell wall is disrupted [29]. Accordingly, DNA uptake proceeds preferentially from the cell poles. The homologue of gonococcal ComE, ComEA, distributes homogeneously around the cell contour and is thought to enhance initial DNA binding to the cell surface [30] [31].H. pylori accumulates imported Cy3-DNA primarily at the cell poles and at the septa [24]. Very recently, it has been shown that competent Gram-positive S. pneumoniae
recruits Cy3-DNA and ComEA at midcell location [32]. It is unknown, however, where DNA uptake occurs in Gram-negative cocci.
Here, we visualized the spatio-temporal dynamics of DNA during import from the environment into the periplasm and within the periplasm ofN. gonorrhoeae. We validated the approach of using fluorescent Cy3-DNA by characterizing a number of mutant
backgrounds that had been shown to be impaired for DNA uptake. We found that DNA import through the outer membrane occurred all around the cell contour. The periplasm was saturable with DNA and held a considerable amount of Cy3-DNA. With short fragments, saturation occurred on a time scale of minutes. The periplasmic DNA-binding protein ComE strongly affected the carrying capacity of the periplasm, suggesting a role in either removing DNA from the uptake machine or in compacting DNA.
Results
N. gonorrhoeaeimports Cy3-DNA into a DNase-resistant state
To investigate whether Cy3-DNA could be used to study DNA uptake in gonococci, we incubated gonococci with a 3 kbp fragment of Cy3-DNA containing one DNA uptake sequence (DUS) for 30 min and subsequently treated them with DNase. DNA was labeled randomly along its entire contour. Throughout this work, we used a recAind background without induction to prevent the cells from antigenic variation ofpilE. TherecAindstrain will be labeled wt in the following, since it shows wt behavior in terms of DNA import through the cell envelope. Wt cells were associated with fluorescent foci that were clearly distinguishable from the fluorescence background (Fig. S1a), indicating that Cy3-DNA was imported into a DNase-resistant state.
The minor pilins ComP and PilV have been shown to strongly affect DNA uptake at the level of DNA binding [7,11]. We investigated the effect of these minor pilins on the uptake of Cy3-DNA. We performed the DNA uptake assay in a ComP overproducing strain (PpilEcomP) and in a pilV deletion strain (DpilV) (Fig. 1a). As expected, both strains showed a strongly
increased fluorescence signal (Fig. S1b–d), indicating that more Cy3-DNA was imported within 30 min. Since the high signal of the DpilV strain was very convenient for data analysis, we
performed all following experiments in this background. Up until now, DNA uptake by N. gonorrhoeae has been investigated at the population level. Therefore, it is unclear whether there is heterogeneity in this process at the level of single cells. To investigate any potential for heterogeneity, we measured the distribution of DNA uptake efficiencies of individual cells. We incubated gonococci with the 3 kbp Cy3 fragment for 30 min, treated the cells with DNase and subsequently quantified the fluorescence intensity of individual cells (Fig. S2). We found that the distribution of fluorescence intensities was very broad (Fig. 1e). A fraction of cells showed no import of DNA and this fraction was variable between different experiments. Most of the cells in our samples were diplococci. For our analysis we did not distinguish between monococci and diplococci, as the difference in the histograms was visible but small (Fig. S3).
To determine the background level of fluorescence, we repeated the experiment using a strain with a deletion in the retraction ATPase PilT (Fig. 1b) which is unable to import DNA [7]. Furthermore, we investigated apilQdeletion strain that does not form the outer membrane pore, is deficient in DNA uptake, and shows reduced DNA binding (Fig. 1c). We found that both mutations strongly shifted the distribution of fluorescence inten-sities to lower values (Fig. 1e). Although the distributions were very broad we calculated the average fluorescence values (Fig. 1f). We found that in the pilT pilV background strain, the amount of DNase-resistant Cy3-DNA was reduced by a factor of 12 as compared to the DpilV strain and in the DpilQDpilV strain the
amount of DNase-resistant Cy3-DNA was reduced by a factor of 22. The strong decrease in fluorescence is consistent with previous experiments using radioactively labeled DNA although the factors Author Summary
are considerably lower [7,11], suggesting that the Cy3-DNA methodology has reduced sensitivity.
Next, we investigated whether import of Cy3-DNA into a DNase-resistant state was dependent on the putative inner membrane channel formed by ComA (Fig. 1d). When repeating the DNA uptake experiment using a comA deletion strain
(DcomADpilV) we found that the fluorescence distribution was not
significantly different from theDpilVstrain (Fig. 1e, f), indicating
that the imported DNA accumulated in the periplasm. This result was analogous to what was observed previously forH. pylori[24]. Transformation ofN. gonorrhoeaedepends on the DNA uptake sequence (DUS). ComP has been shown to be a positive effector of Figure 1. Cy3-DNA is imported into the periplasm.Gonococci were incubated with Cy3-DNA for 30 min and subsequently treated with DNase. a,b,c,d) Upper line: merged images of brightfield and fluorescence, lower line: fluorescence images. a)DpilV, b)DpilQDpilV, c)DpilTDpilV, d)DcomA DpilV. e) Probability distribution of single cell fluorescence withDpilV(black),DcomADpilV(blue),DpilQDpilV(red),DpilTDpilV(orange),DpilVno DUS (grey). Inset: logarithmic representation. f) Average fluorescence intensity. (N.500 for each condition).
doi:10.1371/journal.ppat.1004043.g001
sequence-specific DNA binding and that it is directly involved in binding of DUS-containing DNA [7] [13]. The DNA uptake assay with fragments lacking the DUS showed strongly reduced fluorescence (Fig. 1e, f). Thus, the uptake of Cy3-DNA was strongly enhanced by the DUS.
We conclude that Cy3-DNA is imported into the periplasm of gonococci and that DUS-related import is dependent on the outer membrane channel formed by PilQ and on the T4P retraction ATPase PilT, but not on the inner membrane channel ComA. Since these results are consistent with previous DNA uptake studies using radioactively labeled DNA, they validate our method for studying DNA uptake using N. gonorrhoeae Cy3-DNA. In contrast to the classic method using radioactively labeled DNA, our approach enables us to study DNA uptake at the single cell level and thus reveals strong cell-to-cell variability in terms of the total amount of DNA imported after 30 min.
The periplasm ofN. gonorrhoeaecan retain ample amounts of imported DNA
We investigated whether the periplasm acts as a reservoir for imported DNA.DpilVcells were incubated with Cy3-DNA for 1 h,
treated with DNase and subsequently single cell fluorescence was measured. The total fluorescence intensity per cell did not vary when incubated with Cy3-DNA with fragment lengths of 0.3 kbp, 1 kbp, and 10 kbp at equimolar concentrations (Fig. 2), indicating that the total amount of imported DNA was independent of fragment length. To convert fluorescence intensity into amount of DNA, we quantified the fluorescence intensity of individual 6 kbp fragments (Fig. S4) [33] and compared them to the total fluorescence of individual cells that were incubated with Cy3-DNA from the same labeling reaction for 1 h. We found that the periplasm contained ,40 kbp of Cy3-DNA. We note that this value might be biased slightly by binding of proteins to the DNA in the periplasm [34]. Furthermore, the Cy3-labeling efficiency is somewhat variable and therefore the fluorescence intensity cannot be directly compared to other experiments using different Cy3-DNA stocks.
Next, we addressed the question whether the periplasm can be saturated with taken up DNA. To this end, we incubated gonococci for 1 h with unlabeled genomic DNA (gDNA) or 3 kbp fragments containing DUS, washed the cells, subsequently incubated them with 3 kbp Cy3-DNA for 30 min and finally treated them with DNase. We found that the distribution of fluorescence intensities was clearly shifted towards lower values when cells were pre-incubated with DNA (Fig. 3a), indicating that
ample amounts of DNA remain within the periplasm during at least 30 min. Deletion of the inner membrane channel ComA did not affect saturation strongly (Fig. 3b). For averaging over the fluctuations in the histogram, we integrated over the distribution of single cell fluorescence (Fig. 3 c,d). This cumulative histogram shows the fraction of cells with fluorescence intensity (FU) up to a given value. Furthermore, we examined the stability and integrity of the imported DNA. Cells were incubated with unlabeled 10 kbp fragments for 1 h, subsequently treated with DNase, and further incubated for various periods of time. Exploiting a protocol recently developed forVibrio cholerae [35], we used duplex PCR with primer pairs against the newly imported 10 kbp fragment and against gDNA of gonococci. We found that the 3 kbp DNA fragments amplified from the imported DNA were clearly detectable even after 60 min after DNase treatment inDpilVand DpilV DcomA backgrounds (Fig. S5). Using wt, the 3 kbp DNA
fragments were still detectable after 30 min. Since the signal was lower for wt cells, we did not attempt to amplify DNA at later time points.
DNA turnover in the periplasm may occur as a consequence of dilution due to cell division, degradation, or export. To address turnover, we incubated cells with Cy3-DNA for 1 h, washed them, and subsequently incubated them for a period of 1 h either in the presence or in the absence of unlabeled DNA. We found that the distribution of fluorescence intensities shifted towards lower values independent of ComA after incubation (Fig. S6 a, b), indicating that turnover occurred and was independent of transport through the inner membrane.
Together, these data show that DNA import through the outer membrane occurs independently of inner membrane transport and that large amounts of DNA can be amassed in the periplasm over a time scale of hours.
Kinetics of Cy3-DNA import into the periplasm
We next investigated the temporal dynamics of Cy3-DNA during DNA uptake by monitoring single DpilV cells during
incubation with 300 bp Cy3-DNA in real-time. The fluorescence intensity per cell showed a saturating kinetics with FU(t) =
FU-max(12exp(2t/t))witht= (4.560.6) min (Fig. 4 a, b, Movie S1). FUmaxis a measure for the total amount of Cy3-DNA that can be imported into the periplasm. Cy3-DNA tended to accumulate at the septa of diplococci. To test whether the kinetics characterized binding or import of Cy3-DNA, we repeated the experiment in
DpilTDpilVand DpilQDpilVbackgrounds. During 30 min, we did
not detect an increase in fluorescence intensity (Fig. 4 c), demonstrating that Cy3-DNA was imported with a characteristic time of 4.5 min in theDpilVstrain.
In conclusion, the periplasm saturates with short Cy3-DNA fragments within minutes.
ComE quantitatively increases the total amount of Cy3-DNA imported into the periplasm
It has been shown previously that ComE is necessary for DNA uptake into a DNAse-resistant state and transformation [16]. We investigated whether ComE acted by increasing the carrying capacity of the periplasm or by speeding up DNA import. To this end, we generated isogenic backgrounds varying in comE copy number. Since the amount of imported Cy3-DNA was similar for the backgrounds with four and three copies and for one or nocomE
copies (Fig. S7), we concentrated on strains with two (DcomE34)
versus no (DcomE1234) alleles in the following. In a first set of
experiments, we incubated DpilV cells with 3 kbp DNA for
variable amounts of time before treating them with DNase (Fig. 5 a,b). Comparing the patterns formed inDpilVandDcomE34DpilVat
various time points did not reveal a striking difference. For example, at 1 h both mutants showed multiple foci (Fig. 5 c, d). The kinetics could be well described by a single exponential functionFU(t) = FUmax(12exp(2t/t)) (Fig. 5e). In theDcomE34
D-pilVstrain, that carries two copies of thecomEgene, the capacity was decreased by a factor of,3 as compared to theDpilVstrain (Fig. 5g). The complete comE deletion strain DcomE
1234DpilV showed a decrease of fluorescence intensity by a factor of ,24. This reduction is similar to the reduction in apilQdeletion strain in agreement with ComE being necessary for DNA uptake. We note, however, that residual fluorescence was observed in some cells. The characteristic time to saturation wast= (100617) min inDpilV. If ComE would enhance the speed of DNA import, then
we would expect that reduction of the ComE concentration leads to an increase in the characteristic time. Instead, we observed a decrease tot= (62612) min inDcomE34DpilV(Fig. 5f).
Since we found that ComE increased the carrying capacity of the periplasm, we tested whether ComE was necessary for importing very short DNA fragments of 100 nm. Since Cy3-DNA import showed saturation within minutes, we quantified single cell fluorescence in real-time during incubation with 300 bp Cy3-DNA (Fig. 6). We found that Cy3-DNA import of short fragments was dependent on ComE. A fullcomEnull mutant did not show any increase in fluorescence, indicating that ComE was essential for Cy3-DNA import. The saturating fluorescence intensity Fmax was strongly decreased in the DcomE34 strain,
confirming that ComE quantitatively controls the carrying capacity of the periplasm.
ComE-mCherry relocalizes to DNA-foci
As Cy3-DNA was not homogeneously distributed within the periplasm (Fig. 1), we investigated whether the periplasmic DNA-binding protein ComE co-localized with DNA. To this end, we generated a strain in which one of thecomEgenes was fused to an
mcherryORF. In the absence of transforming DNA, ComE-mCherry showed a mostly ring-like distribution, indicating that it was homogeneously distributed within the periplasm (Fig. S8a). Some cells showed pronounced foci which were most often located at the septa between the cocci of diplococci. To test whether these foci arouse from DNA that was present due to lysed cells, we incubated cells with DNase for 30 min and subsequently let the bacteria grow for three generations in liquid culture. Upon this treatment, the foci disappeared almost completely revealing homogeneous distribution of ComE-mCherry in the periplasm (Fig. S8b, Fig. 7a).
In the next step, we incubated thecomE-mcherryDpilVcells with
3 kbp Cy5-DNA for 15 min. The distribution of mCherry-fluorescence became spotty, often revealing distinct foci (Fig. 7b, c), reminiscent of the fluorescence pattern generated by imported Cy5-DNA. The patterns of Cy5-DNA and ComE-mCherry were highly correlated, indicating co-localization between ComE and imported DNA (Fig. 7 b, c). Most cells that had little or no Cy5-Figure 3. Pre-incubation with DNA inhibits uptake of Cy3-DNA.a) Probability distribution of the total fluorescence intensity of individual
DpilVcells after 30 min incubation with Cy3-DNA following incubation with no DNA (black), gDNA (red), 3 kbp fragments (grey). b) Probability distribution of the total fluorescence intensity of individualDcomADpilVafter 30 min incubation with Cy3-DNA following incubation with no DNA
(black), gDNA (red), 3 kbp fragments (grey). c) and d) are the cumulative histograms of a) and b), respectively. (N.1000 for each condition). doi:10.1371/journal.ppat.1004043.g003
DNA signal retained their ring-like ComE-mCherry fluorescence (e.g. Fig. 7 b inset).
In summary, ComE-mCherry is homogenously distributed in the periplasm in the absence of transforming DNA. Imported DNA forms foci in the periplasm and co-localization of ComE indicates that the periplasmic DNA interacts with ComE.
Spatio-temporal dynamics of Cy3-DNA foci and ComE-mCherry in the periplasm
We investigated the spatio-temporal dynamics of the foci/spotty pattern of Cy3-DNA in the periplasm. To determine the initial location of Cy3-DNA after import, we acquired a time lapse of 10 kbp Cy3-DNA import. Individual 6 kbp Cy3-fragments are clearly visible (Fig. S4). Indeed, we observed the successive appearance of well-defined fluorescent spots correlated with a step-wise increase of fluorescence intensity (Fig. 8 a–d). These foci showed little movement over a time scale of 60 min (Movies S2, S3). To investigate whether there was a preferred location of DNA import (as reported for B. subtilis), we projected the location of initial occurrence to the major axis of a diplococcus and normalized this distance to the cell length (1 min time resolution). Only diplococci were analysed in order to find the location relative
to the septum. We found no preferred location of DNA uptake (Fig. 8e). Using DNA that was labeled with the reversibly intercalating dye YOYO, we repeated the experiment. Again, no preferential location of YOYO-DNA foci was observed (Fig. 8e).
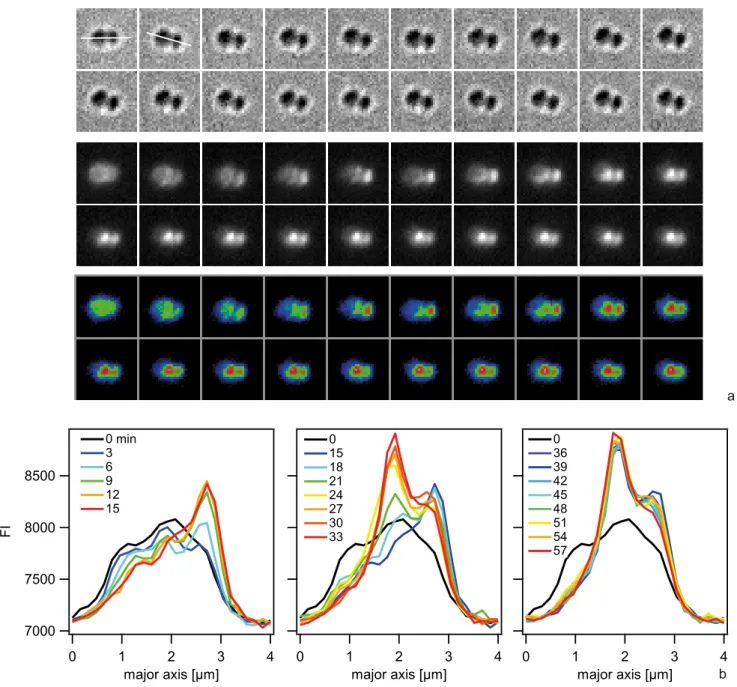
Next, we investigated the spatio-temporal dynamics of ComE-mCherry during exposure to unlabeled 10 kbp transforming DNA. These experiments were performed at 37uC and therefore the image quality was not comparable to Fig. 7. Initially, the fluorescence intensity was homogeneous or ring-like (Fig. 9, Movie S4). Spontaneously, the fluorescence accumulated to form a focus whereas the fluorescence in the reminder of the cell decayed. The intensity of the focus increased for,10 min and was then stable. At 18 min a second focus appeared again taking,15 min to reach its maximum intensity. This second focus was stable for another 30 min. Monococci also formed stable multiple foci (Movie S5). This experiment indicates that the formation of stable foci is not caused by fluorescence labeling of DNA.
To characterize the distribution of focus location, we optimized the imaging conditions using a camera with higher pixel density and we imaged at room temperature.DpilVcells were incubated
foci around the cell contour (Fig. 10a). We wrote an algorithm that detected diplococci, defined the cell contour, aligned them, and normalized the cell sizes. With this algorithm, the two-dimensional probability distribution of focus location was plotted (Fig. 10b). We found that foci were located all around the cell contour with a slight bias towards the20.5/0.5 position for long fragments. To assess whether particularly bright foci had a different distribution, we plotted the distribution of the 10% brightest foci (Fig. 10c). Very clearly, the 300 bp fragments accumulated at the septa between the cocci, in agreement with Fig. 4a. Finally, we assessed the distribution of 3 kbp Cy3-DNA in wt cells. Again we found that foci formed (Fig. 10 d,e). Although the total number of foci was low, we found that foci were distributed all around the cell contour.
To test whether there is re-organization of long Cy3-DNA over longer periods of time, we incubated cells for 1 h with 3 kbp Cy3-DNA fragments, washed them and subsequently incubated with unlabeled DNA. We found that the fraction of cells showing
central foci increased strongly with time (Fig. 11a, b, c). This behavior was independent of ComA. Time lapse microscopy revealed formation of central foci (Fig.11d, Movie S6) and movement of central foci (Fig. 11d). When cells were incubated for one hour without unlabeled DNA, the pattern did not change significantly (Fig. 11b, c).
In summary, our data strongly suggests the following spatio-temporal dynamics. Transforming DNA is imported at random locations. DNA fragments form foci with associated ComE that are recruited at the septa. The time scale of recruitment depends on DNA length.
Discussion
Putative role of the periplasmic protein ComE
We have shown that ComE-mCherry is homogeneously distributed within the periplasm in the absence of transforming DNA, i.e. after DNase treatment and prolonged incubation in Figure 5. Dynamics of 3 kbp Cy3-DNA import depends on ComE.a, b) Probability distribution of the total fluorescence intensity of individual a)DpilVand b)DcomE34DpilVas a function of time. c, d) Typical fluorescence images after 1 h for c)DpilVand d)DcomE34DpilV. e) Average
fluorescence intensity per cell as a function of time with 3 kbp Cy3-DNA forDpilV(black circles),DcomE34DpilV(red triangles),DcomE1234DpilV(grey
squares). Full lines: fits to exponential function. f) Saturation value for average fluorescence intensity per cell obtained from fits in e). g) Characteristic times obtained from fits in e). (N.1500 for each condition).
doi:10.1371/journal.ppat.1004043.g005
liquid culture. When harvested without DNase treatment, a fraction of cells showed foci that were mostly at the septa between cocci. This finding strongly suggests that gonococci accumulate DNA presumably released by lysis of siblings or by secretion in the periplasm while growing in microcolonies. Most importantly, upon addition of Cy5-DNA, ComE-mCherry localized to the Cy5-DNA foci. These experiments demonstrate that ComE is free to move within the periplasm and is captured by periplasmic DNA. While this manuscript was in revision, it has been reported that the homolog ComEA-mCherry diffuses rapidly in the periplasm ofV. cholerae and co-localizes with YOYO-DNA [36]. Together with experiments showing that expression of N. gonorrhoeae-comE can restore functionality in a V. cholerae-comEA deletion mutation, ComE-dependent DNA-import into the periplasm can be considered a general mechanism for Gram-negative competent species. Our data further show that association of ComE-mCherry with Cy5-DNA is not a transient phenomenon but that ComE remains associated with periplasmic DNA. Interestingly, the homologue of ComE in B. subtilis, ComEA, is the only known competence protein that does not localize to the cell pole [28]. It has been suggested, that ComEA molecules sequester DNA all around the cell shuffling the DNA to the site of DNA uptake where the rate-limiting step of DNA import occurs [29]. Similarly, in gonococci ComE is likely to compact DNA and to increase the capacity of the periplasmic reservoir.
Indeed, we found that ComE quantitatively governed the carrying capacity of the periplasm. Since the length of the imported DNA fragments did not influence the carrying capacity, we conclude that the ComE concentration is a limiting factor for the amount of DNA that the periplasm can hold. With a height of ,20 nm [37] and a cell radius of,0.4mm, the periplasm has a volume of ,3?1025mm3. Considering a 10 kbp DNA fragment
and assuming no excluded volume interactions, the volume of the statistical coil with a radius of gyration of 235 nm assumes ,5?1022mm3, indicating that energy must be spent for packaging the DNA. To assess whether the function of ComE is to package the DNA, we incubated gonococci with DNA fragments of the order of the Kuhn segment length of 100 nm (300 bp). The Kuhn segment length is a measure for the stiffness of the polymer, in other words it describes over which length the polymer can be bent by Brownian motion. We found, however, that ComE was essential for the import of 300 bp fragments into the periplasm. Mechanistically, we propose that during DNA import, DNA binds weakly to the machine that pulls the DNA through the outer membrane. To render the import irreversible ComE binds to the incoming DNA and hinders its backward movement, generating a translocation ratchet [26]. Additionally, ComE might compact the DNA beyond its Kuhn segment length of 100 nm.
Spatio-temporal dynamics of DNA import and maintenance within the periplasm
Using DNA fragments with a length of 10 kbp, we found that Cy3-DNA foci occurred at random locations around the cell contour. As the time resolution of our time-lapse acquisition was 1 min, this location most likely coincides with the location of import through the outer membrane. The 10 kbp DNA fragments did not show strong mobility over the period of 30 min. The stochastic distribution of DNA import complexes correlates with the distribution of T4P in gonococci [38], supporting the idea that DNA directly interacts with components of the T4P system. However, we did not observe T4P-like structures coated with Cy3-DNA during real-time experiments. Therefore, we cannot draw conclusions about the potential role of T4P fibers directly in DNA Figure 6. Dynamics of 300 bp Cy3-DNA import depends on ComE.a) Time lapse of binding and import byDcomE34DpilV. Upper line:
brightfield image, middle line: fluorescence image, lower line: pseudocolored intensity image.Dt = 2 min. b) Single cell kinetics forDpilV(black
circles),DcomE34DpilV(red triangles),DcomE1234DpilV(grey squares). Full lines: fits to exponential function. c) Average saturation value for fits as in
uptake. This result strongly suggests that multiple DNA import complexes exist and are distributed around the cell contour. InB. subtilisandH. pylori, DNA import was found to be localized either
to the cell pole or to the septum [28] [16] [24]. InB. subtilis, one or two DNA import complexes or accumulations of the latter were stable even when the cell wall was dissolved resulting in cellular Figure 7. ComE-mCherry colocalizes with the spotty pattern of Cy5-DNA.comE-mcherrycells were incubated with a) no DNA, b, c) 10 kbp Cy5-DNA fragments for 15 min and visualized. Scale bars: 2.5mm, insets: 26magnification.
doi:10.1371/journal.ppat.1004043.g007
deformation to a round morphology [29]. Mostly single T4P pili were found inV. choleraethat were randomly located around the cell contour [39]. Here, we found that DNA was imported from multiple sites in a single bacterium. We speculate that bacteria that use T4P uniquely for DNA import may form a single pilus, whereas N. gonorrhoeae is a peritrichously piliated bacterium in agreement with multiple DNA import sites reported here.
Interestingly, when cells were incubated with 3 kbp Cy3-DNA and subsequently with unlabeled DNA, Cy3-DNA foci tended to
move to septa of diplococci. These dynamics were observed only in the presence of unlabeled transforming DNA. Similar central accumulations were observed with 300 bp Cy3-DNA after several minutes. One possible explanation would be that newly incoming DNA pushes the previously imported DNA away from the sites of DNA uptake. The local accumulation of periplasmic DNA is somewhat reminiscent of DNA-filled membrane blebs that have been termed ‘‘transformasome’’ inHaemophilus influenzae[40,41]. In TEM-images these membrane-blebs were found at a 106 Figure 8. Dynamics of focus formation (DpilV) with 10 kbp fragments of Cy3-DNA.a, c) Examples for time lapse of binding and import. Upper line: brightfield image, middle line: fluorescence image, lower line: pseudocolored intensity image.Dt = 3 min b, d) Fluorescence intensities of
cells shown in a, c). e) Distribution of initial location of Cy3-DNA foci normalized to length of diplococcus. Black circles: Cy3-DNA, red squares: YOYO-DNA.
doi:10.1371/journal.ppat.1004043.g008
Figure 9. Spatio-temporal dynamics of ComE-mCherry upon addition of 10 kbp transforming DNA.a) Time-lapse of ComE-mCherry dynamics. Upper line: brightfield image, middle line: fluorescence image, lower line: pseudocolored intensity image. The line denotes the major axis.
Dt = 3 min. b) Intensity profiles through the major axis at different time points.
doi:10.1371/journal.ppat.1004043.g009
Figure 10. Spatial distribution of Cy3-DNA foci after 15 min of exposure to transforming Cy3-DNA inDpilV and wt.a) Typical examples of Cy3-DNA single cell fluorescence for different fragment lengths (DpilV). The white line denotes the cell contour as obtained from the
bright field image. b) Two-dimensional distribution of focus location (DpilV). The color encodes the probability for finding a focus within the 2D bin. (N.18000 for each condition). c) Two-dimensional distribution 10% brightest foci (DpilV). d, e) Typical examples of Cy3-DNA single cell fluorescence
increased frequency in competent versus non-competent H. influenzae. These sites were proposed to be the sites of DNA-import. The lipoprotein Tetrapac (Tpc) is essential for transformation and deletion of this putative murein hydrolase shows a severe defect in cell separation generating tetrapacs instead of diplococci [18]. It is reasonable to assume that Tpc acts at the septum by hydrolyzing the cell wall. Periplasmic DNA would then be trapped at the septum location where Tpc degrades the cell wall. Furthermore, DNA was shown to bind to FtsE which is believed to be involved in cell division through interaction with FtsZ which localizes to the septum [42]. Very recently, it has been shown that the pneumococcal EndA nuclease localizes to the midcell upon induction of competence [32]. Interestingly, fluorescently labeled Cy3-DNA also localized to the midcell of competent pneumococci, suggesting that active uptake occurs at this location. Furthermore,
they found that midcell localization was independent of comEC
expression in agreement with our finding that midcell localization was independent of comA. It is tempting to speculate that recruitment of DNA to the site of future cell division is a general property of competent cocci although it is currently unclear whether this accumulation is linked to DNA transport through the inner membrane.
Power and limitations of the Cy3-DNA approach Here we have introduced a novel approach for studying the spatio-temporal dynamics of DNA import in Gram-negative species at the single cell level. So far, DNA import has been mostly studied at the population level. We have verified that the static properties agree with previous reports using radioactively labeled DNA, including the effect of the outer membrane pore [7], the inner Figure 11. Redistribution of 3 kbp Cy3-DNA. a) Typical example after 1 h incubation with Cy3-DNA and subsequent washing. Left: superposition of brightfield and fluorescence image, right: fluorescence image. b) Typical example of the same sample after washing and subsequent incubation with unlabeled DNA for another 1 h. left: superposition of brightfield and fluorescence image, right: fluorescence image. c) Fraction of cells with foci at septum directly after 60 min incubation with Cy3-DNA, after 60 min incubation with medium, and after 60 min incubation with unlabeled DNA. black:DpilV, grey:DcomADpilV. (N.1000 for each condition) d) Time-lapse of central focus formation and movement. Upper line:
brightfield image, middle line: fluorescence image, lower line: pseudocolored intensity image. The arrow denotes the timepoint where the focus moves.Dt = 6 min.
doi:10.1371/journal.ppat.1004043.g011
membrane channel [17], the minor pilins [7,11], and the periplasmic proteins [16]. We have previously quantified the effect of Cy3-labels on the speed of DNA-import inH. pyloriand found that the import speed was decreased by a factor of ,2 [24]. Considering that DNA import depends on the pore formed by PilQ and that its inner opening is wide enough to allow translocation of the type IV pilus, we do not expect that the speed of DNA import is strongly influenced by the Cy3-label. One clear limitation of our approach is the fact that Cy3-DNA is not transported into the cytoplasm and as a consequence, transport through the inner membrane cannot be characterized. However, we performed saturation experiments using unlabeled DNA, to verify that accumulation of DNA in the periplasm is not caused by Cy3-labeling. When cells were pre-incubated with unlabeled genomic DNA or with PCR-fragments for 1 h, the fluorescence signal obtained after subsequent incubation with Cy3-DNA was strongly reduced. This experiment verifies that massing of DNA within the periplasm occurs with unlabeled DNA and is not caused by Cy3. Moreover, ComE-mCherry foci formed after treatment with unlabeled transforming DNA and were stable for up to 30 min. This experiment further supports the claim that stable periplasmic DNA foci are not caused by Cy3-labeling. Previous experiments with H. pylori showed that YOYO-DNA was imported into the periplasm [24]. Here, we found YOYO-DNA binding to the gonococcal surface, but the signal was lost upon DNase treatment (data not shown). This finding might be caused either by rapid formation of ssDNA in the periplasm, by expulsion of the dye from dsDNA due to DNA compaction in the periplasm, or by quenching. Most experiments were performed in apilVdeletion background to facilitate imaging. This strain has been reported to show a strong increase in the level of both DUS-specific DNA uptake and in the rate of transformation [11]. Thus, transport through the inner membrane is not the only bottleneck for transformation and the accumulation of DNA in the periplasm is not likely to be caused by
pilVdeletion. Our experiments show that the gonococcal periplasm is saturable with DNA in a ComE-dependent manner, but it remains unclear, whether the wt reaches saturation. However, within biofilms, gonococci are surrounded by a large amount of genomic DNA and a high abundance of DUS [43]. Being continuously exposed to large amounts of DUS containing DNA and potentially dividing at a much lower rate, it is conceivable, that saturation is achieved by the wild type in biofilms. In our experiments, the Cy3-DNA fragments contained only a single DUS, however the deletion ofpilVincreases DUS-dependent binding and uptake, so using the
pilVmutant in our experimental setup is most likely mechanistically not very different to the wildtype situation in biofilms. Concerning the molecular mechanism of DNA import, the pilVstrain is not different to that seen in wt backgrounds as DNA import depends on
pilE,pilT, DUS, and on assembled pili [11]. In wt gonocoocci, the distribution of DNA-foci was similar to theDpilVbackground and
imported DNA was stable as well. All things considered, we propose that Cy3-labeling of DNA is a useful tool for studying the spatio-temporal dynamics of DNA import into the periplasm.
Conclusion
Our results support the following spatio-temporal dynamics of DNA uptake. DNA transport through the outer membrane is powered by DNA uptake complexes that are randomly distributed over the cellular contour. The periplasmic DNA-binding protein ComE is homogeneously distributed in the periplasm in the absence of DNA. Upon contact with periplasmic DNA, it relocalizes to foci formed by DNA. The carrying capacity of the gonococcal periplasm for DNA depends on ComE in a gene-dosage-dependent fashion. Nanomanipulation experiments
will be necessary to investigate whether ComE has an additional role in directly driving DNA-import through the outer membrane. When external DNA is present, the periplasmic DNA is relocated to septa of diplococci. It is tempting to speculate that midcell/ septum location of transport through the cytoplasmic membrane is conserved between Gram-positive and Gram-negative cocci. It will be interesting to assess whether the location of inner membrane transport is at the septum.
Materials and Methods
Bacterial strains and growth conditions
N. gonorrrhoeae(Table S1) was grown overnight at 37uC and 5% CO2on agar plates containing gonococcal base agar (10 g/l Bacto agar (BD Biosciences, Bedford, MA, USA), 5 g/l NaCl (Roth, Darmstadt, Germany), 4 g/l K2HPO4 (Roth), 1 g/l KH2PO4 (Roth), 15 g/l Proteose Peptone No. 3 (BD), 0.5 g/l soluble starch (Sigma-Aldrich, St. Louis, MO, USA)) and the following supple-ments: 1 g/l D-Glucose (Roth), 0.1 g/l L-glutamine (Roth), 0.289 g/l L-cysteine-HCL6H20 (Roth), 1 mg/l thiamine pyro-phosphate (Sigma-Aldrich), 0.2 mg/l Fe(NO3)3 (Sigma-Aldrich), 0.03 mg/l thiamine HCl (Roth), 0.13 mg/l 4-aminobenzoic acid (Sigma-Aldrich), 2.5 mg/l b-nicotinamide adenine dinucleotide (Roth) and 0.1 mg/l vitamin B12 (Sigma-Aldrich). Before each experiment gonococcal colonies were resuspended in GC-medium.
Construction of mutant strains
DpilQDpilV,DpilTDpilV, andDcomADpilVwere constructed by
transforming genomic DNA from existing deletion mutants in the N400 background into GV1 (DpilV) [44] (Table S1). The genomic
DNA was isolated from GQ21 [45], GT17 [46] and DcomA
(derived by transformation of N400 with the DcomA allele
originally detailed in Facius and Meyer 1993 [19]). The constructions of the DcomE strains are described in the
Supple-mentary Methods (Text S1). Antibiotics and IPTG were used at the following concentrations: 50mg/ml kanamycin (Roth), 50mg/ ml apramycin (Sigma-Aldrich), 2.5mg/ml erythromycin (
Sigma-Aldrich), 10mg/ml chloramphenicol (Roth), 40mg/ml spectinomy-cin (Sigma-Aldrich), 2mg/ml tetracyclin (Roth), 1 mM IPTG (Roth).
DNA-labeling
The covalent attachment of Cy3 and Cy5 dyes to DNA was achieved with the help of the Label IT Nucleic Acid Labeling Kits
(Mirus). According to the manufacturer, the Label IT reagent is bound by a reactive alkylating group to any reactive heteroatom of the DNA without altering the structure of the nucleic acid. The labeling reagent, labeling buffer and 5mg of DNA were mixed in Milli-Q-H2O to a total volume of 50ml according to the manufacturer’s protocol with a 1:1 (v/w) ratio of Label IT reagent to DNA. The incubation time at 37uC was elongated to 2 h to improve the labeling density. The samples were purified subse-quently by using the provided microspin columns. For comparative quantifications, only labeled DNA from the same labelling reaction was used. YOYO-1-iodide (Invitrogen) is a dimeric cyanine with a highly specific affinity to bind to DNA. Due to its structure, it can easily intercalate between single base pairs, modifying the DNA less than covalently attached dyes. We used a dye:bp ratio of 1:50. For this, 1mg of DNA in 10ml Milli-Q-H2O was mixed with 0.3ml of a freshly diluted 0.1 mM YOYO solution in Milli-Q-H2O.
DNA uptake assays
and 7 mM MgCl2) to an OD600of 0.1. Cy3- or YOYO-labeled PCR-fragments were added to the cell suspension to a final concentration of 1 ng/ml. The cells were incubated with DNA at 37uC with 5% CO2 and subsequently treated with 10 U DNAse I (recombinant,
Fermentas) for further 15 min at 37uC. 50ml of this dilution were applied to cover slides for microscopic analysis. For each comparative experiment, the different strains or conditions were characterized on the same day using the same stock of labeled DNA. Each condition was characterized independently on at least three different days.
Microscopy and quantitative analysis of single cell fluorescence
All fluorescence quantification and real-time experiments were conducted at an inverted microscope (Eclipse TE2000 Nikon) in epi-fluorescence mode at 37u. A 120 W metal halogenide fluorescence lamp (X-Cite,EXFO) served as illumination source. Images were taken with an EMCCD camera (Cascade II:512,
Photometrics). The 1006oil immersion CFI Plan Fluor objective (NA 1.3,Nikon) was used in all applications. Day to day variations in the brightness of the fluorescence lamp were detected by using the test beads on theFocal Check Fluorescence Microscope Test Slide#3
(Invitrogen). The intensities from day to day stayed relatively stable with no more deviations than610%. A correction factor to this reference intensity was calculated for every day and was applied to the respective data sets. The analysis is described in the Supplementary Methods (Text S1) and Fig. S2.
For localization experiments an inverted microscope (TI-E
Nikon) was used at room temperature. A 120 W metal halogenide fluorescence lamp (Intensilight Nikon) served as illumination source. Images were taken with a CCD camera (Orca 2.3
Hamamatsu) that had a high pixel density for Cy3-DNA focus distribution. For ComE-mCherry/Cy5-DNA co-localization, an EMCCD camera (IXON X3897Andor) was used.
Real-time quantification of DNA import
Cells selected for piliation were grown on a GC agar plate for
,20 h, harvested, resuspended in DNA-uptake-medium and adjusted to OD600= 0.01–0.02. 150ml of the suspension were applied to a polystyrene-coated coverslip inside a microscopy chamber and incubated 10 min on the microscope stage. Subsequently, 1.4mg of 300 bp Cy3-DNA diluted in 100ml DNA-uptake-medium was added and DNA uptake was recorded for 60 min. To control for DNA bound to the exterior of the cells, 10 U/ml of DNaseI (Fermentas) was added and fluorescence intensity was recorded for another 15 min.
Supporting Information
Figure S1 The minor pilins PilV and ComP differen-tially influence the amount of imported Cy3-DNA.Upper line: merged images of brightfield and fluorescence, lower line: fluorescence images. Gonococci were incubated with Cy3-DNA for 30 min and subsequently treated with DNase. a) wt with enhanced contrast, b) wt with contrast adjusted to c, d. c)PpilEcomP, d)DpilV. (EPS)
Figure S2 Quantification of single cell fluorescence. a) Cells are automatically detected in the bright-field channel and accepted (green squares) or rejected (red squares) depending on shape or distance to neighbors. b) Regions of interest (ROIs) of size 30630 pixel are taken about the center of each bacterium for single cell analysis. Left: brightfield, center: fluorescence, right: merge. c) Blue bars: Histogram of intensity of individual pixels in ROI (30630). The local background is determined by a gauss fit
over the intensity distribution inside each ROI (red line). After background subtraction the sum over all pixel values inside a ROI gives the value for single cell fluorescence.
(EPS)
Figure S3 Comparison between monococci and diplo-cocci. Quantification of total single cell fluorescence after incubation with 3 kbp Cy3-DNA for 30 min.
(EPS)
Figure S4 Quantification of imported Cy3-DNA. a) Typical image of single 6 kbp Cy3-DNA fragments immobilized on a cationic lipid membrane [33]. Blue squares: ROI for fluorescence signal of single DNA fragment, yellow squares: ROI for background subtraction for adjacent DNA fragment. b) Grey: Distribution of fluorescence intensities of single 6 kpb Cy3-DNA. Full line: Gaussian fit with a center of mass of (60106120) FU. c) Grey: Distribution of single cell fluorescence after incubation of the
DpilVstrain with 6 kbp Cy3-DNA from the same batch for 1 h. Full
line: Gaussian fit with a center of mass of (396216586) FU. (EPS)
Figure S5 Duplex PCR of imported DNA.Imported DNA fragments were amplified at varying time periods after DNase treatment for a)DpilVb) wt.
(EPS)
Figure S6 Turnover of Cy3-DNA in the periplasm. Gonococci were incubated for 1 h with 3 kbp Cy3-DNA (black), washed, and subsequently treated with no DNA (grey) or unlabeled DNA (red) for 1 h. Cumulative histograms of fluores-cence intensities of individual cells for a)DpilV, b)DpilVDcomA.
(EPS)
Figure S7 Fluorescence distribution of individual cells with varyingcomEexpression.a) After 1 h incubation with 3 kbp Cy3-DNA. b) DpilVc) DpilV DcomE34 d)DpilV DcomE1234
after varying periods of incubation with 3 kbp Cy3-DNA. (EPS)
Figure S8 Distribution of ComE-mCherry in the ab-sence of transforming DNA. a) Example of mCherry-Fluorescence and intensity plots through the fluorescence images along the two axes indicated in red. b) When cells were scratched from the agar plate and imaged directly, some cells showed foci which were most often located at the septum between the cocci. When cells were treated with DNase for 30 min and subsequently grown for three generations, the foci disappeared almost completely. (EPS)
Movie S1 Example for dynamics of focus formation (DpilV) with 0.3 kbp fragments of Cy3-DNA.Left: bright-field, right: fluorescence withDt = 1 min (Fig. 7a).
(AVI)
Movie S2 Example for dynamics of focus formation (DpilV) with 10 kbp fragments of Cy3-DNA. Left: bright-field, right: fluorescence withDt = 1 min (Fig. 6a).
(AVI)
Movie S3 Example for dynamics of focus formation (DpilV) with 10 kbp fragments of Cy3-DNA. Left: bright-field, right: fluorescence withDt = 1 min (Fig. 6b).
(AVI)
Movie S4 Spatio-temporal dynamics of ComE-mCherry during exposure to unlabeled DNA (diplococcus). Left: brightfield, right: fluorescence withDt = 1 min. (corresponding to Fig. 9).
(AVI)
Movie S5 Spatio-temporal dynamics of ComE-mCherry during exposure to unlabeled DNA (monococcus). Left: bright-field, right: fluorescence withDt = 1 min.
(AVI)
Movie S6 Redistribution of Cy3-DNA foci.Left: brightfield, right: fluorescence withDt = 3 min. (corresponding to Fig. 11d).
(AVI)
Text S1 Supplementary Methods.Description experimental methods and data analysis.
(PDF)
Acknowledgments
We are grateful to Katja Henseler, Thorsten Volkmann, and Jan Ribbe for experimental support. We thank Ines Chen for providing genomic DNA and Juan Alonso for helpful discussions.
Author Contributions
Conceived and designed the experiments: HG CH SM ERO BM. Performed the experiments: HG CH SM. Analyzed the data: HG CH SM ERO. Contributed reagents/materials/analysis tools: FEA MK. Wrote the paper: HG CH SM ERO FEA MK BM.
References
1. Chen I, Dubnau D (2004) DNA uptake during bacterial transformation. Nat Rev Microbiol 2: 241–249.
2. Baltrus DA (2013) Exploring the costs of horizontal gene transfer. Trends in ecology & evolution 28: 489–495.
3. Frye SA, Nilsen M, Tonjum T, Ambur OH (2013) Dialects of the DNA uptake sequence in Neisseriaceae. PLoS genetics 9: e1003458.
4. Maier B (2012) Competence and transformation. In: Graumann PL, editor. Bacillus, Cellular and molecular biology. Norfolk: Caister Academic Press. 5. Kidane D, Ayora S, Sweasy JB, Graumann PL, Alonso JC (2012) The cell pole:
the site of cross talk between the DNA uptake and genetic recombination machinery. Critical reviews in biochemistry and molecular biology 47: 531–555. 6. Laurenceau R, Pehau-Arnaudet G, Baconnais S, Gault J, Malosse C, et al. (2013) A type IV pilus mediates DNA binding during natural transformation in Streptococcus pneumoniae. PLoS pathogens 9: e1003473.
7. Aas FE, Wolfgang M, Frye S, Dunham S, Lovold C, et al. (2002) Competence for natural transformation in Neisseria gonorrhoeae: components of DNA binding and uptake linked to type IV pilus expression. Mol Microbiol 46: 749– 760.
8. Long CD, Tobiason DM, Lazio MP, Kline KA, Seifert HS (2003) Low-level pilin expression allows for substantial DNA transformation competence in Neisseria gonorrhoeae. Infection and immunity 71: 6279–6291.
9. Winther-Larsen HC, Wolfgang MC, van Putten JP, Roos N, Aas FE, et al. (2007) Pseudomonas aeruginosa Type IV pilus expression in Neisseria gonorrhoeae: effects of pilin subunit composition on function and organelle dynamics. Journal of bacteriology 189: 6676–6685.
10. Salomonsson E, Forsberg A, Roos N, Holz C, Maier B, et al. (2009) Functional analyses of pilin-like proteins from Francisella tularensis: complementation of type IV pilus phenotypes in Neisseria gonorrhoeae. Microbiology 155: 2546– 2559.
11. Aas FE, Lovold C, Koomey M (2002) An inhibitor of DNA binding and uptake events dictates the proficiency of genetic transformation in Neisseria gonor-rhoeae: mechanism of action and links to Type IV pilus expression. Mol Microbiol 46: 1441–1450.
12. Goodman SD, Scocca JJ (1988) Identification and arrangement of the DNA sequence recognized in specific transformation of Neisseria gonorrhoeae. Proc Natl Acad Sci U S A 85: 6982–6986.
13. Cehovin A, Simpson PJ, McDowell MA, Brown DR, Noschese R, et al. (2013) Specific DNA recognition mediated by a type IV pilin. Proceedings of the National Academy of Sciences of the United States of America 110: 3065–3070. 14. Drake SL, Koomey M (1995) The product of the pilQ gene is essential for the biogenesis of type IV pili in Neisseria gonorrhoeae. Molecular microbiology 18: 975–986.
15. Assalkhou R, Balasingham S, Collins RF, Frye SA, Davidsen T, et al. (2007) The outer membrane secretin PilQ from Neisseria meningitidis binds DNA. Microbiology 153: 1593–1603.
16. Chen I, Gotschlich EC (2001) ComE, a competence protein from Neisseria gonorrhoeae with DNA-binding activity. J Bacteriol 183: 3160–3168. 17. Facius D, Fussenegger M, Meyer TF (1996) Sequential action of factors involved
in natural competence for transformation of Neisseria gonorrhoeae. FEMS Microbiol Lett 137: 159–164.
18. Fussenegger M, Kahrs AF, Facius D, Meyer TF (1996) Tetrapac (tpc), a novel genotype of Neisseria gonorrhoeae affecting epithelial cell invasion, natural transformation competence and cell separation. Molecular microbiology 19: 1357–1372.
19. Facius D, Meyer TF (1993) A novel determinant (comA) essential for natural transformation competence in Neisseria gonorrhoeae and the effect of a comA defect on pilin variation. Mol Microbiol 10: 699–712.
20. Kidane D, Graumann PL (2005) Intracellular protein and DNA dynamics in competent Bacillus subtilis cells. Cell 122: 73–84.
21. Attaiech L, Olivier A, Mortier-Barriere I, Soulet AL, Granadel C, et al. (2011) Role of the single-stranded DNA-binding protein SsbB in pneumococcal transformation: maintenance of a reservoir for genetic plasticity. PLoS genetics 7: e1002156.
22. Chaussee MS, Hill SA (1998) Formation of single-stranded DNA during DNA transformation of Neisseria gonorrhoeae. Journal of bacteriology 180: 5117– 5122.
23. Maier B, Chen I, Dubnau D, Sheetz MP (2004) DNA transport into Bacillus subtilis requires proton motive force to generate large molecular forces. Nat Struct Mol Biol 11: 643–649.
24. Stingl K, Muller S, Scheidgen-Kleyboldt G, Clausen M, Maier B (2010) Composite system mediates two-step DNA uptake into Helicobacter pylori. Proc Natl Acad Sci U S A 107: 1184–1189.
25. Allemand JF, Maier B, Smith DE (2012) Molecular motors for DNA translocation in prokaryotes. Current opinion in biotechnology 23: 503–509. 26. Allemand JF, Maier B (2009) Bacterial translocation motors investigated by
single molecule techniques. FEMS Microbiol Rev 33: 593–610.
27. Kruger NJ, Stingl K (2011) Two steps away from novelty–principles of bacterial DNA uptake. Molecular microbiology 80: 860–867.
28. Hahn J, Maier B, Haijema BJ, Sheetz M, Dubnau D (2005) Transformation proteins and DNA uptake localize to the cell poles in Bacillus subtilis. Cell 122: 59–71.
29. Kaufenstein M, van der Laan M, Graumann PL (2011) The three-layered DNA uptake machinery at the cell pole in competent Bacillus subtilis cells is a stable complex. Journal of bacteriology 193: 1633–1642.
30. Kramer N, Hahn J, Dubnau D (2007) Multiple interactions among the competence proteins of Bacillus subtilis. Mol Microbiol 65: 454–464. 31. Provvedi R, Dubnau D (1999) ComEA is a DNA receptor for transformation of
competent Bacillus subtilis. Molecular microbiology 31: 271–280.
32. Berge MJ, Kamgoue A, Martin B, Polard P, Campo N, et al. (2013) Midcell Recruitment of the DNA Uptake and Virulence Nuclease, EndA, for Pneumococcal Transformation. PLoS pathogens 9: e1003596.
33. Maier B, Radler JO (2000) DNA on fluid membranes: A model polymer in two dimensions. Macromolecules 33: 7185–7194.
34. Hwang H, Kim H, Myong S (2011) Protein induced fluorescence enhancement as a single molecule assay with short distance sensitivity. Proceedings of the National Academy of Sciences of the United States of America 108: 7414–7418. 35. Suckow G, Seitz P, Blokesch M (2011) Quorum sensing contributes to natural transformation of Vibrio cholerae in a species-specific manner. Journal of bacteriology 193: 4914–4924.
36. Seitz P, Modarres H.P., Borgeaud S., Bulushev R.D., Steinbock L.J., Radenovic A., Dal Peraro, M., Blokesch, M (2014) ComEA is essential for the transfer of external DNA into the periplasm of naturally transformable Vibrio cholerae. PLoS genetics 10: e1004066.
37. Berry JL, Phelan MM, Collins RF, Adomavicius T, Tonjum T, et al. (2012) Structure and assembly of a trans-periplasmic channel for type IV pili in Neisseria meningitidis. PLoS pathogens 8: e1002923.
38. Holz C, Opitz D, Greune L, Kurre R, Koomey M, et al. (2010) Multiple pilus motors cooperate for persistent bacterial movement in two dimensions. Physical review letters 104: 178104.
39. Seitz P, Blokesch M (2013) DNA-uptake machinery of naturally competent Vibrio cholerae. Proceedings of the National Academy of Sciences of the United States of America 110: 17987–17992.
40. Kahn ME, Barany F, Smith HO (1983) Transformasomes: specialized membranous structures that protect DNA during Haemophilus transformation. Proceedings of the National Academy of Sciences of the United States of America 80: 6927–6931.
41. Barouki R, Smith HO (1985) Reexamination of phenotypic defects in rec-1 and rec-2 mutants of Haemophilus influenzae Rd. Journal of bacteriology 163: 629– 634.
42. Lang E, Haugen K, Fleckenstein B, Homberset H, Frye SA, et al. (2009) Identification of neisserial DNA binding components. Microbiology 155: 852– 862.
43. Steichen CT, Cho C, Shao JQ, Apicella MA (2011) The Neisseria gonorrhoeae biofilm matrix contains DNA, and an endogenous nuclease controls its incorporation. Infection and immunity 79: 1504–1511.
44. Winther-Larsen HC, Hegge FT, Wolfgang M, Hayes SF, van Putten JP, et al. (2001) Neisseria gonorrhoeae PilV, a type IV pilus-associated protein essential to human epithelial cell adherence. Proceedings of the National Academy of Sciences of the United States of America 98: 15276–15281.
46. Aas FE, Winther-Larsen HC, Wolfgang M, Frye S, Lovold C, et al. (2007) Substitutions in the N-terminal alpha helical spine of Neisseria gonorrhoeae pilin
affect Type IV pilus assembly, dynamics and associated functions. Molecular microbiology 63: 69–85.