Article
Printed in Brazil - ©2017 Sociedade Brasileira de Química0103 - 5053 $6.00+0.00
*e-mail: [email protected]
Catechol Oxidase, Phosphatase-Like Activity, DNA/BSA Binding Studies of Ru
IIComplexes of
S
-Allyldithiocarbazate: Synthesis and Spectral Studies
Ponnusamy Selvakumar,a Ramaswamy Narayanasamy,*,b Nanjan Nanjundan,b
Krishnaswamy Velmuruganc and Raju Nandhakumarc
aDepartment of Chemistry, SVS College of Engineering, 642 109 Coimbatore, India
bDepartment of Chemistry, Coimbatore Institute of Technology, 641 014 Coimbatore, India
cDepartment of Chemistry, Karunya University, 641 114 Karunya Nagar Coimbatore, India
New ruthenium(II) complexes with formulae [RuCl(CO)(PPh3)2L1] and [RuCl(CO)(PPh3)2L2] (L1 = S-allyl-4-methoxy benzylidene hydrazine carbodithioate, L2 = S-allyl-1-naphthylidene hydrazine carbodithioate) have been synthesized and characterized by elemental analysis, Fourier transform infrared (FTIR), nuclear magnetic resonance (NMR), UV-Vis, electrospray ionization (ESI)-mass spectral studies. Both the Schiff base ligands are coordinated to ruthenium through azomethine nitrogen (C=N) and thiolato sulfur donor atoms in the thiolate form. On the basis of spectral data obtained, an octahedral structure has been assigned to all the new complexes, satisfied by coordination of donor atoms N and S. The stability of complexes in solution was determined by molar conductivity measurements. The interaction of the two complexes with calf thymus (CT) DNA was investigated by fluorescence spectroscopic and viscometric methods. Bovine serum albumin (BSA) protein was examined by fluorescence spectroscopic methods. These techniques indicate that the two metal complexes bind to DNA via intercalation mode and BSA bind with static interaction. Catecholase and phosphatase like activities promoted by these two complexes under physiological conditions have been studied. In vitro anticancer activities have been demonstrated by 3,4,5-dimethylthiazolyl-2-2,5-diphenyltetrazolium bromide (MTT) assay, acridine orange/ethidium bromide (AO/EB) and diamidino-2-phenylindole (DAPI) staining against HeLa cancer cell line.
Keywords: S-allyldithiocarbazate, ruthenium complexes, DNA/BSA binding, kinetics
Introduction
The use of chiral metal complexes to probe the structure of DNA is an active area of research at the interface of chemistry and biology.1 Biological importance of metal drugs cannot be denied after the approval of platinum anticancer drugs, such as carboplatin, oxaliplatin, nedaplatin along with cisplatin.2,3 However, these platinum drugs possess inherent limitations, such as severe tissue toxicity including nephrotoxicity, ototoxicity, neurotoxicity, acquisition of resistance to the treatment, low water solubility and relative inactivity against gastrointestinal tumors.4 It is well known that many complexes exert their drug effects through binding to DNA or proteins. This led us to search for non-platinum metal complexes, such as ruthenium complexes as cytotoxic agents. Among ruthenium-based complexes, [HIm][trans-RuCl4(DMSO)(Im)] (NAMI-A) and
to the proteins.11 Dithiocarbazates constitute an important class of mixed hard-soft nitrogen-sulfur donor ligands. There is continuing interest in the coordination chemistry of heterocyclic bidentate ligands containing NS donor set.12-14 Although plenty of studies have been done on metal complexes with dithiocarbazic acid,15 Schiff bases of
S-methyl,16-18S-benzyl,19S-acetyl20 and other N-substituted derivatives of S-methyldithiocarbazate21 have been reported. A minor change in ligand alters biological character of metal chelates.22 Influenced by the above facts, we wish to synthesize S-allyldithiocarbazate, RCH=NNHC(S)SR’ and allyl group in the molecular structure of new complexes to bring many interesting chemical behaviors and can be used as a ligand.23-26 Ligands exhibit thionethiol tautomer (Scheme 1), N and S donor atoms linked to the metal ion to form six-membered rings. Hopefully, S-allyldithiocarbazate to ruthenium gives better biological performance.
An attempt is made to synthesize ruthenium complexes with S-allyldithiocarbazate and these ligands are known to coordinate via extended π-conjugation through ligand deprotonation.27 In this paper, we have reported two new ruthenium complexes comprising p-methoxybenzaldehyde and 1-naphthaldehyde based S-allyldithiocarbazate, together with their binding ability towards calf thymus (CT) DNA/BSA protein. Furthermore, their catechol oxidase activity and catalytic activities (hydrolysis reaction of the 4-nitrophenyl phosphate (4-NPP)) have been evaluated.
Experimental
Reagents and materials
All the reagents purchased were AR grade and used without further purification. RuCl3.3H2O and ethidium bromide (EB) were purchased from Sigma-Aldrich and used as received. Solvents were distilled using standard
methods. Double distilled water was used to prepare buffers. Calf thymus DNA (CT-DNA), protein markers and bovine serum albumin (BSA) were obtained from Genei, Bangalore and Himedia, India, respectively.
S-Allyldithiocarbazate ligand was synthesized according to previously published method with slight modification.28 The starting complex, RuHClCO(PPh3)3 was prepared according to the literature reports.29
Stock solution of compounds (1 × 10⁻³ mol L-1 in DMSO) was stored at 4 °C and the required concentrations were prepared for all experiments. All the stock solutions were used after no more than 4 days. Solution of compounds was freshly prepared one hour prior to the biochemical evaluations.
Physical measurements
Microanalyses of carbon, hydrogen, nitrogen and sulfur were carried out using Vario EL III Elemental analyzer at SAIF-Cochin, India. Conductivity measurements were carried out at 25 °C on an Elico CM-180 model conductivity meter with dipping type cell. Infrared (IR) spectra of the ligand and its complexes were obtained as KBr pellets on a Bruker model spectrophotometer at the range of 4000-400 cm-1. Electronic spectra of the ligand and its complexes were recorded using a Shimadzu UV-1650 PC spectrophotometer at 800-200 nm range. 1H nuclear magnetic resonance (NMR) spectra were recorded in Jeol GSX-400 instrument at room temperature using tetramethylsilane as the internal standard in dimethyl sulfoxide (DMSO-d6) as solvent. Electrospray ionization mass spectra (ESI-MS) were recorded using LC-MS Q-ToF Micro analyzer (Shimadzu) in SAIF, Punjab University, Chandigarh. All MS results were given in the form: m/z, assignment.
Melting points were checked on a Technico micro heating table and uncorrected. Fluorescence spectral
data were performed on a JASCO FP-8200 fluorescence spectrophotometer at room temperature. Data were expressed as the mean ± standard deviation from three independent experiments.
Synthesis of ruthenium(II) Schiff base complexes
The complexes were prepared according to the following common procedure in Scheme 2. To a boiling solution of [RuHCl(CO)(PPh3)3] (0.1 g, 0.1 mmol) in MeOH/CHCl3 (1:1 v/v) (20 mL), corresponding Schiff base ligand (0.05 or 0.07 g, 0.1 mmol) in MeOH/CHCl3 (1:1 v/v) (20 mL)was added dropwise. The resulting mixture was heated under reflux for 6 h on a water bath that resulted in rapid color change from light orange to dark brown. After refluxing, the resulting solution was filtered and the filtrate was left undisturbed for the slow evaporation of solvent. After few days, brown colored complexes were obtained.
Synthesis of [RuCl(CO)(PPh3)2L1 (1)
Yield: (0.105 g) 70%; color: red brown; anal. calcd. for C49H43ClN2O2P2RuS2 requires: C, 61.66; H, 4.54; N, 2.93; S, 6.72%. Found: C, 61.24; H, 4.31; N, 2.85; S, 6.68%. Selected IR data (KBr) ν / cm-1 1596 (C=N), 1085 (N−N), 1019 (C−S−S), 1246 (C−O−C), 1930 (C≡O), 1430 {Ph(P-Ph)}; 1H NMR (400 MHz, DMSO) d 3.83 (2H, CH
2), 7.00-8.20 (4H, Ar-H), 8.59 (1H, CH=N), 3.3 (3H, OCH3); UV-Vis (DMSO) λ / nm 276, 365, 393, 424. ESI-MS (DMSO) m/z, observed: 919.03, (M − Cl)+ requires: 919.50.
Synthesis of [RuCl(DMSO)3L2] (2)
Yield: (0.10 g) 67%; color: brown; anal. calcd. for C52H43ClN2OP2RuS2 requires: C, 64.09; H, 4.45; N, 2.87; S, 6.58%. Found: C, 63.87; H, 4.33; N, 2.75; S, 6.52%. IR (KBr) ν / cm-1 1647 (C=N), 1081 (N−N), 991 (C−S−S), 1924 (C≡O), 1426 {Ph(P-Ph)}; 1H NMR (400 MHz, DMSO) d 3.3 (2H, CH2), 7.13-8.10 (7H, Ar-H), 8.65 (1H, CH=N); UV-Vis (DMSO) λ / nm 278, 362, 393, 410.
MS (DMSO) m/z, observed: 939.06, (M − Cl)+ requires: 939.51.
DNA binding studies
Stability study
Stability is the major requirement for the biological evaluation of DNA/BSA binding interaction study, so checking the stability of the complexes in solution is very important.30 DMSO is the most widely preferred solvent to prepare stock solutions for biophysical and biological testing. For many transition metal complexes, DMSO acts as a good ligand, coordinating with the metal center through either the sulfur or oxygen atom. Therefore, it is imperative to establish the stability of organometallic compounds in DMSO before performing biological experiments. To check the stability of the ruthenium complexes 1 and 2, electronic spectra have been recorded in DMSO at four different time points (0 min, 1, 6 and 12 h) through the UV absorption method. The UV-visible spectral results did not reveal any appreciable changes in either the intensity or the position of the absorption bands in DMSO solution. Further confirmations of the stability of the complexes were given by conductivity measurements, the molar conductivity values for the ruthenium(II) complexes (1 mmol) in DMSO showed low value 0.29-0.36 ohm−1 cm2 mol−1 due to their non-electrolytic nature. This confirms stability of the complexes in solution.
Fluorescence emission titration study
I n t h e eva l u a t i o n o f a n t i t u m o r p r o p e r t y o f any compound, DNA binding is predominant in the pharmacology and hence interaction between DNA and ruthenium(II) complexes has significant importance.31 The binding mode and tendency of binding of ruthenium(II) complexes to CT-DNA have been studied by physicochemical methods at room temperature. DNA binding experiments includes luminescence measurement to clarify the binding affinity of ruthenium(II) complexes by emissive titration and viscosity measurements at room temperature. The reported compounds were insoluble in water under titration conditions. The complexes were soluble in DMSO and, to diminish the negative control of the solvent, stock solutions were prepared. The stock solutions of selected test compounds were dissolved in a mixed solvent of 5% DMSO and 95% TrisHCl buffer (5 mM Tris-HCl/50 mM NaCl buffer for pH 7.2) for all the experiments and stored at 4 °C for further use. Now, the solvent medium has no influence on the compounds. While measuring the emissive spectra, an equal amount of DNA was added to the test compound solutions and
the reference solution to eliminate the absorbance of the CT-DNA itself and TrisHCl buffer was subtracted through base line correction. Emissive intensity of CT-DNA was determined by fluorescence spectrometry and the excitation wavelength was adjusted before taking measurements. Emissive titration was performed with a fixed concentration of metal complexes (25 µmol). While gradually increasing the concentration of DNA (0-10 µmol),the emission intensities were recorded in the range of 360-500 nm at room temperature (298 K). Titrations were manually done by using a micropipette for the addition of CT-DNA. It is noteworthy that DNA in double- distilled water does not show any luminescence.
Ethidium bromide displacement study
Further support of DNA binding of the complexes was measured by the fluorescence-based ethidium bromide (EB) displacement. A typical assay was carried out as follows. EB displacement experiments were performed by monitoring changes in the fluorescence intensity on the emission wavelength (λem) 604 nm and the excitation wavelength (λex) 550 nm, after aliquot addition of tested compounds to an aqueous solution of EB-DNA. EB alone showed that the minimal and maximum fluorescence were achieved due to the formation of intercalative EB-DNA adduct. Addition of increasing amounts of ruthenium complex to the DNA-EB adduct quenched the fluorescence. For the emission quenching experiments, CT-DNA was pretreated with EB in the ratio [DNA]/[EB] = 10 for 30 minutes at 37 °C. Then, the titration compounds were added to this mixture of EB-DNA and the change in fluorescence intensity was measured.
Viscosity experiment
Protein binding studies
Several different transport proteins exist in blood plasma, but only albumin is able to bind wide diversity of ligands reversibly with high affinity. The interaction of metal ions has led to our interest in studying the interaction of transition metal complexes with proteins. The majority of intrinsic fluorescence of BSA, when excited at 290 nm is provided by tryptophan residues alone. The intensity of emission depends on the exposure of tryptophan residues to nearby polar environment and to quenching groups of complexes through molecular interaction. Quenching of tryptophan residues of BSA was performed using new ruthenium complexes 1 and 2 as quenchers. The excitation wavelength of BSA at 290 nm and emission at 339 nm was monitored for the protein binding studies. The excitation and emission slit width’s rate and scan rate were maintained constant for all the experiments. Samples were carefully purged using pure nitrogen gas for 15 minutes. Quartz cells (4 × 1 × 1 cm) with high vacuum Teflon stopcocks were used for degassing. Stock solution of BSA was prepared in 50 mmol Tris-HCl buffer (pH 7.2), stored in dark at 4 °C for further use. Titrations were manually done by using a micropipette for the addition of ruthenium complexes 1 and 2.
Catechol oxidase studies
Catechol oxidase, a type-3 copper protein, can bind oxygen reversibly at room temperature and so it can be used to oxidize catechols to respective quinones. As a model of the enzyme here we have taken ruthenium(II) complexes. To study the catalytic performance of ruthenium(II) complexes, 3,5-DTBC is employed as a substrate because its low reduction potential makes it easy to oxidize and the bulky tert-butyl groups prevent further over oxidation, such as ring opening and it shows a low quinine-catechol reduction potential (Scheme 3). Further, the oxidation product 3,5-DTBQ
(3,5-di-tert-butylquinone) is highly stable and gives emission maximum at λem 434 nm in DMSO. The catalytic activity of the complexes was screened by treating a 1 × 10⁻⁴ mol L-1 solution of complex with a 1 × 10⁻² mol L-1
solution of 3,5-DTBC. The reaction with complexes was monitored after the addition of compounds to DMSO solution of 3,5-DTBC for 4 h. Initially, complexes showed bands at λ = 400 nm. Upon addition of 3,5-DTBC, spectra exhibit the immediate increments. Thus, the experiment unambiguously proves that oxidation of 3,5-DTBC to 3,5-DTBQ is catalyzed by the ruthenium complexes, as it is well-established that shows a maximum at λ = 400 nm in pure DMSO.
Phosphate hydrolysis
Kinetic experiments for the hydrolysis of 4-nitro phenyl phosphate by ruthenium(II) complexes were measured by emissive titration at room temperature. To study the phosphate activity of ruthenium complexes 1 and 2, disodium salt of 4-NPP was a preferred choice of substrate, represented in Scheme 4. The hydrolytic tendency of the complexes was measured by monitoring time evaluation of p-nitrophenolate in DMSO (λem = 469 nm) through a wavelength scan from 200 to 800 nm over 2 h. 20 equivalents of the substrate were used relative to the catalyst. The excitation wavelength was fixed and adjusted before measurements. Emissive titration was performed with increasing concentrations of ruthenium(II) complexes (0-25 µmol) that quenched the fluorescence. Titrations were manually done by using a micropipette for the addition of complexes 1 and 2.
In vitro cytotoxicity studies
Maintenance of cancer cell lines
HeLa cancer cell line was obtained from National Centre for Cell Science (NCCS), Pune, India, and cell viability was assessed by MTT (3,4,5-dimethylthiazolyl-2-2,5-diphenyltetrazolium bromide) method. HeLa cells were maintained in a humidified atmosphere containing 5% CO2 at 37 °C in DMEM medium supplemented with 100 units of penicillin, 100 µg mL−1 of streptomycin, and 10% fetal bovine serum. Briefly, HeLa cells with a density of 1 × 10⁴ cells per well were precultured in 96-well microtiter plates for 48 h under 5% CO2.
Scheme 3. Catalytic oxidation of 3,5-DTBC to 3,5-DTBQ in DMSO in the presence of oxygen.
Cell viability assay
The complexes 1 and 2 were dissolved in 0.1% DMSO (the concentration of DMSO did not exceed 0.1% v/v) to obtain a solution of 1 mmol each. The samples were then diluted to 100 µmol in PBS solution and filter-sterilized using a 0.22 µm syringe filter. This 100 µmol solution in PBS was further used in cell cytotoxicity studies. Then, each well was loaded with 10 µL MTT solution (5 mg mL−1 in PBS pH 7.4) for 4 h at 37 °C. The insoluble formazan was dissolved in 100 µL of 4% DMSO and the cell viability was determined by measuring the absorbance of each well at 570 nm using Bio-Rad 680 microplate reader. All the experiments were performed in triplicate and the percentage of cell viability was calculated according to the equation 1.
Inhibition rate (%) = OD (control) − OD (Drug treated
cells) / OD (control) × 100 (1)
After 48 h, the cells were observed with an inverted phase contrast microscope, photographed with a Nikon FM 10 camera.
Acridine orange/ethidium bromide (AO/EB) and diamidino-2-phenylindole (DAPI) fluorescent assay for cell death
AO/EB and DAPI staining analysis was performed as described earlier.32 HeLa cells were cultured separately in 6-well plates and treated with IC50 concentration of the complex for 24 h, when DMSO (0.02%) was used as solvent control. The cells were harvested and washed with ice-cold phosphate-buffered saline (PBS) and 40 µL of AO/EB solution (1 part of 100 µg mL−1 of AO in PBS; 1 part of 100 µg mL−1 of EB in PBS) was added and examined in a fluorescent microscope (Carl Zeiss, Jena, Germany), using an UV filter (450-490 nm). For DAPI staining, the treated cells were fixed with 80% ethanol at room temperature for 30 min. The fixative was removed and the cells were washed with PBS 3 times, and then incubated with DAPI (1 µg mL−1) for 45 min at room temperature in the dark. Three hundred cells per sample were counted, in triplicate, for each time point and scored as viable or dead, and if dead, whether by apoptosis or necrosis as judged from the nuclear morphology and cytoplasmic organization. Morphological features of interest were photographed.
Results and Discussion
We have relied on the use of stable starting material, [RuHCl(CO)(PPh3)3], during the synthesis of ruthenium(II) carbonyl complexes. The S-allyldithiocarbazate ligands were synthesized via typical condensation route from their parent S-allyldithiocarbazate with p-methoxybenzaldehyde
and 1-naphthaldehyde. Successively, complexes 1 and 2 were prepared via equimolar amounts of ligand with [RuHCl(CO)(PPh3)3]. In this preparation, the ligand acted as a monobasic bidentate ligand with NS fashion replacing a hydride and one triphenylphosphine ligand from the corresponding starting complex. The prepared complexes are air stable in solution and in the solid state at room temperature, soluble in common organic solvents, such as dimethyl sulfoxide, dimethyl formamide, dichloromethane. The complexes have been characterized by elemental analysis, IR, 1H NMR, UV-Vis and ESI-MS. The elementary analysis gave satisfactory results, which supports the proposed molecular formulae [RuCl(CO) (PPh3)2L1] and [RuCl(CO)(PPh3)2L2].
IR spectra
The IR spectra of Schiff bases and corresponding ruthenium complexes were compared in the region 4000-400 cm-1 (Figure S1). The IR spectra do not show any
υ(SH) band at 2700 cm-1, but the presence of broad υ(NH) band in the region 3107-3120 cm-1 suggests that the free ligands are in keto form in solid state.33 The strong bands observed at 1610, 1660 cm-1 and 848, 828 cm-1 confirm the formation of ligands with υ(C=N), υ(C=S), but IR spectra of complexes show reduction in the frequency of azomethine group and the new band appeared at 1596 and 1647 cm-1 indicating the coordination of azomethine group to ruthenium.34 Absence of band due to υ(C=S) in the complexes confirms the coordination of Schiff bases to ruthenium and the disappearance is due to negative coordination of ligand in the form of υ(C−S) and the new band appeared in the complexes 1 and 2 at 829, 800 cm-1 concludes tautomerism of (−NH−C=S) group and coordination of thiolatesulfur after deprotanation.35 The complexes display a medium to strong band in the region 1930-1924 cm-1 which is attributed to the terminally coordinated carbonyl group υ(C≡O) and is observed at a slightly higher frequency than in the precursor complexes.36
1H NMR spectra
1H NMR spectral data are incorporated in Experimental
complexes 1 and 2.38 The aromatic protons in complexes 1 and 2 are observed as multiplets around 7.0-8.1 ppm. The methylene protons of complexes 1 and 2 appeared at 3.8 and 3.3 ppm, respectively, indicating the non-participation of S-allylsulfur in coordination.39
Electronic spectra
The electronic spectra of complexes were recorded in DMSO in the range of 200-800 nm, which showed intense absorption in near ultraviolet region and the displayed four bands in the region around 262-430 nm (Figure S3). The complexes 1 and 2 exhibited bands at 276 nm, which can be assigned to intra-ligand transitions in the complexes. The lowest energy absorption maxima located in the 340-420 nm range, which probably assigned to S(pπ) → Ru (dπ) LMCT transitions,40 caused by the promotion of the electron from the full HOMO of the ligand, of primarily sulfur pπ character, to the empty LUMO of ruthenium dπ character, are commonly seen in other metal-dithiocarbazate complexes.41 Further, bands at 425-438 nm can be designated as (d→d) transition bands of a spin paired d6 species with octahedral structure and the spectra give similarities of other octahedral RuII complexes.42 The emission spectra of complexes 1 and 2 recorded in DMSO showed resemblance shoulder peak at 450 nm when excited at 427 nm.
ESI mass spectra
ESI mass spectra of the ruthenium(II) complexes 1 and 2 were also recorded to support the information of other spectral studies. ESI-MS data analysis of ruthenium complexes 1 and 2 showed major peaks at m/z = 919.50 and 939.51, respectively (Figure S4), which were assigned to [M − Cl]+ ions, revealing that the identity of the complexes were retained in solution.
DNA binding studies by fluorescence spectra
In the development of anticancer drugs, investigation of binding of metal complexes to DNA has a prime importance. It is a commonly used technique to study potential interactions (and their likely nature) between DNA and metal complexes. The emissive titration studies have been performed by recording changes in emission intensity by aliquot addition of DNA.43 The intercalation between metal complexes and DNA usually results in hypochromism with or without red/blue shift; alternatively, on the other hand, non-intercalative/electrostatic interaction causes hyperchromism.
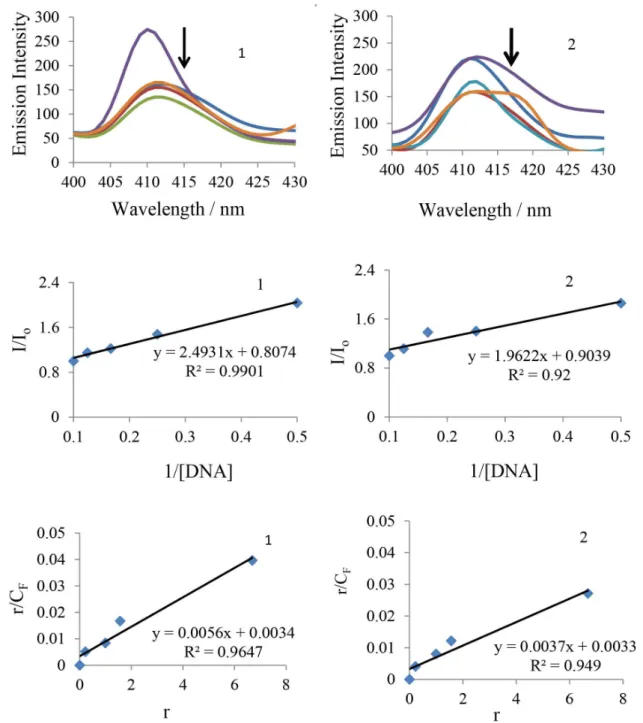
From the emissive titration spectra (Figure 1), It is clearly seen that upon addition of increasing concentration of CT-DNA (0-10 µmol) to a solution of complexes 1 and 2 resulted in hypochromism 50.09 and 46.10% at 410 nm along with a small red shift (ca. 2 nm). The resulted hypochromism is due to an intercalative mode of binding, involving a strong stacking interaction between extending aromaticity of ligand and the base pairs of DNA. Usually, the hypochromism is consistent with the strength of intercalative interaction. The decrease in intensity of bands from the original intensities was based on DNA binding enhancement. To compare the affinity of tested compounds towards CT-DNA quantitatively, the intrinsic binding constant (Kb) has been determined using the following Scatchard equation:44
CF = CT[(I / Io) − P] / [1 − P] (2)
where CT is the concentration of the probe (complex) added; CF is the concentration of the free probe and Io and I are its emission intensities in the absence and in the presence of DNA, respectively. P is the ratio of observed emission quantum yield of the bound probe to the free probe. The value of P was obtained from a plot of I / Ioversus 1 / [DNA], such that the limiting emission yield was given by the y-intercept. The amount of bound probe (Cb) at any concentration was equal to CT− CF. The obtained Scatchard plots of r / CF versus r for tested compounds with increasing concentration of CT-DNA were showed in Figure 1. A plot of r / CF versus r (= CB / [DNA]) gives intrinsic binding constant (Kb) values. The intrinsic binding constant (Kb) values for the interaction of complexes 1 and 2 with CT-DNA are listed in Table 1. The results from emissive titration experiment suggest that all the compounds (1 and 2) can bind to DNA. The Kb values suggest that a DNA-binding affinity of complex 1 is stronger than the complex 2.
Ethidium bromide study
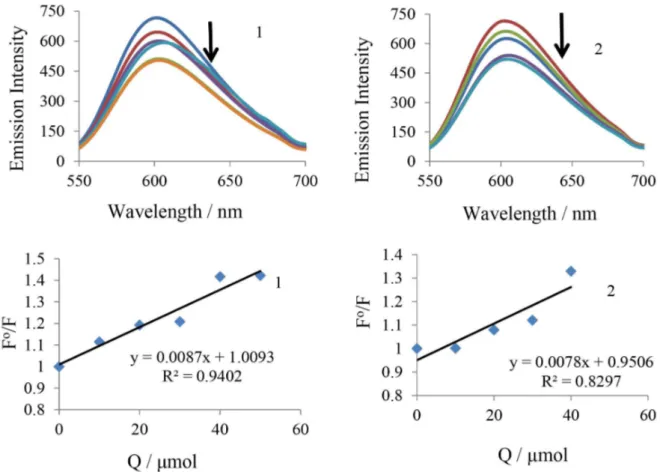
DNA. If the metal complex intercalates into DNA, it leads to decrease in binding sites of DNA available for EB, resulting in decrease in the fluorescence intensity of the EB-DNA system.46 The fluorescence intensity of EB-DNA
decreases rapidly with increasing concentration of the compounds. This illustration is given as the concentration of complexes 1 and 2 increases, the emission band at 604 nm for EB exhibited hypochromism up to 29.65 and 27.03% with slight red shift from the initial fluorescence intensity, respectively. Results in Figure 2 indicate that ruthenium(II) complexes compete with EB to bind with DNA through intercalation. Notably, the fluorescence quenching constant has been evaluated using Stern-Volmer equation.47
Fo / F = 1 + K
sv[Q] (3)
Figure 1. Emission spectra (400-430 nm) and Scatchard plots of complexes 1 (left) and 2 (right), (25 × 10-6 mol L-1) in the presence of increasing
concentrations of CT DNA (0-10 × 10-6 mol L-1), obtained in Tris-HCl buffer (pH 7.2) with λ
ex = 404 nm.
Table 1. CT-DNA binding constant (Kb), quenching constant (Ksv) and
apparent binding constant (Kapp) values for complexes 1 and 2
Compound Kb / mol-1 K
sv / mol-1 Kapp / mol-1
1 5.0 × 10³ 8.0 × 10³ 9.35 × 10⁵
where Fo and F are fluorescence intensities in the absence and the presence of quencher, respectively. Kq is the linear Stern-Volmer quenching constant. The value Kq is obtained with a slope from the plot of Fo / F versus [Q]. Stern-Volmer plots of Fo / F versus [Q] was shown in Figure 2. The quenching constant (Kq) values are obtained from the slope, which indicate that the complexes strongly bind to DNA. The quenching constant (Kq) values are obtained from the slopes, which are 8.0 × 10³, 7.0 × 10³ for complexes 1 and 2, respectively. The selected test compounds can quench the EB emission by either competing with EB for binding sites or by accepting the excited state photon. It is unlikely that ruthenium complexes can compete with EB for intercalative binding sites. Further, the apparent DNA binding constant (Kapp) values are also calculated using the equation 4:48
KEB[EB] = Kapp[M50%] (4)
where KEB = 1.0 × 10⁻⁷ mol-1 is the DNA-binding constant of EB; [EB] is the concentration of EB (7.5 µmol) and [M50%] is the concentration of the compound used to obtain 50% reduction in fluorescence intensity of DNA pretreated with EB. The Kapp values for complexes 1 and 2 are given
in Table 1. DNA binding ability of complex 1 is stronger than complex 2, which is consistent with the results obtained from the above fluorescence spectral studies.49 The quenching and binding constants of ruthenium(II) complexes indicate that the interaction of tested compounds with CT-DNA should be of intercalation.
DNA-binding study with viscosity measurements
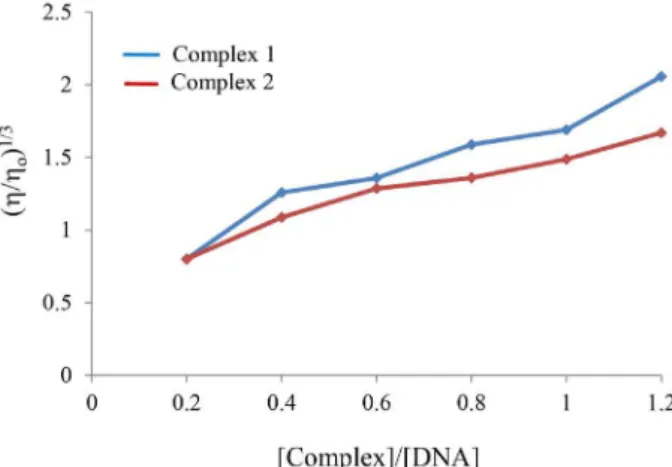
DNA viscosity is sensitive to DNA length change; therefore, its measurement upon the addition of a compound is often concerned as the least ambiguous method to clarify the interaction mode of a compound with DNA and provides reliable evidence for the intercalative binding mode. In general, the viscosity of CT-DNA increases when a compound binds DNA in an intercalating mode, but remains unchanged when a compound binds DNA in an electrostatic mode. If the groove binding mode occurs, there is a little effect on the viscosity of DNA. The length of the DNA helix increases upon intercalation as base pairs are separated to accommodate the binding complex, which results in the increased viscosity of the DNA. The viscosity measurements of compounds on the relative viscosities of CT-DNA are shown in Figure 3.
When ruthenium(II) complexes 1 and 2 were treated with CT-DNA (200 µM) and the concentrations of complexes (0-120 µM) are increased from a ratio of R = 0-1.2 (1 / R = [Complex] / [DNA]), the relative viscosity of DNA increases steadily. This increase suggested that selected compounds can deeply intercalate into DNA base pairs and increase DNA viscosity similar to some known intercalation.50 This result is consistent with our above mentioned hypothesis.
BSA interaction studies
The protein binding study was performed in most abundant blood protein serum albumin (BSA). The interactions between BSA and metal complexes have attracted immense current interest because of their structural homology with human serum albumin. It constitutes about 55% of total plasma protein and plays a pivotal role in transport of drug and its metabolism.51 BSA exhibits intrinsic fluorescence because of the presence of aromatic amino acids phenylalanine, tyrosine, and tryptophan. The fluorescence of tyrosine is completely quenched when it is ionized, whereas, phenylalanine has very low quantum yield. This reveals that the intrinsic fluorescence of BSA is due to tryptophan alone. The relative ratio of fluorescence intensity for three amino acids (tryptophan, tyrosine and phenylalanine) residues is (100:9:0.5) and thus, the intrinsic fluorescence intensity of BSA when excited at 295 nm mainly comes from tryptophan residues, such as, Trp-134 and Trp-212 more exposed to the environment.52 Understandably, fluorescence behavior of BSA can provide significant information about the structure, dynamics and protein folding. Fluorescence quenching experiments have been done using a solution of BSA (5 µmol) as the substrate in TrisHCl/50 mmol NaCl buffer at pH 7.2. Quenching of the emission intensity of tryptophan residues of BSA at 335 nm (excitation wavelength at 295 nm)
is monitored using complexes 1 and 2 as quenchers with increasing complex concentration. The Io / I versus [complex] plot are constructed using the corrected fluorescence data taking into account the effect of dilution. Fluorescence spectra of BSA with various concentrations of ruthenium(II) complexes are obtained from 280-590 nm. Subsequently, the change of fluorescence intensity is related to both the concentration and nature of the quencher. Therefore, the quenched fluorophore serves as an indicator to evaluate the ability of quenching agent.
An examination of the spectra showed a noteworthy decrease in fluorescence intensity at ca. 335 nm between the test compounds and BSA protein. The examined red shift is mainly due to the fact that the active site in protein is buried in a hydrophobic environment. The data reveal certain interactions taking place between the complexes and BSA protein. To understand the quenching progression deeply, quenching constant (Kq) is evaluated by following Stern-Volmer and Scatchard equation53
log [(Io− I) / I] = log Kbin + nlog [Q] (5)
where Kbin is the binding constant of the compounds with BSA and n is the number of binding sites. The number of n and Kbin have been found from the plot of log (Io− I) / I
versus log [Q] (Figure 4).
The calculated Kq, Kbin and n values are given in Table 2. The value of n indicates the existence of two binding sites in BSA for the complexes.13 The larger values of K
q and Kbin indicate strong interaction between BSA protein and the complexes used in this study.
Catechol activity
To study the catalytic performance of ruthenium(II) complexes, 3,5-DTBC is employed as a substrate because its low reduction potential makes it easy to oxidize and the bulky tert-butyl groups prevent further over oxidation, such as ring opening and it shows a low quinine-catechol reduction potential (Scheme 3).54 The reactions were performed at room temperature and monitored by fluorescence spectroscopic technique. 3,5-DTBC forms oxidation product 3,5-DTBQ, which is highly stable and exhibits a characteristic emission intensity at λemis = 437 nm (λex = 401 nm) in pure DMSO. The reaction is monitored by treating 1 × 10⁻⁴ mol L-1 solution of selected compounds with 100 equivalents of 3,5-DTBC in which upon oxidation of the catecholic substrate, new band started (Figure 5) to gradually appear at about 437 nm in time due to the formation of the oxidized product 3,5-DTBQ. Further, the experiment clearly shows that the oxidation of 3,5-DTBC
to 3,5-DTBQ is catalyzed by the selected compounds, as it is well established that 3,5-DTBQ shows maximum at
λemis = 437 nm in pure DMSO.
Kinetic study of the catacholase activity
To understand kinetic aspects of catalysis for selected compounds, the rate constant for compounds as catalyst was determined by initial rate methods (detailed description
provided in Experimental section). The catalytic behavior showed saturation kinetics and a treatment based on Michaelis-Menten model seemed to be appropriate under excess substrate conditions.55 The observed rate constants (Ki) were obtained by the initial rate method. Plots of Ki
vs. [DTBC] gave a non-linear curve of decreasing slope (Figure 5) which was well explained by the following equations 6-8.
Figure 4. Fluorescence titrations of BSA with the complexes 1 (left) and 2 (right). Arrow shows the change upon increasing complex concentration. Stern-Volmer plots and Scatchard plots of the fluorescence titration of complexes 1 and 2.
Table 2. Quenching constant (Kq), binding constant (Kbin), and number of binding sites (n) for the interactions of complexes with BSA
Compound Kb / mol-1 Ksv / mol-1 Kq / mol-1 n value
1 8.3 × 10⁵ 1.156 × 10⁶ 1.156 × 10¹⁴ 2.306
(6)
(7)
(8)
The Michaelis-Menten constant (Km) and maximum initial rate (Vmax) were determined by linearization using Lineweaver-Burk plots (Figure 5). The rate constants for
dissociation of substrates S (i.e. turnover number, Kcat) were calculated from the graphs of 1 / V vs. 1 / [S] (Figure 5) known as Lineweaver-Burk graph by using above equations and all these parameters are listed in Table 3. These results state that complex 1 is a highly efficient catalyst group than the complex 2.
Figure 5. Time resolved emission spectra of the reaction and Lineweaver-Burk plot for complexes 1 (left) and 2 (right) with 3,5-DTBC after the addition of complexes in 15 minutes time interval.
Table 3. Kinetic parameters for complexes 1 and 2 in DMSO solution
Catalyst Km / (mol L-1) Vmax / (mol S-1) Kcat / h-1
1 105.08 × 10⁻⁴ 5.58 × 10⁻⁴ 105
Phosphate hydrolysis
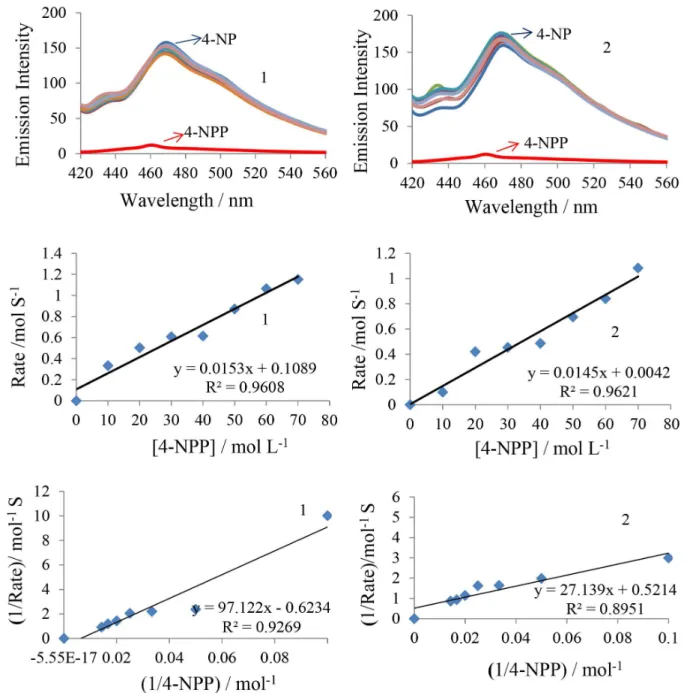
Many hydrolytic processes in enzyme-catalysis involve metal ions in close proximity to the active site. The selected compounds meet the requisites for use as a functional model system for hydrolytic enzymes. To study the phosphatase activity of complexes, disodium salt of 4-NPP (Scheme 4) is the preferred choice of substrate.56 The hydrolysis of 4-NPP was detected emissive intensity by monitoring the time evolution of p-nitrophenolate ion (4-NP) in DMSO at
λemis = 469 nm (λex = 423 nm) through a wavelength scan of 400-800 nm over 2 h and 40 equivalent of substrate were used relatively to the catalyst.
Kinetic study of the phosphate hydrolysis
The kinetic studies of compounds were performed by the initial slope method by monitoring the increase rate in emissive intensity band at 469 nm, which corresponds to the increase in 4-nitrophenolate concentration.57 The dependence of rate constants was determined by using five different substrate concentrations. The catalytic behavior showed saturation kinetics and a treatment based on Michaelis-Menten model seemed to be appropriate under excess substrate conditions.58 The observed rate constants (K
i) were extracted by initial rate method. Plots of the Michaelis-Menten constant (Km) and maximum initial rate (Vmax) were determined by linearization using Lineweaver-Burk plots (Figure 6). The rate constants for dissociation of substrates S (i.e. turnover number, Kcat) were calculated from the graphs of 1 / V vs. 1 / [S] (Figure 6) known as Lineweaver-Burk graph by using above equation 8 and all these parameters are listed in Table 4. These results state that complex 1 is a efficiently better catalyst group than the complex 2.
On the basis of kinetic data, Lewis acid activation mechanism is proposed for the metal catalyzed 4-NPP cleavage. The high P−O bond cleavage rate of compounds can be attributed to the presence of H2O groups in the framework, which could act as a nucleophile in hydrolytic reaction.
In vitro anticancer studies
MTT assay
The positive results obtained from the biomolecules interaction studies encouraged us to further determine the cytotoxicity of the complexes against a HeLa liver cancer cell line. The cell viability assay for the newly synthesized ruthenium(II) complexes (1 and 2) was evaluated using the method of MTT assay. Cisplatin was used as a positive control.59 The results were analyzed by means of cell
inhibition expressed as IC50 values, which were listed in Table 5. It is notable that complex 1 possesses the most potent inhibitory effect against HeLa cell line, and its IC50 value is well known for the anticancer drug (cisplatin). The results of MTT assay in Table 5 showed that the complexes 1 and 2 inhibit the growth of cells in a concentration-dependent manner. It is due to the fact that ruthenium complexes have a capacity to reduce the energy status in tumors as well as to enhance tumor hypoxia, which also influences their antitumor activities. The high cytotoxic behavior of the complex 1 is similar to that of DNA/BSA binding affinities as discussed previously. Upon the confirmation of excellent cytotoxicity properties of the complexes, further staining assay were encouraged against HeLa liver cancer cell line to understand their mechanism of action of drugs.
Staining assay
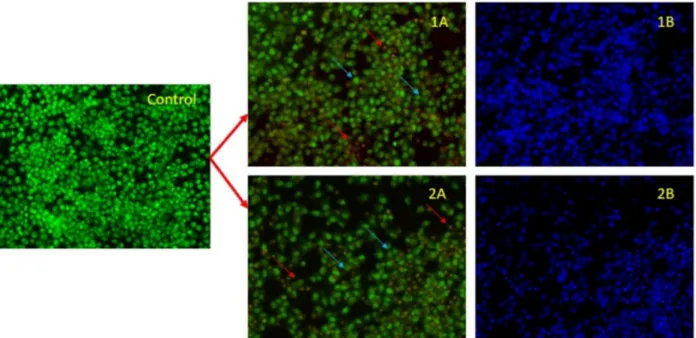
The apoptotic morphologies induced by 1 and 2 have been investigated by using AO/EB staining and adopting fluorescence microscopy.60 Apoptotic pathways are important targets that should be considered in the design of potential anticancer agents. The cytological changes observed were classified into four types: (i) viable cells; (ii) early apoptotic cells; (iii) late apoptotic cells and (iv) necrotic cells. In Figure 7 (1A and 2A), blue arrows exhibited late apoptotic cells with chromatin aggregation, that is, highly condensed chromatin which is seen at a fixed concentration of complexes 1 and 2 and necrotic cells having uniform orange to red nuclei with condensed structure were also observed. These morphological changes were observed for complex 1, which suggested that the cells are devoted to induced cell death via necrotic and the resulting images of the control and treated HeLa cells are depicted in Figure 7.
Conclusion
Two new ruthenium(II) complexes, containing
p-anisaldehyde-S-allylditiocarbazate (L1),
experiments, all the complexes exhibited intercalation mode of the interaction with DNA. Furthermore, protein binding properties of complexes examined by fluorescence spectra suggested that the binding affinity of complex 1 was stronger than that of complex 2. In addition, the complexes exhibited promising catalytic activity in the oxidation of
Figure 6. Phosphate hydrolysis emission spectrum and Lineweaver-Burk plot for complexes 1 (left) and 2 (right).
Table 4. Phosphate hydrolysis kinetic parameters for complexes 1 and 2
Catalyst Km / (mol L-1) V
max / (mol S-1) Kcat / h-1
1 155.89 × 10⁻³ 1.605 × 10⁻³ 3117
2 52.07 × 10⁻³ 1.919 × 10⁻³ 1041
Table 5. In vitro cytotoxicity of the complexes in normal and HeLa cancer cell line
Complex IC50 / µM
a
Vero HeLa
1 52.31 ± 2.41 18.74 ± 2.14
2 54.24 ± 3.65 22.34 ± 2.42
Cisplatinb − 13.00 ± 2.01
aFifty percent inhibitory concentration after exposure for 24 h in the MTT
assay; bdata from reference 58.
Figure 7. Images of HeLa cancer cells with complexes after AO/EB (1A, 2A) and DAPI (1B, 2B) staining at 24 h. Blue arrows show late apoptosis and red arrows show necrotic cells.
anti-tumor potency with low IC50 values tested by MTT assay against normal Vero cell line and HeLa cancer cell line. Finally, the characteristics of apoptosis in cell morphology have been observed using AO/EB and DAPI staining. The results obtained from the present complexes are of importance for the development of metal-based chemotherapeutic agents in the future.
Supplementary Information
Supplementary information (IR, NMR, UV-Vis, ESI-MS) is available free of charge at http://jbcs.sbq.org.br as PDF file.
Acknowledgments
We are sincerely thankful to the SAIF Punjab University, Chandigarh for ESI Mass and NMR facility and the director, CAS in botany, School of Life Sciences, University of Madras, for providing laboratory facilities to perform the cell lines studies. This work is supported by the Principal Dr T. Kannan, SVS College of Engineering, Coimbatore.
References
1. Gottesfeld, J. M.; Neely, L.; Trauger, J. W.; Baird, E. E.; Dervan, P. B.; Nature 1997, 387, 202.
2. Harper, B. W.; Krause-Heuer, A. M.; Grant, M. P.; Manohar, M.; Garbutcheon-Singh, K. B.; Aldrich-Wright, J. R.; Chem. Eur. J. 2010, 16, 7064.
3. Wheaten, N. J.; Walker, S.; Craig, G. E.; Oun, R.; Dalton Trans.
2010, 39, 8113.
4. Barry, N. P. E.; Sadler, P. J.; Chem. Commun. 2013, 49, 99. 5. Bruijnincx, P. C. A.; Sadler, P. J.; Curr. Opin. Chem. Biol. 2008,
12, 197.
6. Suess-Fink, G.; Dalton Trans. 2010, 39, 1673.
7. Hotze, A. C. G.; Kariuki, B. M.; Hannon, M. J.; Angew. Chem.
2006, 118, 4957.
8. Ang, W. H.; Dyson, P. J.; Eur. J. Inorg. Chem. Soc. 2006, 20, 4003.
9. Schluga, P.; Hartinger, C. G.; Egger, A.; Reisner, E.; Galanski, M.; Jakupec, M. A.; Keppler, B. K.; Dalton Trans. 2006,1796. 10. Wang, D.; Lippard, S. J.; Nat. Rev. Drug Discovery 2005, 4,
307.
11. Timerbaev, A. R.; Hartinger, G.; Alekseenko, S. S.; Keppler, B. K.; Chem. Rev. 2006, 106, 2224.
12. Akbar Ali, M.; Mirza, A. H.; Fereday, R. J.; Fuller, R. J.; Drew, S. C.; Gahan, L.; Hanson, J. R.; Moubaraki, B.; Murray, K. S.; Inorg. Chim. Acta2005, 358, 3937.
13. Pramanik, N. R.; Ghosh, S.; Raychaudhuri, T. K.; Ray, S.; Butcher, R. J.; Mondal, S. S.; Polyhedron2004, 23, 1595. 14. Yazdanbakhsh, M.; Hakini, N.; Heravi, M. M.; Ghassemzadeh,
M.; Neumuller, B.; Z. Anorg. Allg. Chem. 2004, 630, 627. 15. Ali, M. A.; Livingstone, S. E.; Phillips, D.; J. Inorg. Chim. Acta
1971, 5, 119.
16. Shailendra, S.; Bharti, N.; Nagvi, F.; Azam, A.; Helv. Chim. Acta 2002, 85, 2713.
Y. M.; Wu, J. Y.; Tian, Y. R.; Tao, X. T.; Jiang, M. H.; Fun, H. K.; J. Mol. Struct. 2007, 826, 250.
19. Wang, X. Y.; Deng, Z. X.; Jin, B. K.; Tian, Y. P.; Kin, X. Q.; Spectrochim. Acta, Part A 2002, 58, 3113.
20. Wang, X. Y.; Deng, Z. X.; Jin, B. K.; Tian, Y. I.; Lin, X. Q.; Bull. Chem. Soc. Jpn. 2002, 75, 1669.
21. Bonamico, M.; Fares, V.; Petrilli, L.; Tarli, F.; Chiozzini, G.; Riccuci, C.; J. Chem. Soc., Dalton Trans. 1994, 3349. 22. Livingstone, S. E.; Minkelson, A. E.; Inorg. Chem. 1970, 9,
2545.
23. Gupta, K. C.; Abdulkadir, H. K.; Chand, S.; J. Mol. Catal. 2003, 2002, 253.
24. Subasi, E.; Transition Met. Chem. 2005, 30, 372.
25. Goreshnik, E. A.; Mys’kiv, M. G.; Russ. J. Coord. Chem. 2006, 32, 25.
26. Nanjundan, N.; Selvakumar, P.; Narayanasamy, R.; Hague, R. A.; Velmurugan, K.; Nandhakumar, R.; Silambarasan, T.; Dhandapani, R.; J. Photochem. Photobiol. B2014, 141, 176. 27. Akbar Ali, M.; Bose, R.; J. Inorg. Nucl. Chem. 1977, 39, 265. 28. Khoo, T.-J.; Bin Break, M. K.; Crouse, K. A.; Tahir, I. M.; Ali,
A. M.; Cowley, A. R.; Watkin, D. J.; Tarafder, M. T. H.; Inorgan. Chim. Acta2014, 413, 68.
29. Ahmed, N.; Levision, J. J.; Robinson, S. D.; Uttley, M. F.; Inorg. Synth. 1974, 15, 45.
30. Fish, R. H.; Jaouen, G; Organometallics2003, 22, 2166. 31. Tabassum, S.; Zaki, M.; Arjmand, F.; Ahmadi, I.; J. Photochem.
Photobiol. B2012, 114, 108.
32. Spector, D. L.; Goldman, R. D.; Leinwand, L. A.; Cells: A Laboratory Manual; Cold Spring Harbor Laboratory Press: New York, 1998, ch. 15.
33. Tarafder, M. T. H.; Jin, K. T.; Crouse, K. A.; Ali, M. A.; Yamin, B. M.; Fun, H. K.; Polyhedron 2002, 21, 2547.
34. Ali, M.; Mirza, A.; Butcher, R.; Tarafder, M.; Tan, B.; Ali, A.; J. Inorg. Biochem. 2002, 92, 141.
35. Marchi, A.; Rossi, R.; Magon, L.; Duatti, A.; Pasqualini, R.; Ferretti, V.; Bertolasi, V.; J. Chem. Soc., Dalton Trans. 1990, 1411.
36. Kalaivani, P.; Prabhakaran, R.; Vaishnavi, E.; Rueffer, T.; Lang, H.; Poornima, P.; Renganathan, R.; Vijayapadma, V.; Natarajan, K.; Inorg. Chem. Front. 2014, 1, 311.
37. Senthilraja, D.; Paramaguru, G.; Bhuvanesh, N. S. P.; Reibenspies, J. H.; Renganathan, R.; Natarajan, K.; Dalton Trans. 2011, 4548.
38. Takjoo, R.; Centore, R.; Hakimi, M.; Ali Beyramabadi, S.; Morsali, A.; Inorg. Chim. Acta 2011, 371, 36.
39. Kalaivani, P.; Prabhakaran, R.; Dallemer, F.; Poornima, P.; Vaishnavi, E.; Ramachandran, E.; Vijayapadma, V.; Renganathan, R.; Natarajan, K.; Metallomics2012, 4, 101.
40. Bruce, M. I.; Howard, J.; Nowell, I. W.; Shaw, G.; Woodward, P.; J. Chem. Soc., Chem. Comm. 1972, 1041.
41. Akbar Ali, M.; Dey, K. K.; Nazimudin, M.; Butcher, R. J.; Jasinski, J. P.; Polyhedron 1996, 15, 331.
42. West, D. X.; Ahrweiler, P. M.; Ertem, G.; Scovill, J. P.; Klayman, D. L.; Flippen-Anderson, J. L.; Gilardi, R.; George, C.; Pannell, L. K.; Transition Met. Chem. 1985, 10, 264.
43. Shobadevi, C.; Anilkumar, D.; Singh, S. S.; Gabra, N.; Deepika, N.; Praveenkumar, Y.; Satyanarayana, S.; Eur. J. Med. Chem.
2013, 64, 410.
44. Yu, Q.; Liu, Y.; Zhang, J.; Yang, F.; Sun, D.; Liu, D.; Zhou, Y.; Liu, J.; Metallomics2013, 5, 222.
45. Lepecq, J. B.; Paoletti, C. J.; J. Mol. Biol. 1967, 27, 87. 46. Baguley, B. C.; LeBret, M.; Biochemistry1984, 23, 937. 47. Wyman, T. B.; Nicol, F.; Zelphati, O.; Scaria, P. V.; Plank, C.;
Szoka, F. C.; Biochemistry1997, 36, 3008.
48. Lakowicz, J. R.; Weber, G.; Biochemistry1973, 12, 4161. 49. Ruso, J. M.; Atwood, D.; Garcia, M.; Taboada, P.; Varela, L.
M.; Mosquera, V.; Langmuir2001, 17, 5189.
50. Lahiri, D.; Roy, S.; Saha, S.; Majumdar, R.; Dighe, R. R.; Chakravarty, A. R.; Dalton Trans. 2010, 39, 1807.
51. Zhang, Y.; Qi, Z. D.; Zheng, D.; Li, C. H.; Liu, Y.; Biol. Trace Elem. Res. 2009, 130, 172.
52. Dang, C. V.; Ebert, R. F.; Bell, R.; J. Biol. Chem. 1985, 260, 9713.
53. Lakowicz, J. R.; Principles of Fluorescence Spectroscopy; Kluwer Academic/Plenum Press: New York, 1999.
54. Triller, M. U.; Pursche, D.; Hsieh, W. Y.; Pecoraro, V. L.; Rompel, A.; Krebs, B.; Inorg. Chem. 2003, 42, 6274. 55. Solomon, E. I.; Sundaram, U. M.; Machonkin, T. E.; Chem.
Rev. 1996, 96, 2563.
56. Gajda, T.; Dupre, Y.; Torok, I.; Harmer, J.; Schweiger, A.; Sander, J.; Kuppert, D.; Hegetschweiler, K.; Inorg. Chem. 2001, 40, 4918.
57. Batista, S. C.; Neves, A.; Bortoluzzi, A. J.; Vencato, I.; Peralta, R. A.; Szpoganicz, B.; Aires, V. V. E.; Terenzi, H.; Severino, P. C.; Inorg. Chem. Commun. 2003, 6, 1161.
58. Sanyal, R.; Guha, A.; Ghosh, T.; Mondal, T. K.; Zangrando, E.; Das, D.; Inorg. Chem. 2014, 53, 85.
59. Krishnamorthy, P.; Sathyadevi, P.; Cowlwy, A. H.; Butorac, R. R.; Dharamaraj, N.; Eur. J. Med. Chem. 2011, 46, 3376. 60. Kasibhatla, S.; Tseng, B.; Mol. Cancer Ther. 2003, 2, 573.
Submitted: August 23, 2016