Article
Printed in Brazil - ©2012 Sociedade Brasileira de Química0103 - 5053 $6.00+0.00
A
*e-mail: [email protected]
The Influence of GC/AT Composition on Intercalating and Semi-Intercalating
Binding of Ethidium Bromide to DNA
Poghos O. Vardevanyan,*,a Ara P. Antonyan,a Marine A. Parsadanyan,a
Mariam A. Shahinyan,a Lilit A. Hambardzumyan,a Margarita A. Torosyanb and
Armen T. Karapetianb
aBiophysics Department, Yerevan State University Aleq Manukyan 1, 0025 Yerevan, Armenia
bPhysics Departament, Yerevan State University of Architecture and Construction,
Teryan st.105, 2nd Bld, 0009 Yerevan, Armenia
Os parâmetros de ligação de brometo de etídio (EtBr) com DNA em diversas proporções GC/AT foram determinados usando espectroscopia de absorção e fluorescência. Nossos dados experimentais demonstram claramente a co-existência de tipos de ligação “forte” fluorescente e não-fluorescente em baixas concentrações de EtBr. O complexo fluorescente corresponde ao modelo normal intercalante. O complexo não-fluorescente refere-se à ligação semi-intercalante de EtBr. A constante de ligação (K) e o número de pares de bases correspondentes ao sítio de ligação (n) dos tipos fluorescente (Kf e nf) e não-fluorescente (Knf, nnf) de interações foram determinados. O
tamanho médio do sítio de ligação (n) é igual a 1,5 bp (espectroscopia de absorção), e nf ca. 2 bp
(espectroscopia de fluorescência). Mostrou-se que nnf é dependente da quantidade de GC e n total
é independente.
The binding parameters of ethidium bromide (EtBr) with DNA of various GC/AT ratios were determined using absorption and fluorescence spectroscopy. Our experimental data clearly demonstrate the co-existence of fluorescing and non-fluorescing types of “strong” binding at low concentration of EtBr. The fluorescent complex corresponds to the ordinary intercalative model. The non-fluorescent complex is referred to semi-intercalative binding of EtBr. The binding constant (K) and the number of base pairs corresponding to a binding site (n) of the fluorescent (Kf and nf)
and non-fluorescent (Knf, nnf) types of interactions were determined. The average size of binding
site (n) is equal to 1.5 bp (absorption spectroscopy), and nf ca. 2 bp (fluorescence spectroscopy).
It was shown that nnf is dependent on GC-content and total nis independent of it.
Keywords: DNA, ethidium bromide, adsorption isotherms, spectrophotometry,
spectrofluorometry
Introduction
Large number of biologically active small molecules in cells interact with DNA in a variety of ways, one of which is the intercalation.1-7 Majority of intercalators
might form more than one type of complexes with DNA (multimodal ligands), the prominent representative of which is ethidium bromide (EtBr). Investigations showed that at small values of drug/DNA ratio (r) this ligand may form two types of “strong” complexes with DNA, one of which has been proposed to be a stably bound external binding and second type is the well described intercalation
mode.8-11 The strong external binding mode depend on the
concentration of the ligand and appeared more frequently in GC-regions of DNA.11,12 Existence of the significant
affinity to the GC-regions for this type of interaction led us to the assumption, that there would be different number of binding sites for EtBr on different GC-content DNAs.
Intercalation as the primary binding mode is observed by absorption spectroscopy supported by a red spectrum shift corresponding to the spectrum of free EtBr.13 In fluorescence this event is detected be cause
of the enhancement of the fluorescence amplitude after intercalation.11 However, the employment of these two
In this work we combined both absorption and fluorescence spectroscopy methods to distinguish two binding modes and quantify the population of EtBr intercalated between and external bound with DNA. Obtained results provided the clear evidence of the existence of two “strong” types of binding modes, one of which showed fluorescent signal and therefore represented fully intercalated geometry. Second type of “strong” interaction had no fluorescent signal providing the clue for external binding mode. We suggest that the nonfluorescent strong complex is formed by hemiintercalation in the minor groove of DNA. This complex is stabilized by hydrogen bonds between the ligand and nucleophilic centers of guanine which is exposed in the minor groove of DNA and accessible for the ligand binding. The estimated binding parameters for nonfluorescent complexes of EtBr demonstrated a strong evidence of dependence of this type of interaction on GC-content of DNA.9,12
Experimental
Reagents
Different GC-content DNAs (Clostridium perfringens,
32% GC; calf thymus DNA(CT-DNA) 42% GC and
Micrococcus lysodeikticus, 72% GC) and EtBr were purchased from Sigma Chemical Co. and used without further purification. Other chemicals used were of analytical grade.
Concentration of nucleic acids were measured by using molar extinc tion coefficient values ε260 = 7400 for Cl. perfr.,
6600 for CT and 6600 L mol-1 cm-1 for M. lysod. Ethidium
bromide concentration was determined with an extinction coefficient of 5680 L mol-1 cm-1 at 480 nm.8
Apparatus
Stock solutions of polynucleotide in 1.0 × 10⁻⁴ mol L-1
phosphate (P) were made in sodium citrate buffer
which contains 15 mmol L-1 NaCl and 1.5 mmol L-1
Na-citrate. In each set of experiments the ligand solution of known concentration (5.5 × 10⁻⁵ mol L-1) was mixed
in the appropriate ionic strength buffer and the initial polynucleotide solution sample of the given concentration. Concentration changes of the ligand and polynucleotides due to dilution of both solutions to be mixed were taken into account. UV-Visible absorbance studies were carried out on Pye Unicam SP 8-100 spectrophotometer (England), using cells with optical path length of 10 mm. Fluorescence spectra were monitored on fluorometer FluoroMax TM (France). EtBr and EtBr-polynucleotide
complexes fluorescence was recorded at 610 nm (excitation at 540 nm).12,15,16 The adsorption isotherms in Schatchard’s
coordinates were obtained as described in the literature.7
Results and Discussion
Interaction of EtBr with DNA is usually investigated by absorbance or fluorescence techniques. When EtBr forms a complex with DNA, the electronic distribution of the ligand changes, which is perceptible in the absorbance spectrum with a simultaneous shift to longer wavelength (bathochromic shift) and in the decreasing of value of the molar extinction coefficient,7 whereas in fluorescence the signal amplitude
increases after the formation of the DNA-EtBr complex.11
However, using these techniques separately it is not possible to confirm the manner in which the drug binds to DNA, whether by intercalation, groove binding, or external drug association, because all three may induce qualita tively similar effects.14 One of the reliable means to investigate
the binding process and to distinguish the binding modes is the combination of absorption spectroscopy detecting the total concentration of adsorbed on DNA molecules and fluorescence method showing the amount of intercalated in the double helix molecules.11,17 Earlier we showed that
at low ligand concentrations EtBr may form two “strong” fluorescent and nonfluorescent complexes with B-form of DNA.14 The fluorescent complexes were referred to
the “strong” one and corresponded to the intercalation of this ligand which includes the insertion of the planar phenanthridium ring into the hydrophobic region of double stranded DNA (ds-DNA) base pairs.10 The nonfluorescent
binding corresponded to the ligand hemiintercalative strong binding sites on DNA, where fluorescence of EtBr was quenched due to the direct contact with water molecules. These modes of interactions are accomplished exclusively at low ligand concentrations (r < 0.25) and therefore the experiments here were carried out at 0 ≤ r ≤ 0.25. Besides, to exclude energy migration from fluorescent EtBr molecules to nonfluorescent ones, the r was varied in the interval 0 < r < 0.25. At these EtBr concentrations on DNA its fluorescence quantum yield is constant.11
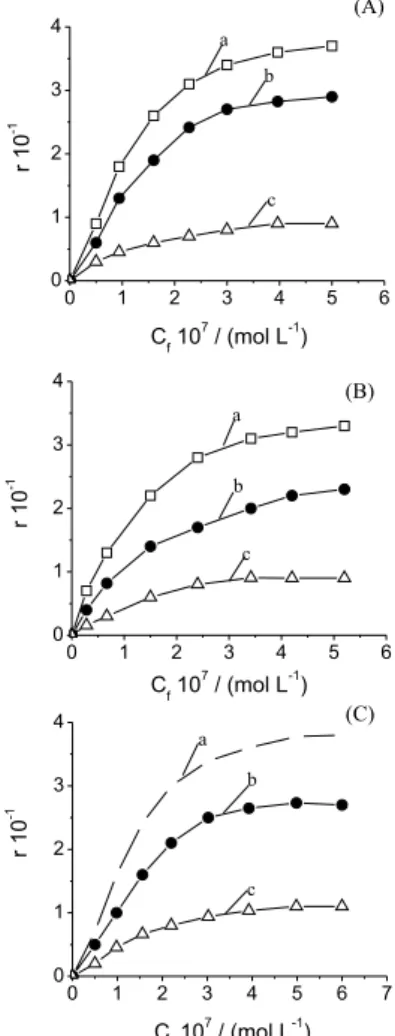
The experimental results of the investigation of the effect of GC-content of DNA on EtBr binding process are represented on Figure 1. Parameter r vs. free dye concentrations (Cf) has been calculated using both the
absorption method for total concentration of bound molecules (curve a) and fluorimetric method for intercalated EtBr molecules (curve b).
nonfluorescent EtBr molecules registered by the absorption technique. The binding curves for the nonfluorescent complex as rnfvs. Cf (curve c) were obtained by subtracting
curve b from a at equal free dye concentrations Cf.
The binding parameters of EtBr fluorescent and nonfluorescent complexes have been obtained by Scatchard analysis of the absorption and fluorescence spectra and are represented in Table 1.
The data of Table 1 show that the binding constants and stoichiometry of the complexes estimated by absorption method are practically independent on the GC-content and correlated with the data obtained in the literature.10,11 The
binding site of the fluorescent complexes n ca. 2.2 ± 0.1 is also in accordance with experimental data available in the literature.13,14
The binding parameters of the nonfluorescent complexes listed in Table 1 show that the binding constant Knf for
smaller and higher GC-content DNAs are the same (Knf ca.
0.8 105 mol-1) whereas this parameter is considerable higher
(Knf=1.2 10
5 mol-1) for CT DNA which may reflect the base
pair distribution differences in CT DNA blocks, which may be considered having random base pair distribution while the Cl. perfr. and M. lysod. DNAs may consist of AT and GC clusters respectively, the structure of which should differ from that of DNA with random base pair distribution. It is known that sequence specificity may be dominated by ability to select binding sites on the basis of groove width allowing optimum van der Waals’ complimentary and specific hydrogen bonding interactions with the groove walls.17 Therefore we registred weak affinity of EtBr for
Cl. perfr. and M. lysod. DNAs. Figure 2 presents data on the number of binding sites (r = 1/2n-1) of EtBr nonfluorescent complex on different AT content DNA. It is seen that
Table 1. Binding constants (K) and stoichiometry (n) of the complexes estimated for EtBr with different GC-content DNAs. Ionic strength µ = 20 mmol L-1
Na+; pH 6.9; T = 25 oC
Method
DNA
Clostridium perfringens
32%
Calf thymus 42%
Micrococcus lysodeikticus
72%
K 10-5 / mol-1 n / b.p. K 10-5 / mol-1 n / b.p. K 10-5 / mol-1 n / b.p.
Absorption Fluorescent Nonfluorescent
4.8 ± 0.04 4.5 ± 0.04 0.8 ± 0.05
1.3 ± 0.2 2.2 ± 0.1 6.3 ± 0.2
5.1 ± 0.05 4.2 ± 0.03 1.2 ± 0.05
1.5 ± 0.1 2.2 ± 0.1 5.5 ± 0.3
4.7 ± 0.04 4.0 ± 0.01 0.8 ± 0.01
1.4 ± 0.1 2.0 ± 0.1 4.0 ± 0.8 b.p.: base pair
Figure 2. Dependence of binding site size (n) on GC-content of DNA. Filled circles for EtBr nonfluorescent complexes. Empty circles data for nonintercalative complexes of EtBr from literature.9 µ= 20 mmol L-1 Na+,
pH = 6.9, T = 25 oC.
Figure 1. Binding curves obtained by two independent methods: absorption (curves a, r vs. Cf ), fluorescent (curves b, rfl vs. Cf ). Curves c (rnf vs. Cf ) were calculated for nonfluorescent complexes by subtraction
ndecreases linearly as the GC content becomes higher and upon the straight line extrapolation to GC = 100%, it corresponds to three nucleotide pairs necessity for binding one molecule of EtBr. These data show that for nonfluorescent complexes the amount of binding sites on DNA is directly proportional to the GC content. Thus the nonfluorescent complex may be considered as GC-specific.
Hydrodynamic and fluorimetric experiments show that at low ligand concentration intercalation process realized by hydrophobic transfer of EtBr from solvent to binding site where complexes stabilized by non covalent molecular interactions (e.g. hydrogen bonds and van der Waals interactions) and is independent on ionic strength of solution. On the contrary, according to our experimental data, binding constant of nonfluorescent strong complexes (Knf) is very sensitive to ionic composition of the
environment: with decreasing from 2 mmol L-1 Na+ up to
100 mmol L-1 Na+, the K
f decreases from 4.1 × 10 -5 mol-1
upto 0.9 × 10⁻⁵ mol-1 (results are not presented).
Analysis of the absorption isotherms of EtBr on different GC-content DNAs shows that, intercalation is the dominant binding mode at the µ≥ 100mmol L-1 Na+ region
and, the contribution of the nonfiuorescent complex on binding process may be ignored, because it makes up less than 10% of all bound mole cules. The decrease of number of nonfluorescent EtBr-DNA complexes is a consequence of faster decrease of Knfcom pared with Kfupon the ionic
strength increase.
The above-mentioned experimental data reveal two strong binding sites on DNA, where fluorescent and nonfluorescent complexes are formed. The nature of the fluorescent intercalation complex is well studied. EtBr intercalates in A and B forms of the DNA helix.18-21 It
is reasonable to assume that the nonfluorescent strong complex is formed owing to the EtBr partial (incomplete) intercalation either in the double helix or in one of its grooves.9 In both of these models, the phenanthridine ring
of EtBr molecule will be accessible for H2O molecules to
quench the dye fluorescence.22 Previously, it was shown
that at certain concentrations EtBr is starting to destabilize the ds-structure of DNA and at corresponding values of r, EtBr is preferably bind with ds-DNA by semiintercalation way. Thus, nonfluorescent strong mode of binding, corresponding to semiintercalation occurs as destabilizing factor. At the same time, the electrostatic mode of binding corresponds to the surface binding of EtBr with DNA. It is well known that EtBr intercalates in the double helix on its minor groove side,23,24 like mithramycin and anthramycin
which prefer the narrow minor groove of GC-rich stretches for binding,25 hence the assumption concerning the
quenched complex formation in the groove seems justified.
The existence of EtBr fluorescent and nonfluorescent strong complexes with DNA eliminates the contradictions arising upon the absorption and fluorimetric studies of the kinetics of its binding to DNA. The absorption technique allows to register three modes of binding kinetics,20 whereas the
fluorimetric method detected only a single kinetics.21,26
Conclusions
In this research, the interaction of non covalently binding ligand EtBr with ds-DNA have been investigated by methods of UV-Vis as well as fluorimetric spectroscopy. Obtained data revealed that EtBr may bind with ds-DNA by several ways forming at least three different types of complexes: strong fluorescent, strong nonfluorescent as well as weak. It is also shown that the formation of fluorescent and nonfluorescent complexes does not depend on the GC-content of DNA that indicates the fact that those ways realized by intercalation mechanism, though strong non fluorescent mode realized by way of hemiintercalation of EtBr molecules into neighboring bases of one of the chains of DNA.
References
1. Chaires, J. B.; Biopolymers 1998, 44, 201.
2. Lane, A. N.; Jenkins, T. C.; Quart. Rev. Biophys. 2000, 33, 255.
3. Rauf, S.; Gooding, J. J.; Akhtar, K.; Ghauri, M. A.; Rahman, M.; Anwar, M. A.; Khalid, A. M.; J. Pharm. Biomed. Anal. 2005,
37, 205.
4. Pastre, D.; Pietrement, O.; Zozime, A.; Le Cam, E.; Biopolymers
2005, 77, 53.
5. Hajian, R.; Shams, N.; Mohagheghian, M.; J. Braz. Chem. Soc.
2009, 20, 1399.
6. Minasyan, S. H.; Tavadyan, L. A.; Antonyan, A. P.; Davtyan, H. G.; Parsadanyan, M. A.; Vardevanyan, P. O.; Bioelectrochemistry
2006, 68, 48.
7. Vardevanyan, P. O.; Antonyan, A. P.; Parsadanyan, M. A.; Pirumyan, K. V.; Muradyan, A. M.; Karapetian, A. T.; J. Biomol. Struct. Dyn. 2008, 25,641.
8. Vardevanyan, P. O.; Antonyan, A. P.; Parsadanyan, M. A.; Davtyan, H. G.; Karapetyan, A. T.; Exp. Mol. Med. 2003, 35, 527.
9. Monaco, R. R.; J. Biomol. Struct. Dyn. 2007, 25, 119. 10. Vardevanyan, P. O.; Antonyan, A. P.; Minasbekyan, L. A.;
Karapetian, A. T.; TheScientificWorld Journal, Proceedings of the Miami Nature Biotechnology winter Symposium, Short
Reports 2002, 13, 1.
11. Le-Pecq, J. B.; Paoletti, C.; J. Mol. Biol. 1967, 27, 87. 12. Borisova, O. F.; Shchyolkina, A. K.; Karapetyan, A. T.,
13. Jankins, T.; Drug-DNA Interaction Protocols, Fox, K. R., ed.; Human Press: Totowa, N.J., 1997.
14. Li, H. J.; Crothers, D. M.; J. Mol. Biol. 1969, 39, 461. 15. Lakowicz, J. R.; Principles of Fluorescence Spectroscopy,
Springer: New York, 2nd edition, 1999.
16. Akbay, N.; Saferoglu, Z.; Gok, E.; J. Fluoresc. 2009, 19, 1045. 17. Tischenco, E. I.; Karapetyan, A. T.; Borisova, O. F.; Mol. Biol.
1996, 30, 1370.
18. Scaria, R. V.; Shafer, R. H.; J. Biol. Chem. 1991, 266, 5417. 19. Rodgers, K. A.; Kinny, P. D.; McGregor, V. R.; Clark, G. R.;
Henderson, G. S.; Nucleic Acids Res. 1996, 24, 4882. 20. Bresloff, D. J.; Crothers, D. M.; J. Mol. Biol. 1975, 95, 103. 21. Madge, D.; Elson, E. L; Wedd, W. W.; Biopolymers 1974, 13,
26.
22. Pritchard, N. J.; Blake, A.; Peacocke, A. R.; Nature 1966, 212, 1360.
23. Gurskii, G. V.; Biophysics 1966, 11, 737.
24. Sobel, H. M.; Tsai, C. C.; Jain, S. C.; Gilbert, S. G.; J. Mol. Biol. 1977, 144, 333.
25. Kopka, M. L.; Yoon, C.; Goodsell, D.; Pjura, P.; Dickerson, R. E.; Proc. Natl. Acad. Sci. U. S. A. 1985, 82,1376.
26. Jovin, T. M.; Striker, G.; Molecular Biology, Biochemistry and Biophysics, Pecht, J.; Rirler, R., eds., Springer-Verlag: Berlin,
1977.
Submitted: April 4, 2012