* Corresponding author.
E-mail addresses: [email protected] (E. Ghasemi) © 2012 Growing Science Ltd. All rights reserved. doi: 10.5267/j.msl.2012.06.031
Contents lists available at GrowingScience
Management Science Letters
homepage: www.GrowingScience.com/msl
Technology change priorities influencing competition quality promotion: Case study of Iran Keaton Polyester Manufacturing Company
Ehsan Ghasemi*, Behrooz Jamali and Pouria Nouri
MS in Entrepreneurship Management, University of Tehran, Tehran
A R T I C L E I N F O A B S T R A C T
Article history: Received March 22, 2012 Accepted 20 June 2012 Available online June 21 2012
In the changing world with various customers’ demands the businesses tend to improve their advantages to beat their rivals by means of better quality, lower prices and so. For Iranian polyester market quality is of crucial importance and is achieved through changing and updating technologies. According to highly regarded model of CAPTECH, which is recommended by UNIDO, technology parameters are defined in each phase and not generally as a whole. In the end the biggest gaps are defined. The main goal is to prioritize the main parameters affecting Iranian polyester company's quality. In order to fulfill our goal, 20 high and medium managers were questioned for this paper. The questions were gathered according to UNIDO samples. After a qualitative and quantitative test we concluded that the biggest gap is for supply chain(56.91) and the lowest gap is for combination phase(43.97).
© 2012 Growing Science Ltd. All rights reserved. Keywords:
Technology change Competitive quality CAPTECH Methodology
1. Introduction
Chan (2000) presented a fuzzy algorithm to define technology advantages in the fuzzy environment. His main goal was to define the implications of the fuzzy theory in economical assessments. He asked decision makers to present the importance of the various factors not just in numbers but in full description by words. The descriptive parameters were divided from “too high” to “too low”. The final results were in fuzzy numbers and after prioritizing the final numbers each technology was attributed to a definite weight. Because the final fuzzy numbers had some ambiguity because of the environmental uncertainty, the cash flow was a triangular fuzzy model and the angles were the most probable, the most pessimistic and the most optimistic quantity, respectively.
Law et al. (2000) presented an instrument to evaluate the needed technology in the needed time. By this instrument, the new technology is evolved and improved to transform the scant capital into maximum competitive advantage. It must be noted that a comprehensive evaluation of technology demands lots of time and money. Nikula et al. (2010) analyzed some data concerning the effects of technology change and by gathering some data suggested that software technology change follows the general change research findings as characterized by the technology S-curve and the Classic Change Curve. In addition, the framework of their method emphasized that such frameworks could present critical questions for management to address when embarking on and then running such projects. Amy (2010) assumed that countries must update their technologies constantly so as to compete in a competitive global industry. Having new technology to product competitive products and enabling workers and engineers to work with the new technology and the needed know-how is of grave importance according to Amy. The main goal of Amy’s study was preparing a sound framework to assess and evaluate the new technology. He concluded that a suitable and reliable technology base enables companies to procure and obtain the best new technology and supply the customers and therefore having a competitive advantage.
Vecchiato and Roveda (2010) explained how to handle the effect and response uncertainty of technology and social drivers of change and discussed some technological forecasting and social change. Savioz and Blum (2002) emphasized the use of standard parameters to measure the firm’s competitive capability. They concluded that the products must be assessed on a global scale according to the global competition. Competitive advantage is a new determinant and not an old commercial standard. Regarding foreign products, multi-national companies must have a unique parameter to analyze the best time to enter the global competition.
Reeda et al. (2000) studied the relationship between TQM and the competitive advantages. They concluded that TQM results in quality-based or price-based advantage for a company. On the other hand, the complexity embedded in TQM is a very reliable hindrance not to let the rivals and competitors to copycat. Nasierowski (1991) studied the relation of Mexican company’s technological progress and increasing its quality. His study was both qualitative and quantitative and reiterated the importance of technology progress, higher skill and expertise.
P. Nouri et al. / Management Science Letters 2 (2012)
1915
knowledge and expertise, and chain of the future events are the main determinants of a sound and comprehensive technology strategy.
3. Conceptual framework
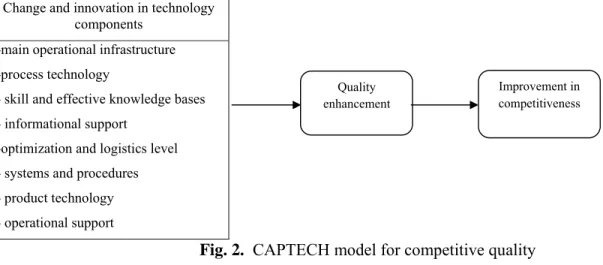
A lot of frameworks have been designed but our framework is based on UNIDO model, which was presented by Hejazi and Binesh (2009). By studying small and medium size companies, they defined 8 parameters and determinants influencing the quality of the technologies in the businesses. Because of the limitations in the quality priorities, the parameters were prioritized according to their strengths and weaknesses. Change in each parameter results in the change of the whole technology.
Change and innovation in technology components
-main operational infrastructure
-process technology
- skill and effective knowledge bases
- informational support
-optimization and logistics level
- systems and procedures
- product technology
- operational support
Fig. 2. CAPTECH model for competitive quality
4. Research method
The current research was done in a specific realm and its goal was the improvement of practical knowledge and the know-how. The technology parameters were categorized in order of precedence according to their weaknesses. Our main goal was to define the influence of technological parameters on the competitive advantages and capabilities of the businesses. Data was gathered according to standard CAPTECH questions asked from 20 average and medium Iranian polyester managers. In the end, we used K-value and Friedman test to prioritize the main factors and parameters.
5. Findings
In this section Chi-Squre test was performed to define the level of significance of technology parameters on competitive quality.
H0: Technology parameters have no effect on the competitive quality of the organization
H1: Technology parameters have some effects on the competitive quality of the organization
Table 1
Technology parameters-
χ
2valuesParameters Sample Size
2
χ
Degree ofFreedom Level of Significance
H0 Supported / Not Supported
BASIC OPERATING INFRASTRUCTURE 30 67.52 5 0.000 Not Supported
PRODUCT TECHNOLOGY 30 51.54 5 0.010 Not Supported
PROCESS TECHNOLOGY 30 69.93 5 0.000 Not Supported
SKILL & KNOWLEDGE BASE 30 31.55 5 0.000 Not Supported
SYSTEMS & PRACTICES 30 15.32 5 0.009 Not Supported
INFORMATION SUPPORT 30 46.28 5 0.008 Not Supported
LOGISTICS & OPTIMISATION LEVEL 30 33.88 5 0.000 Not supported
Quality enhancement
95% confidence interval has less than 5% margin of error. Therefore, the H1 is supported and thus, all
the parameters of technology have an influence on the competitive quality in the Iran Keaton Company.
H0: Production phases have no effects on organizations 'competitive quality
H1: Production phases have some effects on organizations 'competitive quality
Table 2
The results of
χ
2 test to measure the effects of production phase on organization’s competitive qualityParameter Sample
size
2
χ
Degree of freedom significance Level of H0 supported/not supportedPhase 1: supply 30 86.92 6 0.000 Not supported
Phase 2: quality control 30 76.85 6 0.000 Not supported
Phase 3:production 30 86.32 6 0.010 Not supported
Phase 4: 30 83.87 6 0.000 Not supported
Phase 5:test 30 43.03 6 0.000 Not supported
Phase6: cooling 30 17.13 6 0.008 Not supported
Phase 7:combination 30 33.84 6 0.007 Not supported
Phase 8:depletion 30 38.59 6 0.000 Not supported
According to the results in the table above, the significance level for the working phase's parameters at the 95% confidence interval has less than 5% margin of error. Therefore, the H1 is supported and
thus, all the working phases have an influence on the competitive quality in the Iran Keaton Company.
5.1. Measuring the differences between the parameters of technology
H0: There are no significant differences/relationships between the parameters of technology that
affect quality in different stages.
H1: There are significant differences/relationships between the parameters of technology that affect
quality in different stages.
Table 3
Friedman test Friedman test to define the level of significance of the technology parameters
Score averages Technology parameters
5.75 Basic operational infrastructure
4.42 Product technology
5.85 Process technology
3.85 Knowledge and skill
2.82 System and practice
2.75 Informational support
2.58 Logistic base
Table 4 Friedman test
Number of samples
χ
2 Degree of freedom Level of significance30 86.921 6 0.000
P. Nouri et al. / Management Science Letters 2 (2012)
1917
Table 5
Technology parameters priorities in the second phase
Score averages Technology parameters
5.53 Basic operational infrastructure
4.28 Product technology
5.85 Process technology
4.38 Knowledge and skill
2.98 System and practice
2.68 Informational support
2.60 Logistic base
Table 6 Friedman test
Number of samples
χ
2 Degree of freedom Level of significance30 86.921 6 0.000
The Chi-Square significance level observed from the Friedman’s test in the table above (Sig=0.000), at the 95% confidence interval with a degree of freedom (df=6) has less than 5% margin of error. Therefore, the results strongly reject H0 and support the research hypothesis.
Table 7
Friedman test-technology parameters priorities in the third phase
Score averages Technology parameters
6 Basic operational infrastructure
4.58 Product technology
4.47 Process technology
3.40 Knowledge and skill
3.15 System and practice
2.72 Informational support
2.68 Logistic base
Table 8 Friedman test
Number of samples
χ
2 Degree of freedom Level of significance30 86.32 6 0.000
The Chi-Square significance level observed from the Friedman’s test in the table above (Sig=0.000), at the 95% confidence interval with a degree of freedom (df=6) has less than 5% margin of error. Therefore, the results strongly reject H0 and support the research hypothesis. Therefore, we can
conclude that there is a difference between technology parameters in this phase.
Table 9
Technology parameters priorities in the fourth phase
Score averages Technology parameters
6.28 Basic operational infrastructure
4.30 Product technology
4.90 Process technology
3.47 Knowledge and skill
3.55 System and practice
3.03 Informational support
Friedman test
Number of samples
χ
2 Degree of freedom Level of significance30 86.87 6 0.000
The Chi-Square significance level observed from the Friedman’s test in the table above (Sig=0.000), at the 95% confidence interval with a degree of freedom (df=6) has less than 5% margin of error. Therefore, the results strongly reject H0 and support the research hypothesis. Therefore, we can
conclude that there is a difference between technology parameters in this phase.
Table 11
Technology parameters priorities in the fifth phase
Score averages Technology parameters
4 Basic operational infrastructure
4.35 Product technology
4.40 Process technology
4.02 Knowledge and skill
4.70 System and practice
2.88 Informational support
3.65 Logistic base
Table 12 Friedman test
Number of samples
χ
2 Degree of freedom Level of significance30 40.03 6 0.000
The Chi-Square significance level observed from the Friedman’s test in the table above (Sig=0.000), at the 95% confidence interval with a degree of freedom (df=6) has less than 5% margin of error. Therefore, the results strongly reject H0 and support the research hypothesis. Therefore, we can
conclude that there is a difference between technology parameters in this phase.
Table 13
Technology parameters priorities in the sixth phase
Score averages Technology parameters
5 Basic operational infrastructure
5 Product technology
4.65 Process technology
4.27 Knowledge and skill
3.40 System and practice
3.08 Informational support
2.60 Logistic base
With the k value of 17.13, and the freedom degree of 6, the results strongly reject H0 and support the
P. Nouri et al. / Management Science Letters 2 (2012)
1919
Table 14
Technology parameters priorities in the seventh phase
Technology parameters Score averages
Basic operational infrastructure 6.02
Product technology 4.65
Process technology 4
Knowledge and skill 3.08
System and practice 4.08
Informational support 2.65
Logistic base 3.95
With the k value of 25.61, and the freedom degree of 6, the results strongly reject H0 and support the
research hypothesis. Therefore we can conclude that there is a difference between technology parameters in this phase.
6. Conclusion
In this section we present our final results after performing Friedman and Χ2 tests. The priorities are submitted in each phase, respectively:
- Phase 1 (supply phase): process technology, basic operating infrastructure, product technology, skill and knowledge base, information support, system and practice, logistic level
- Phase 2 (quality control): Process technology, basic operational infrastructure, skill and knowledge base, product technology, information support, system and practice, logistic level
- Phase 3(production): Basic operational infrastructure, process technology, skill and knowledge base, information support, product technology, system and practice, logistic level
- Phase 4 Basic operational infrastructure, process technology, skill and knowledge base,
information support, product technology, logistic level, system and practice
- Phase 5(test): Basic operational infrastructure, process technology, skill and knowledge base, information support, product technology, logistic level, system and practice
- Phase 6(cooling): Basic operational infrastructure, product technology, process technology, skill and knowledge base, information support, logistic level, system and practice
- Phase 7 (combination): basic operational infrastructure, product technology, process technology, skill and knowledge base, information support, logistic level, system and practice
- Phase 8(depletion): basic operational infrastructure, process technology, product technology, skill and knowledge base, information support, logistic level, system and practice
According to our findings, the combination phase is the most important phase and must be noted as the main priority. In the combination phase the basic operational infrastructure has the biggest gap and therefore has to be regarded as the most important parameter so as to improve the technology level of the company. The production phase is the second important phase and its main parameters are basic operational infrastructure, product technology, process technology, logistic level, skill and knowledge base, system and practice and information support, respectively.
Acknowledgment
Chan, F.T.S, Chan, M.H., & Tang N.K.H. (2000). Evaluation methodologies for technology selection.
Journal of Materials Processing Technology, 107(1-3), 330-337.
Dupe, M. (1990). Technology and Science, Industry and Education. Australian govt. Pub Service. Ellul, J. (1964). The Technological Society (J. Wilkinson, Trans.). New York: Knopf.
Hejazi, R., & Binesh, M. (2009).Technology evaluation in small to medium enterprises. Industrial management organization publications, Tehran, Iran.
Law, A., Ridway, K., & Atkinson, H. (2000). QFD in new production technology evaluation.
International Journal of Production Economics, 67(2), 103-112.
Lee, A.H.I., Wang, W.M., & Lin, T.Y. (2010). An evaluation framework for technology transfer of new equipment in high technology industry. Technological Forecasting and Social Change, 77(9), 1527-1539.
Moors, E. H.M. (2005). Technology strategies for sustainable metals production systems: a case
study of primary aluminum production in the Netherlands and Norway. Journal of Cleaner
Production, 14(12-13), 1121-1138.
Nasierowski, W. (1991). technology and quality improvements in Mexican companies: some international comparisons. Journal of Quality Management, 5(1), 119-137.
Nikula, U., Jurvanen, C., Gotel, O., & Gause, D.C. (2010). Empirical validation of the classic change curve on a software technology change project. Information and Software Technology, 52(6), 680-696.
Savioz, P., & Blum M. (2002). Strategic forecast tool for SMEs: How the opportunity landscape interacts with business strategy to anticipate technological trends, Technovation, 22(2), 91-100. Sultan, S.S. (2007). Competitive Advantages of SMEs, the Case of Jordan’s Natural Stone Industry.
Universitaire Pers Maastricht, ISBN 978 90 5278 642 1.
Vecchiato, R., & Roveda, C. (2010). Strategic foresight in corporate organizations: Handling the effect and response uncertainty of technology and social drivers of change. Technological