HTLV-1 bZIP Factor Impairs Anti-viral
Immunity by Inducing Co-inhibitory
Molecule, T Cell Immunoglobulin and ITIM
Domain (TIGIT)
Keiko Yasuma1, Jun-ichirou Yasunaga1*, Keiko Takemoto2, Kenji Sugata1, Yuichi Mitobe1, Norihiro Takenouchi3, Masanori Nakagawa4, Yutaka Suzuki5, Masao Matsuoka1*
1Laboratory of Virus Control, Institute for Virus Research, Kyoto University, Sakyo-ku, Kyoto, Japan, 2Laboratory of Biological Protection, Institute for Virus Research, Kyoto University, Sakyo-ku, Kyoto, Japan, 3Department of Microbiology, Kansai Medical University, Hirakata, Osaka, Japan,4North Medical Center, Kyoto Prefectural University of Medicine, Yosano-cho, Kyoto, Japan,5Department of Computational Biology and Medical Science, Graduate School of Frontier Sciences, The University of Tokyo, Kashiwa, Chiba, Japan
*[email protected](JY);[email protected](MM)
Abstract
Human T-cell leukemia virus type 1 (HTLV-1) infects CD4+T cells and induces proliferation of infected cellsin vivo, which leads to the onset of adult T-cell leukemia (ATL) in some infected individuals. The HTLV-1 bZIP factor (HBZ) gene, which is encoded in the minus strand of HTLV-1, plays critical roles in pathogenesis. In this study, RNA-seq and ChIP-seq analyses using HBZ transduced T cells revealed that HBZ upregulates the expression and promoter acetylation levels of a co-inhibitory molecule, T cell immunoglobulin and ITIM domain (TIGIT), in addition to those of regulatory T cells related genes,Foxp3andCcr4. TIGIT was expressed on CD4+T cells from HBZ-transgenic (HBZ-Tg) mice, and on ATL cells and HTLV-1 infected CD4+T cells of HTLV-1-associated myelopathy/tropical spastic paraparesis (HAM/TSP)in vivo. Expression of Blimp1 and IL-10 was upregulated in TIGIT+CD4+cells of HBZ-Tg mice compared with TIGIT-CD4+T cells, suggesting the corre-lation between TIGIT expression and IL-10 production. When CD4+T cells from HBZ-Tg mice were stimulated with TIGIT’s ligand, CD155, their production of the inhibitory cytokine IL-10 was enhanced. Furthermore, dendritic cells from HBZ-Tg mice produced high levels of IL-10 after stimulation. These data suggest that HBZ alters immune system to suppres-sive state via TIGIT and IL-10. Importantly, TIGIT suppressed T-cell responses to another HTLV-1 virus protein, Tax,in vitro. Blocking of TIGIT and PD-1 slightly increased anti-Tax T-cell activity in some HAM/TSP patients. These results suggest that HBZ-induced TIGIT on HTLV-1 infected cells impairs T-cell responses to viral antigens. This study shows that HBZ-induced TIGIT plays a pivotal role in attenuating host immune responses and shaping a microenvironment favorable to HTLV-1.
OPEN ACCESS
Citation:Yasuma K, Yasunaga J-i, Takemoto K, Sugata K, Mitobe Y, Takenouchi N, et al. (2016) HTLV-1 bZIP Factor Impairs Anti-viral Immunity by Inducing Co-inhibitory Molecule, T Cell Immunoglobulin and ITIM Domain (TIGIT). PLoS Pathog 12(1): e1005372. doi:10.1371/journal. ppat.1005372
Editor:Susan R Ross, University of Pennsylvania School of Medicine, UNITED STATES
Received:August 7, 2015
Accepted:December 8, 2015
Published:January 6, 2016
Copyright:© 2016 Yasuma et al. This is an open access article distributed under the terms of the Creative Commons Attribution License, which permits unrestricted use, distribution, and reproduction in any medium, provided the original author and source are credited.
Data Availability Statement:All raw sequence data were deposited in the DNA Data Bank of Japan (DDBJ) under the accession number DRA003229 and DRA003744.
Author Summary
HTLV-1 is a T-cell-tropic, latently infectious virus that causes a T-cell malignancy, ATL, and inflammatory diseases. The mechanisms by which HTLV-1 evades the immune response and establishes chronic infection are not yet understood. Recent studies have demonstrated that TIGIT, a co-inhibitory molecule, is expressed on tumor infiltrating T cells and T cells during viral infection, which suppresses the anti-tumor and anti-viral immune responses. Furthermore, blockade of co-inhibitory molecules of TIGIT and pro-grammed cell death-1 (PD-1) disrupts immune checkpoints and enhances anti-tumor activity. We found that TIGIT is upregulated by HBZ, and TIGIT impairs anti-virus immune responses through an immunosuppressive cytokine, IL-10. These findings show that HTLV-1 utilizes a co-inhibitory molecule on infected cells to evade the host immune responses. We also found that blocking of TIGIT and PD-1 on peripheral blood mononu-clear cells in HTLV-1 infected patients enhances immune responses to virus. These find-ings suggest a mechanism by which HTLV-1 shapes a microenvironment favorable to its persistence using induced TIGIT. TIGIT is a potential therapeutic target for ATL and HTLV-1 infected patients.
Introduction
Oncogenic viruses, including Epstein-Barr virus (EBV), Kaposi’s sarcoma-associated herpesvi-rus (KSHV), human papilloma viherpesvi-rus (HPV), hepatitis B viherpesvi-rus (HBV), hepatitis C viherpesvi-rus (HCV), Merkel cell polyomavirus and human T-cell leukemia virus type 1 (HTLV-1), cause approxi-mately 12% of human cancers. In these virus-induced cancers, a limited number of viral pro-teins play critical roles in oncogenesis—proteins that include HBx for HBV, E6 and E7 for HPV, and Tax and HTLV-1 bZIP factor (HBZ) for HTLV-1 [1]. These viral proteins influence a cell’s epigenetic status and/or modulate a cell’s transcriptional machinery, leading to the transformation of infected cells.
HTLV-1 causes adult T-cell leukemia (ATL) in a fraction of infected individuals after a long latent period [2]. HTLV-1 induces clonal proliferation of infected cellsin vivo[3]. TheHBZ
gene, which is encoded in the minus strand, is expressed in all ATL cases and is reported to cause inflammation and T-cell lymphoma, and associate with latency [4–6]. However, the pre-cise mechanism by which this occurs is not fully understood. HTLV-1 causes the proliferation of infected cellsin vivo, but the host immune response influences the population dynamics of infected cells. One of the main issues for HTLV-1 pathogenesis is how HTLV-1 infected cells are enabled to evade the host immune response and establish the chronic infection. In HTLV-1 infected individuals, the provirus is mainly present in CD4+CCR4+CADM1+T cells, indicating that this virus targets a certain subpopulation of T cells [7,8]. Furthermore, this virus is fre-quently detected in Foxp3+T cellsin vivo[9]. Since HBZ enhances transcription of theFoxp3
gene through enhanced TGF-β/Smad signaling [10], it is thought that HBZ alters the immuno-phenotype of infected cells. Although Foxp3 induction may affect the immune status of infected individuals, it is not yet certain how HTLV-1 causes immunosuppression in its hosts.
Members of the CD28 family, especially the stimulatory molecule CD28 and the co-inhibitory molecules CTLA-4 and PD-1, play important roles in regulating T-cell function [11,
12]. Several cancers have been shown to exploit such immune checkpoint pathways to evade the host immune responses; thus, blocking of these pathways is a promising new strategy for cancer therapy. Indeed, blocking antibodies have shown to be effective for melanoma and other cancers [13,14]. Another inhibitory molecule of the CD28 family is T cell
Development of Innovative Research on Cancer Therapeutics (P-DIRECT), Ministry of Education, Culture, Sports, Science and Technology of Japan (to JiY). This study was also supported in part by the JSPS Core-to-Core Program A, Advanced Research Networks. The funders had no role in study design, data collection and analysis, decision to publish, or preparation of the manuscript.
immunoglobulin and ITIM domain (TIGIT), which is expressed on activated T cells, regula-tory T (Treg) cells, and NK cells. TIGIT binds to CD155 (also known as poliovirus receptor) and CD112 on dendritic cells (DCs), and TIGIT competes with a co-stimulatory receptor, CD226, for CD155 binding [15]. TIGIT suppresses T-cell proliferation and function by inhibit-ing the bindinhibit-ing of CD155 to CD226, through an intrinsic inhibitory signal via the ITIM domain of TIGIT or by enhancing IL-10 production from DCs through a reverse signal via CD155 [16–18]. Furthermore, TIGIT on T cells inhibits T-cell responses that are implicated in anti-tumor and anti-viral immunity [19]. It has been clearly shown that TIGIT plays critical roles to control viral infectionin vivo[19].
In this study, we analyzed epigenetic and transcriptional changes induced by HBZ, and we identified TIGIT as a target of HBZ. HBZ expression upregulatedIL-10mRNA in
TIGIT+CD4+T cells. TIGIT was also implicated in enhanced IL-10 production from DCs. Fur-thermore, TIGIT was highly expressed on ATL cells and 1 infected cells from HTLV-1-associated myelopathy/tropical spastic paraparesis (HAM/TSP) patients. TIGIT-Fc could suppress T-cell responses to a viral antigen, Tax, suggesting that HBZ-induced TIGIT is impli-cated in evasion of the host defense.
Results
Epigenetic and transcriptional changes induced by HBZ
To analyze transcriptional and epigenetic changes induced by HBZ, we transduced retroviruses expressing HBZ and GFP into mouse primary CD4+T cells. Our previous studies showed that HBZ expression in mouse T cells induced immunophenotypic changes, including Foxp3 expression and effector/memory T-cell phenotype, similar to those in human HTLV-1 infected cells [5]. After sorting GFP+cells, we analyzed the transcriptome of HBZ expressing CD4+T cells by RNA-seq. We found that 12,620 genes were expressed at>1 reads per kilobase of exon
per million mapped reads (RPKM) in two independent experiments. To identify HBZ-regu-lated genes, we selected differentially expressed genes, which showed a higher or lower expres-sion in HBZ expressing samples compared to the control (Fig 1A). We narrowed down our focus to genes with4 times or1/16 times the expression level of the control. We thus iden-tified 150 genes upregulated and 68 genes suppressed by HBZ (S1andS2Tables). Genes upre-gulated by HBZ with log2fold change>2.9 are shown inS1 Table. Upregulated genes included Foxp3,TIGIT,PD-1,IL-10,IL-4,CCR4, andNRP1genes.
We also assessed the association of the transcriptome with epigenetic modifications induced by HBZ by performing Chromatin immunoprecipitation (ChIP)-seq for 4 histone modifica-tions: H3ac (H3 pan-acetyl), H3K9ac, H3K27ac, and H3K18ac. We found about 11,000 bind-ing peaks of ChIP-seq tags in each sample, and peaks around transcription start site (TSS) were analyzed (S3 Table). The peaks for the acetylation of pan-H3 and specific lysine residues of H3 were associated with genes as follows; 43.3% and 44.2% of peaks of H3ac in HBZ and control CD4+T cells; 52.9% (HBZ) and 46.9% (control) peaks of H3K9ac, 32.8% (HBZ) and 35.6% (control) peaks of H3K27ac, and 28.2% (HBZ) and 28.1% (control) peaks of H3K18ac, respec-tively. Correlations between the expression of mRNA and the alteration of histone modifica-tions were observed in several Treg cells associated genes includingFoxp3,TIGITandCcr4
(Fig 1B) [10]. All histone acetylation marks showed similar pattern, and were correlated to the
To explore whether HBZ itself interacts with theTIGITassociated genome, we performed ChIP-seq analysis with ectopic 3xFLAG-HBZ fusion protein expressing mouse CD4+T cells using FLAG antibody. ChIP-seq tag peaks were analyzed when they were located around TSS. 201 peaks were identified in HBZ-FLAG expressing CD4+T cells, 37 (18.4%) of which were associated with genes (S3andS4Tables). TIGIT was one of the regions significantly enriched by anti-FLAG while CCR4 and Foxp3 were not enriched in this study. We further confirmed that the promoter ofTIGITwas enriched by anti-FLAG using the ChIP-qPCR (Fig 1D). These results suggested that HBZ was recruited to theTIGITpromoter, thereby inducing its
transcription.
HBZ induces TIGIT expression
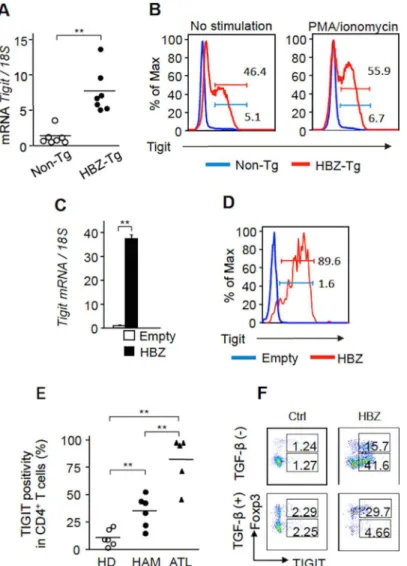
To study the effect of HBZ on TIGIT expression, we first analyzed TIGIT expression in HBZ-Tg mice.TIGITmRNA was upregulated in CD4+T cells from HBZ-Tg mice (Fig 2A). Furthermore, TIGIT expression was increased on resting and activated CD4+T cells of HBZ-Tg mice by flow cytometry (Fig 2B). Expression of HBZ via a retrovirus vector in mouse CD4+T cells also induced theTIGITgene transcription (Fig 2C), and TIGIT expression on CD4+T cells (Fig 2D).
Next we analyzed whether TIGIT is expressed on ATL cells and HTLV-1 infected cells. It has been reported that HTLV-1 infected cells are CADM1+and ATL cells are CD3lowCD4+[8,
20,21]. We analyzed TIGIT expression on these cells by flow cytometry. TIGIT expression was increased on both ATL cells and HTLV-1 infected cells of HAM/TSP patients (Fig 2E,
Table 1). These findings suggest that HTLV-1 infection induces TIGIT expression. To check
this possibility, human T cells were infected by HTLV-1 through co-culture with irradiated MT-2 cells.De novoinfection also induced expression of TIGIT on infected cells (S1 Fig). Fur-thermore, to confirm whether HBZ is responsible for TIGIT expression, HBZ expression was suppressed by siRNA. Suppressed HBZ expression led to decreased TIGIT transcripts in ATL-43T cells (S2 Fig), suggesting that HBZ indeed induces TIGIT expression.
It has been reported that Foxp3 regulates TIGIT expression [22]. Since HBZ also induces transcription of theFoxp3gene through interaction with Smad2/3 and p300 [10], HBZ-induced Foxp3 might be implicated in TIGIT expression. When we transduced retrovirus expressing HBZ into mouse primary CD4+T cells in the presence or absence of TGF-β, HBZ strongly induced Foxp3 expression in the presence of TGF-β. We found that HBZ induces TIGIT expression on both Foxp3+and Foxp3-CD4+T cells (Fig 2F), indicating that HBZ can induce TIGIT expression regardless of Foxp3 expression.
We have reported that bothHBZRNA and protein possess different effects on transcription of cellular genes [23,24]. To study whetherHBZRNA and protein induces TIGIT expression on CD4+T cells, recombinant retrovirus expressing wild-type (wt) or mutant HBZ and GFP was transduced into mouse activated CD4+T cells. In the TTG mutant, the start codon ATG is replaced by TTG. Therefore, TTG mutant does not generate its protein. In the SM mutant, the entire coding region of HBZ is mutated with silent mutations, which indicates that the SM
Fig 1. TIGIT transcription is regulated by HBZ.(A) Volcano plots of p-value (y-axis) against log2fold
change (x-axis: HBZ expressing murine primary T cells vs. control cells) for RNA-seq data. (B) RNA-seq and ChIP-seq results of three Treg related genes. RNA-seq was performed twice and ChIP-seq was performed once for each. (C) The enrichment of theTIGITpromoter region by the indicated histone marks or isotype control was measured by ChIP-qPCR. The % input of HBZ expressing murine primary CD4+T cells or control
cells is shown. (D) The enrichment of the TIGIT promoter regions by anti-FLAG was analyzed by ChIP-seq in HBZ-FLAG expressing cells. The detected peak in the TIGIT promoter region was shown as the dotted box. The enrichment of the TIGIT promoter regions by anti-FLAG or isotype control was measured by ChIP-qPCR using the primers indicated. Results shown are the mean±SD in triplicate (C, D).
encodes the same protein while its RNA sequences and secondary structure are altered. Both TTG and SM mutant HBZ induced TIGIT expression on CD4+T cells like wtHBZ (Fig 3A), indicating that bothHBZRNA and protein could induce TIGIT expression. Enhanced TIGIT expression was more potent by HBZ protein (SM) compared withHBZRNA (TTG).
Next we examined the effect of HBZ on the promoter activity ofTIGIT. wtHBZ and mutant HBZ slightly enhanced transcription fromTIGITpromoter (Fig 3B). In the presence of phor-bol myristate acetate (PMA)/ionomycin stimulation, bothHBZRNA and protein activated transcription from theTIGITpromoter (Fig 3C) although effect of HBZ protein was more
Fig 2. HBZ upregulates TIGIT expression.(A)TIGITmRNA was increased in CD4+T cells of HBZ-Tg mice (n = 7) compared with those of non-Tg mice (n = 7). (B) TIGIT expression was enhanced on resting and activated CD4+T cells from HBZ-Tg mice by flow cytometry (FCM). The representative histogram of two
independent experiments is shown. (C) A retrovirus expressing HBZ or control retrovirus was transduced into mouse primary CD4+T cells.TIGITtranscripts were measured by realtime PCR. Results are the mean±SD
in triplicate. Three independent experiments were performed and the representative results are shown. (D) Expression of TIGIT on HBZ transduced mouse primary CD4+T cells was measured by FCM. The
representative result was shown for two independent experiments. (E) Expression of TIGIT on CD3lowCD4+T
cells from ATL patients (n = 5) and CD4+CADM1+T cells from HAM/TSP patients (n = 6) and healthy donors (HD, n = 6) were measured by FCM. (F) Expression of TIGIT on HBZ-transduced murine primary CD4+cells
and control cells in the presence or absence of TGF-βwas measured by FCM. Two independent experiments were performed and the representative results are shown.*P<0.05,**P<0.01.
potent than that ofHBZRNA. This finding is consistent with the result ofFig 3A. Furthermore, Tax activated transcription fromTIGITpromoter, which was also augmented by HBZ (Fig 3D). Transcription level of HBZ expression vectors was analyzed by realtime PCR (S3 Fig),
Table 1. Expression of TIGIT and PD-1 on ATL cells and HTLV-1 infected CD4+ T cells.*
Disease Type TIGIT-PD1- TIGIT+PD1- TIGIT-PD1+ TIGIT+PD1+
ATL #1 (c) 0.06 0.61 1.91 97.4
ATL #2 (c) 7.38 4.38 19.6 68.6
ATL #3 (c) 0.31 21.3 0.15 78.3
ATL #4 (a) 51.2 39.8 2.66 6.38
ATL #5 (a) 2.69 1.76 1.76 93.8
HAM/TSP #1 17.8 18.9 12.0 51.3
HAM/TSP #2 34.5 30.2 14.3 21.1
HAM/TSP #3 13.2 19.9 15.6 51.2
HAM/TSP #4 18.1 13.6 12.6 55.7
HAM/TSP #5 20.8 24.1 11.9 43.2
Healthy donors 75.3±8.91 3.09±1.05 13.8±3.73 7.89±4.44
*For acute ATL cases, the numbers indicate the percentage of CD3lowCD4+ATL cells in each category. For HAM/TSP cases, the numbers indicate the
percentage of CD4+CADM1+T cells. In healthy donors, the numbers indicate the percentage of CD4+T cells. The mean percentages (±SD) from 4
donors are shown for healthy donors. (a): acute ATL,
(c): chronic ATL.
doi:10.1371/journal.ppat.1005372.t001
Fig 3. Effect of HBZ on theTIGITgene promoter.(A) A retrovirus expressing wild-type HBZ, HBZ-RNA (TTG), HBZ-protein (SM) or control retrovirus was transduced into mouse primary CD4+T cells. TIGIT
expression on transduced T cells was analyzed by FCM. Two independent experiments were performed, and the representative results are shown. (B)TIGIT-promoter-Luc vector was transfected to Jurkat cells with wt or mutant HBZ. Luciferase activity was measured 24 hours after transfection. (C)TIGIT-promoter-Luc vector was transfected to Jurkat cells with 600 ng of wt or mutant HBZ. Luciferase activity was measured four hours after PMA/ionomycin (P/I) stimulation. (D) Jurkat cells were cotransfected with TIGIT-promoter-Luc, 300 ng of Tax expression vector, 100 ng of vectors expressing wt or mutant HBZ, and pGL4-TK. Two independent experiments were performed, and the representative results are shown. Results are the mean±SD.
*P<0.05,**P<0.01.
which showed that activation ofTIGITpromoter is not caused by different transcription level of each expression vector. When recombinant retrovirus expressing HBZ was transduced, mouse T cells were activated by anti-CD3 antibody and antigen-presenting cells (APCs) since mouse retrovirus can infect only dividing cells. These findings suggest that HBZ activates the
TIGITgene transcription along with cell activation or Tax.
HBZ enhances IL-10 production
It has been reported that TIGIT+Treg cells exhibit a more potent suppressive function than TIGIT-Treg cells [25]. As the molecular basis of this stronger suppression, the immunosup-pressive cytokine IL-10 and fibrinogen-like protein 2 (Fgl2) were identified. Expression of
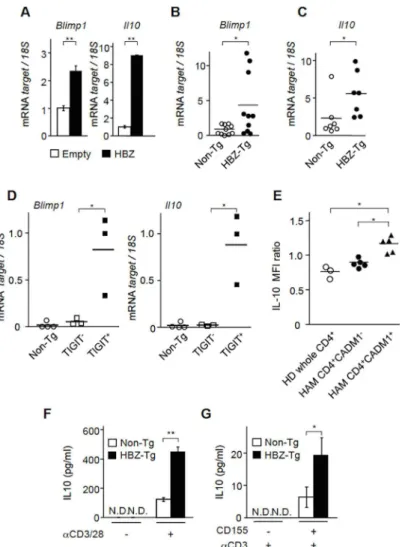
Blimp1, a transcription factor that transactivatesIL-10, is upregulated in TIGIT+Treg cells [26]. Therefore, we studied whether HBZ influences the expression ofBlimp1andIl-10. When HBZ was expressed in mouse primary CD4+T cells, bothBlimp1andIl-10gene transcriptions were enhanced (Fig 4A). Furthermore, transcripts of these genes were upregulated in CD4+T cells from HBZ-Tg mice compared to those of non-Tg mice (Fig 4B and 4C). Increased Blimp1+CD4+T cells were confirmed in HBZ-Tg mice by flow cytometry (S4 Fig). To analyze correlation between expression of these genes and TIGIT, we sorted TIGIT+and
−subpopulation in CD4+T cells of HBZ-Tg mice and analyzed transcription levels ofBlinp1 andIL-10genes. Level of theBlinp1andIL-10genes transcription of TIGIT+T cells was much higher than those of TIGIT-T cells and CD4+T cells of non-Tg mice (Fig 4D), indicating the linkage between TIGIT expression and these genes. Next, we analyzed IL-10 production in HTLV-1 infected cells of HAM/TSP patients. Intracytoplasmic IL-10 was increased in CD4+CADM1+T cells of HAM/TSP patients compared with CD4+CADM1-T cells of HAM/ TSP patients and CD4+T cells of healthy donors after activation (Fig 4E,S5 Fig), suggesting that IL-10 production was enhanced in HTLV-1 infected T cells.
As shown inFig 4A and 4D, HBZ enhancedIL-10transcription. Next we measured IL-10 protein level by T-cell activation. CD4+T cells from HBZ-Tg secreted higher level of IL-10 by stimulation of anti-CD3 and anti-CD28 antibodies compared with those of non-Tg mice (Fig 4F). It has been reported that depletion of TIGIT suppresses IL-10 production, suggesting that TIGIT expression is closely linked with IL-10 [27]. Furthermore, this study also showed that only TIGIT+CD4+T cells expressed higher level of IL-10 compared with TIGIT-CD4+T cells. Therefore, we analyzed whether engagement of TIGIT by its ligand CD155 enhanced IL-10 production. IL-10 production by anti-CD3 antibody was analyzed in the presence or absence of CD155 [27]. As shown inFig 4G, CD155 augmented IL-10 production in CD4+T cells of HBZ-Tg mice although its secretion was not detected without CD155 stimulation at the protein level. Thus, HBZ expression itself induces IL-10 transcription likely through enhancedBlimp1
transcription, and furthermore TIGIT-mediated signal also augments it. Since IL-10 is an immunosuppressive cytokine that enables cancer cells evade the host immune system [28], these effects of HBZ are implicated in evasion of host defense to infected cells.
HBZ suppresses Fgl2 and CD226 expression
Fgl2 is a potent suppressive effector molecule of TIGIT+Treg cells [25]. In contrast toIl-10and
Blimp1, transcription ofFgl2was distinctly suppressed in HBZ expressing CD4+T cells (Fig 5A). TheFgl2gene transcription was suppressed in both TIGIT+and TIGIT-T cells (Fig 5B), indicating that HBZ decreases this transcript regardless of TIGIT expression. Fgl2 transcript was not downregulated in ATL samples (S6 Fig).
EBPα-induced activation (Fig 5C). We measured transcription level of C/EBPαusing realtime PCR, and found that HBZ did not influence transcription of C/EBPα(S7 Fig). This result is consistent with our previous report that HBZ suppresses C/EBPαsignaling activation and the expression of its target genes by physical interference [29]. Thus, HBZ impairs the suppressive function of TIGIT+Treg cells by interaction with C/EBPαleading to suppressedFgl2 transcrip-tion. This finding coincides with our previous report that HBZ induced Treg cells were func-tionally impaired by interaction between HBZ and Foxp3 [5], indicating that HBZ selectively modulates expression of immunosuppressive molecules in T cells.
Fig 4. HBZ enhances IL-10 production.(A) The levels ofBlimp1andIL-10mRNA were measured in HBZ-transduced murine primary CD4+T cells and control cells by realtime PCR. This experiment was carried out
in triplicate, and the mean values±SD are shown. Three independent experiments were performed and the representative data are shown. (B) The levels ofBlimp1were measured in CD4+T cells from HBZ-Tg (n = 10)
and non-Tg (n = 10) mice. (C) The levels ofIL-10mRNA were measured in CD4+T cells from HBZ-Tg (n = 7)
and non-Tg (n = 7) mice using realtime PCR. (D) The levels ofBlimp1andIL-10mRNA were measured in CD4+T cells from non-Tg (n = 4) and TIGIT+CD4+and TIGIT-CD4+T cells from HBZ-Tg (n = 3) mice. (E)
Expression of IL-10 was measured by FCM in CD4+T cells from HD (n = 3) and CD4+CADM1+and
CD4+CADM1-cells from HAM/TSP patients (n = 5). IL-10 MFI ratio to isotype control was analyzed. (F) CD4+
T cells from HBZ-Tg mice and from non-Tg mice were cultured with or without plate-coated anti-CD3 mAb (1μg/ml) and soluble anti-CD28 mAb (1μg/ml) for 24 hours. IL-10 production was measured by ELISA. N.D., not detected. (G) CD4+T cells from HBZ-Tg mice and from non-Tg mice were cultured in the presence of
plate-coated anti-CD3 mAb (1μg/ml) with or without plate-coated CD155 (1μg/ml) for 12 hours. Results shown are the mean±SD. The representative result was shown from two independent experiments. *P<0.05,**P<0.01.
TIGIT competes with a co-stimulatory receptor, CD226, for binding to CD155 and CD112 [16]. It has been reported that T-cell activation induces expression of both CD226 and TIGIT on CD4+T cells [27]. Therefore, we next evaluated the effect of HBZ onCD226transcription.
CD226mRNA was suppressed in HBZ expressing vector-transduced CD4+T cells and CD4+T cells from HBZ-Tg mice (Fig 5D and 5E), suggesting that HBZ inhibits transcription of the
CD226gene and likely augments the function of TIGIT through suppression of its competitor. However,CD226transcripts were not always suppressed in ATL cases (S8 Fig), indicating that Tax expression and cell activation state of ATL cells might influence its transcription.
HBZ modulates a DC phenotype by TIGIT on CD4
+T cells
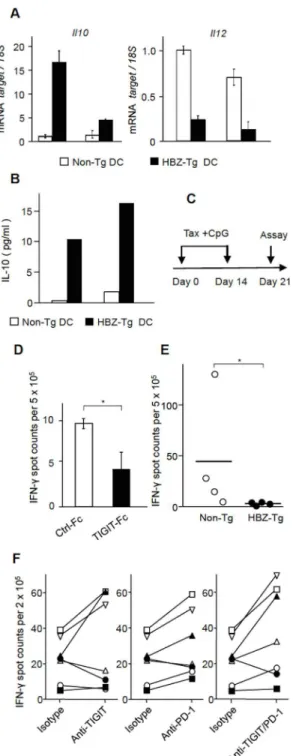
Binding of TIGIT to CD155 on DCs modulates them to acquire the immunomodulatory phe-notype of increased IL-10 production and decreased IL-12p40 production–a DC phenotype that in turn inhibits T-cell activation [16]. Does this phenomenon occur in HBZ-expressing mice? We stimulated splenocytes from HBZ-Tg and non-Tg mice with LPS and then isolated DCs as CD11c+cells. In HBZ-Tg mice, DCs do not express HBZ.IL-10transcript was remark-ably increased and IL-12p40 production was severely suppressed in DCs from two HBZ-Tg mice (Fig 6A). Similarly, increased production of IL-10 from activated DCs was also confirmed
Fig 5. HBZ suppresses Fgl2 and CD226 expression.(A)Fgl2mRNA was quantified in HBZ-expressing murine primary CD4+T cells and control cells by realtime PCR. This experiment was carried out in triplicate,
and the mean values±SD are shown. Three independent experiments were performed and the
representative results are shown. (B) The levels ofFgl2mRNA were measured in CD4+T cells from non-Tg
(n = 4) and TIGIT+CD4+and TIGIT-CD4+T cells from HBZ-Tg (n = 3) mice. (C) Jurkat cells were
cotransfected with 500 ng of FGL2-promoter-Luc, pME18Sneo-sHBZ, 500 ng of pcDNA-C/EBPαand pGL4-TK. Luciferase activity was measured after 24 hours. Luciferase assay was carried out in triplicate, and the mean values±SD are shown. Three independent experiments were performed and the representative
results were shown. (D) TheCD226gene transcript was quantified in HBZ-expressing murine primary CD4+
T cells and control cells. This assay was carried out in triplicate and the mean values±SD are shown. Three independent experiments were performed and the representative results were shown. (E) TheCD226gene expression was measured in CD4+T cells from HBZ-Tg (n = 7) and non-Tg (n = 7) mice by realtime PCR.
*P<0.05,**P<0.01.
Fig 6. TIGIT suppresses T-cell response to Tax.(A) The production of IL-10 and IL-12 by DCs was modulated in HBZ-Tg mice. Splenocytes from HBZ-Tg mice and non-Tg mice were stimulated by LPS for 12 hours, and then DCs were sorted by FACS Aria II. The levels ofIL-10andIL-12mRNA in DCs were
measured by realtime PCR. Transcripts were quantified in triplicate and the mean values±SD are shown. (B) Splenocytes from HBZ-Tg and non-Tg mice were stimulated by LPS overnight followed by sorting for DCs. Sorted cells were then cultured in the presence of LPS for 24 hours. The protein levels of IL-10 in cultured supernatants were measured by Cytometric Bead Array (CBA). Three independent experiments were performed and the representative result was shown. (C) Mice were immunized with Tax protein and CpG at day 0 and 14, and then sacrificed at day 21 for ELISPOT analysis. (D) Splenocytes from a Tax-immunized mouse were subjected to ELISPOT assay using Tax peptide stimulation along with TIGIT-Fc or control Fc conjugated beads. This assay was performed in triplicate and the results shown are the mean±SD. The
by cytometric bead array (Fig 6B). These features are similar to those of DCs stimulated by TIGIT-Fc [16], suggesting that TIGIT on CD4+T cells is implicated in changing the phenotype of DCs in these mice.
Effects of TIGIT on anti-Tax T-cell responses
TIGIT on T cells is implicated in chronic viral infection [19]. This study also suggest that the induction of TIGIT on HBZ expressing CD4+T cells modulates immune responses through increased production of IL-10 from both T cells and DCs—an effect that would likely generate a microenvironment advantageous to the persistence of HTLV-1 infected cells and ATL cells. To explore how TIGIT influences immune responses, we analyzed the effect of TIGIT-Fc on interferon-γ(IFN-γ) production of T cells stimulated by Tax peptides using enzyme-linked immunosorbent spot (ELISPOT) assay. C57BL/6J mice were immunized twice with recombi-nant Tax protein and CpG adjuvant (Fig 6C). Splenocytes were then stimulated with pooled Tax peptides along with beads conjugated with TIGIT-Fc or control-Fc. As shown inFig 6D, the spots were decreased in the presence of TIGIT-Fc, indicating that TIGIT impairs anti-Tax T-cell response. When we immunized HBZ-Tg (n = 4) and non-Tg mice (n = 4) by Tax protein and CpG, the spots were severely suppressed in HBZ-Tg mice (Fig 6E), which indicates that T-cell responses to Tax are impaired in HBZ-Tg mice. Since HTLV-1 infected T-cells and ATL T-cells express high levels of TIGIT on their surfaces (Fig 2E), this data suggests that TIGIT on such cells may impair anti-Tax T-cell activityin vivo.
PD-1 is another co-inhibitory receptor expressed on T cells and a major target for immune checkpoint therapy. This study showed thatPD-1transcript was upregulated by HBZ accord-ing to RNA-seq data (S1 Table), and PD-1 was expressed on HBZ expressing CD4+T cells (S9 Fig), indicating that PD-1 is also a target of HBZ. We found that both TIGIT and PD-1 were expressed on most ATL cells and HTLV-1 infected cells of HAM/TSP patients (Table 1), as well as in CD8+T cells of HAM/TSP patients (S5 Table). Since the positivity of TIGIT on CD8+T cells is higher than proviral load, TIGIT expression on CD8+T cells is likely induced by other mechanism than HTLV-1 infection. In consistent with this finding, increased PD-1 expression on CD8+T cells of ATL patients was also reported [30]. Recently, monoclonal anti-bodies to PD-1 or its ligand, PD-L1, have exhibited clinical efficacy for patients with various cancers [15]. Furthermore, combined treatment with anti-PD-1 and anti-TIGIT antibodies sig-nificantly augments CTL activity against cancer cells [31]. Therefore, we analyzed the effects of anti-TIGIT and anti-PD-1 antibodies on thein vitroanti-Tax activity of T cells from HAM/ TSP patients. As shown inFig 6F, the spots of IFN-γwere increased by anti-TIGIT antibody in three cases, and by anti-PD-1 antibody in five cases and both antibodies in five cases. Thus, anti-TIGIT and PD-1 antibodies augmented anti-Tax T-cell responses in some HAM/TSP patients.
Discussion
Antigen recognition by the T-cell receptor and a second signal mediated by the CD28-CD80/ 86 co-stimulatory pathway are critical for T-cell activation. In addition, a multitude of other co-stimulatory and co-inhibitory pathways are also involved in T-cell activation [12]. In partic-ular, co-inhibitory receptors are pivotal in suppressing excess immune responses. Recently,
ELISPOT assay. (F) PBMCs from seven HAM/TSP patients (n = 7) were subjected to ELISPOT assay with Tax peptide stimulation in the presence or absence of anti-TIGIT and/or anti-PD-1 antibodies. The number of IFN-γsecreting cells normalized to the negative control is shown. Each symbol represented each patient. Results shown are the mean±SD.*P<0.05,**P<0.01.
antibodies to two co-inhibitory receptors, CTLA-4 and PD-1, called immune checkpoint block-ing antibodies, have attracted attention as novel therapeutic drugs, since they exhibit remark-able clinical efficacy for patients with various cancers by reinvigorating exhausted CD8+T cells [15]. Here we demonstrate that the HBZ induces TIGIT expression, which leads to increased production of IL-10 via T cells and DCs. Increased IL-10 production is likely associated with immunosuppressive effects on the host immune system. Furthermore, this study suggests that TIGIT suppresses anti-Tax T-cell responsesin vitro. Antibodies to TIGIT and/or PD-1 enhanced anti-Tax T-cell response in peripheral blood mononuclear cells (PBMCs) of HAM/ TSP patients, which suggests that TIGIT and PD-1 are targets of treatment for HTLV-1 associ-ated diseases.
It has been reported that TIGIT plays critical roles to control viral infection [19]. In mice infected with lymphocytic choriomeningitis virus (LCMV), both TIGIT and PD-1 expressions were upregulated on CD4+and CD8+T cells. Viral loads were reduced and cytokine produc-tions were increased in LCMV infected mice in which CD4+T cells lack TIGIT expression. Furthermore, blockade of PD-1/PD-L1 and TIGIT by the antibodies synergistically enhanced viral clearance and CD8+T cell effector functions. These data clearly indicates that TIGIT on T cells is implicated in anti-viral immunity. PD-1 and TIGIT of tumor infiltrating CD8+T cells or exhausted CD8+T cells in chronic infection have been extensively studied [19,31]. Recently, it has been reported that melanoma cell intrinsic PD-1 promotes tumor growth [32]. In consis-tent with this report, this study also suggests that HBZ-induced TIGIT on ATL cells and infected cells is involved in pathogenesis of HTLV-1 infection. Thus, TIGIT on both infected cells and CD8+effector T cells is implicated in evasion of the host defense.
As shown in this study, ATL cells and HTLV-1 infected cells express not only TIGIT but also PD-1 on their surfaces. HBZ can induce expression of both molecules. It has been reported that reverse signaling via PD-L1 and PD-L2 into DCs reduces DC maturation [33]. Further-more, the binding of TIGIT to CD155 modulated cytokine production from monocyte-derived DCs by reverse signaling [16]. Similarly, the reverse signaling is a possible mechanism to increase IL-10 production and suppress IL-12p40 in stimulated DCs derived from HBZ-Tg mice. Recently, it has been reported that a combination of anti-PD-1 and anti-TIGIT antibod-ies remarkably restored the function of tumor antigen-specific CD8+T cells, illustrating the sig-nificance of PD-1 and TIGIT on CD8+T cells and the interactions of these receptors with their ligands on APCs and cancer cells [31]. The presence of anti-PD-1 and/or anti-TIGIT antibod-ies enhanced anti-Tax T-cell activity in this study, suggesting that these antibodantibod-ies are clinically efficacious for the treatment of ATL patients.
Host immune responses play pivotal roles in controlling viruses. Accordingly, viruses acquire ways of counteracting host immune responses. For example, HCV NS3/4A cleaves IFN-βpromoter stimulator-1, which blocks signaling via RIG-I/MDA5 [34]. Thus, HCV sup-presses interferon production to escape innate immunity. Another example is that herpes viruses disturb antigen presentation by blocking the function of transporter associated with antigen processing (TAP) [35]. Likewise, HTLV-1 also has strategies for counteracting host immune surveillance. HTLV-1 p12 binds to human major histocompatibility complex class I (MHC-I) heavy chains, thereby decreasing MHC-I levels on infected cells [36]. This study sug-gests that TIGIT on HTLV-1 infected cells modulate the microenvironment, through increased production of IL-10, to suppress immune responses against viral antigens. Thus, HTLV-1 has evolved an elaborate strategy to evade the host immune system.
EBV and CMV [38]. IL-10 and viral IL-10 diminish expression of MHC class II molecules on the monocytes, leading to impaired antigen-presenting capacity [39]. In HIV-1 infection, inflammatory cytokines enhance PD-1 expression on monocytes. Triggering of PD-1 by PD-L1 induces IL-10 production of monocytes, which dampen CD4+T cell activation [40]. Thus, IL-10 is a key cytokine for controlling immune responses, and several viruses take advan-tage of this fact. The TIGIT-mediated upregulation of IL-10 production reported here is a novel mechanism for the survival of virus-infected cells.
HAM/TSP is an inflammatory disease of the central nervous system [41]. The immunosup-pressive activity of HTLV-1-infected T cells as shown in this study might not coincide with this finding. Viral proteins of HTLV-1, HBZ and Tax, intrinsically induce inflammation. HBZ induces labile Foxp3 expression. Foxp3+CD4+T cells that convert to Foxp3-CD4+T cells pro-duce excess amount of interferon-γ(IFN-γ), which leads to inflammation [42]. On the other hand, it has been reported that Tax increases T box transcription factor (T-bet), which pro-motes IFN-γproduction [43]. Thus, both viral proteins induce inflammation. Although CTLs against Tax are also implicated in the pathogenesis of HAM/TSP, CTLs exclude HTLV-1 infected cells. TIGIT on HTLV-1 infected cells likely suppresses CTLs as shown in this study. Thus, TIGIT protects infected cells, which is supposed to promote onset of inflammatory diseases.
This study also illustrates epigenetic modulation by HBZ using genome-wide analysis. HBZ has been shown to interact with KIX domain of p300 [44]. We previously showed that HBZ interacts with host lysine acetylase, p300, and induces the expression of Foxp3 [10]. The adeno-virus gene E1A is also reported to interact with p300/CBP and modulate the expression of p300-target host genes that inhibit viral replication [45]. Thus, adenovirus uses E1A to modify host histone-modifying enzymes to benefit its replication. In the present study, HBZ is shown to modulate the epigenetic state and induce the expression of several Treg related or inhibitory signal related genes, includingFoxp3,TIGIT, andCCR4genes [25,46]. It is assumed that HBZ generates a tumor- and virus- favorable microenvironment by modulating the transcription of cellular genes. The precise mechanism by which HBZ modulates epigenetic status of cellular genes remains to be studied.
In this study, we demonstrate that HBZ induced TIGIT expression likely impairs T-cell response to viral antigens through enhanced IL-10 production by T cells and DCs. This study suggests a new therapeutic strategy for ATL patients: the co-blockade of TIGIT and PD-1 to restore anti-tumor and anti-virus immune responses.
Materials and Methods
Animals and subjects
C57BL/6J mice were purchased from CLEA Japan. Transgenic mice expressing theHBZgene in CD4+T cells (HBZ-Tg) were described previously [23]. All mice (6–14 weeks of age) used in this study were maintained in an SPF facility. PBMCs of the patients with ATL or HAM/TSP and healthy donors were collected by Ficoll-Paque PLUS (GE Healthcare). Jurkat cell is a HTLV-1 negative human T-cell line, and MT-2 and 43T(-) cells are HTLV-1 positive human T-cell lines.
Ethics statement
D15-02). Experiments using clinical samples were conducted according to the principles expressed in the Declaration of Helsinki, and approved by the Institutional Review Board of Kyoto University (Permit numbers are G310 and G204). ATL and HAM/TSP patients pro-vided written informed consent for the collection of samples and subsequent analysis.
Plasmids
Expression vectors for HBZ (wild-type and mutants) and C/EBPαwere described previously [29,47]. FLAG-HBZ was generated by inserting dimerized 3xFLAG oligos into the C-terminus of HBZ expressing retrovirus vector [5]. The promoter regions ofTIGITandFGL2were ampli-fied from human genomic DNA by PCR using the primer sets described inS6 Tableand cloned into pGL4.22 (Promega). The wild-type HBZ, HBZ RNA (TTG) and HBZ protein (SM) expressing vectors, and pCG-Tax were described [23].
Retroviral transduction and RNA extraction
CD4+cells were enriched by a CD4 enrichment kit (BD Pharmingen) and were activated by 0.5μg/ml anti-CD3 Ab and 50 U/ml rIL-2 in the presence of T-cell-depleted and x-irradiated
(20Gy) C57BL/6J splenocytes as APCs in 12 well plates. After 16 hours, activated T cells were transduced with viral supernatant and 4μg/ml polybrene, and centrifuged at 3,000 rpm for 60
min. Cells were cultured in medium supplemented with 50 U/ml rIL-2 [5]. Two days after transduction, GFP expressing cells were sorted by FACS AriaII (BD). RNA was extracted using Trizol Reagent (Invitrogen).
ChIP
Cells were transduced and sorted as described above, then crosslinked in 1% (0.5% forFig 1C) formaldehyde solution and incubated for 10 min at room temperature. The remaining proce-dures were performed essentially as described [48] or using the SimpleChIP Enzymatic Chro-matin IP Kit (Cell Signaling Technology) according to the manufacturer’s protocol.
RNA-seq and ChIP-seq
We prepared RNA-seq libraries from the RNA described above and ChIP-seq libraries from chromatin-immunoprecipitated or input DNA samples, and we performed sequencing using the HiSeq2500 (Illumina) according to the manufacturer’s protocol. For HBZ-FLAG ChIP-seq analysis, library preparation and high-throughput sequencing were performed at BGI (Shen-zhen, China) using the Hiseq2000 (Illumina).
Mapping and analysis of RNA-seq and ChIP-seq
The obtained RNA-seq and ChIP-seq data were mapped to the murine reference genome using Bowtie [49]. For RNA-seq, differently expressing genes were analyzed using Cuffdiff and vali-dated by realtime PCR using the primer sets described inS6 Table. Peaks of ChIP-seq tags were called by MACS1.4. Peaks located -2 kb to +0.5 kb of TSS were analyzed as peaks around TSS. RNA-seq and ChIP-seq files were visualized using the Integrative Genomics Viewer [50–52].
Luciferase assay
were measured using the Dual Luciferase Reporter Assay Kit (Promega). Relative luciferase activities of Firefly to Renilla were then calculated. For PMA /ionomycin stimulation, cells were stimulated for 4 hours before being harvested. To compare the expression levels of HBZ mutants, transcripts in SRαregion were quantified by realtime PCR.
Flow cytometry
Human PBMCs and murine splenocytes were stained with the antibodies indicated according to the manufacturer’s protocol and analyzed using FACS Verse with Suite software (BD). Data was analyzed by FlowJo software (Treestar).
Antibodies
ChIP-seq for histone modifications was performed using the following antibodies: anti-H3ac (06–599, Millipore) [53], anti-H3K9ac (07–352, Millipore) [54], and anti-H3K27ac (ab4729, Abcam) antibodies [48]. Anti-H3K18ac (39755, Active Motif) does not react to acetyl-Lys4, unmodified Lys4, unmodified Lys18, acetyl-Lys9, acetyl-Lys14, and acetyl-Lys23 peptides, but it reacts to two kinds of acetyl-Lys18 peptides (http://www.activemotif.com/catalog/details/
39755/histone-h3-acetyl-lys18-antibody-pab-3). Anti-FLAG (M2) was purchased from Sigma.
Normal rabbit and mouse IgG (Santa Cruz Biotechnology) were used as a control. For flow cytometric analysis of murine samples, PE/Cy7 anti-CD3 (145-2C11), PerCP-Cy5.5 anti-CD4 (RM4-5), APC/Cy7 or FITC anti-CD8a (53–6.7), APC anti-TIGIT (1G9) and PE CD226 (10E5) antibodies were purchased from BioLegend; PE anti-CD45R/B220 (RA3-6B2), FITC anti-CD11c (HL3), PE anti-PD-1 (J43), PE anti-IFN-γ
(#554412) and PE anti-PD-1 (#551892) antibodies were purchased from BD Bioscience; and eFluor450 anti-Foxp3 (FJK-16s), PE anti-IL-10 (JES5-16E3), Biotin anti-CD90.1 (HIS51) and PE anti-Blimp1 antibodies were purchased from eBioscience. For flow cytometric analysis of human samples, PerCP-Cy5.5 anti-CD4 (OKT4) was purchased from eBioscience, and APC anti-TIGIT (741182) antibodies was purchased from R&D systems. Brilliant Violet421 anti-IL-10 and FITC-labeled goat anti-mouse IgG were purchased from BioLegend. Anti-HTLV I gp46 (67/5.5.13.1) was purchased from Abcam. Biotin conjugated anti-CADM1 (3E1) antibody was generated as described [55]. PE and PE/Cy7 streptavidin were purchased from BD Bioscience. The Near-IR LIVE/DEAD Fixable Dead Cell Stain Kit was purchased from Invitrogen. APC labeled mouse IgG and PE labeled rat IgG were purchased from eBioscience. Brilliant Violet 421 labeled rat IgG was purchased from BioLegend. Mouse IgG (MOPC-21) was purchased from Sigma for isotype controls. For functional analysis of patient samples, TIGIT anti-body (MBSA43) was purchased from eBioscience. Anti-PD-1 antianti-body (EH12.2H7) and mouse IgG1 isotype control (MOPC-21) were purchased from BioLegend.
ELISA
CD4+T cells from non-Tg and HBZ-Tg mice were enriched by CD4 magnetic particles (BD) and then seeded into a 96-well plate at 1 or 2x10⁵cells and cultured for the indicated time. Supernatants from cultured cells were centrifuged to remove debris and IL-10 was then mea-sured using QuantikineELISA from R&D systems according to the manufacturer’s protocol.
ELISPOT assay
Recombinant mouse TIGIT-Fc and mouse lgG2A-Fc (R&D) were coupled to Dynabeads M-450 (Invitrogen) according to the manufacturer’s protocol. Cells were stimulated with Tax pep-tides along with the Fc-conjugated beads or blocking antibodies as indicated.
Cytometric bead array
Splenocytes from non-Tg and HBZ-Tg mice were stimulated with LPS overnight, followed by sorting of dendritic cells using FACS AriaII (BD). Sorted cells were seeded into a 96-well plate at 1 x 10⁶/ml and cultured in the presence of LPS for 24 hours. Supernatants were centrifuged to remove debris and IL-10 was then measured using IL-10 Enhanced Sensitivity Flex Set from BD according to the manufacturer’s protocol.
HTLV-1 infection to primary CD4
+T cells
Human CD4+cells were collected using Human CD4 T Lymphocyte Enrichment Set (BD) and then stimulated with PHA (3μg/ml) in the presence of IL-2 (150 U/ml) for 3 days, followed by
co-cultured with irradiated MT-2 for 3 days. Infected primary CD4+T cells were detected by anti-HTLV-1 gp46 (Env) followed by FITC-labeled anti-mouse IgG.
Knockdown of HBZ
ATL- 43T(-) cells were transfected with short interfering RNA (siRNA) twice at 0 and 48 hours using Lipofectamin2000 as described [57]. Over 90% cells were successfully transfected and they were harvested at 72 hours for RNA extraction.
Statistical analysis
The Mann-Whitney test using GraphPad Prism software or the Student’s t test was used to determine significance where appropriate. All statistical analyses are shown as
P<0.05 and P<0.01.
Data access
All raw sequence data were deposited in the DNA Data Bank of Japan (DDBJ) under the acces-sion number DRA003229 and DRA003744.
Supporting Information
S1 Fig. HTLV-1 newly infected cells expressed higher level of TIGIT.Human primary CD4+ T cells were stimulated with PHA (3μg/ml) for 3 days and then co-cultured with irradiated
HTLV-1 infected cell line MT-2 for 3 days. Expression of TIGIT was analyzed by FCM in HTLV-1 infected Env+CD4+T cells.
(PPTX)
S2 Fig. Expression of TIGIT was suppressed by HBZ knockdown.HBZ was knock-down by siRNA in an ATL cell line, 43T(-). Expression levels of TIGIT were analyzed by realtime PCR. Results shown are the mean ± SD in triplicate.P<0.05.
(PPTX)
S3 Fig. Transcriptional level of wt HBZ and mutant HBZ.Expression levels of HBZ-deletion mutants in luciferase assays (Fig 3B, 3C and 3D) were analyzed by realtime PCR using primers for the common sequence of all plasmids at SRαregion (A forFig 3B, B forFig 3Cand C for
luciferase assays. Results shown are the mean ± SD in triplicate. (PPTX)
S4 Fig. Blimp1 protein expressed higher level in CD4+T cells of HBZ-Tg than those of non-Tg.Flow cytometry analysis of Blimp1 on CD4+T cells from non-Tg and HBZ-Tg mouse. Splenocytes were stimulated with plate-coated anti-CD3 (1μg/ml) and soluble anti-CD28
(1μg/ml).
(PPTX)
S5 Fig. IL-10 production of HTLV-1 infected cells in HAM/TSP patients.PBMCs from HAM/TSP patients (n = 5) and healthy donors (n = 3) were stimulated with PMA/ionomycin for 4 hours in the presence of brefeldin A. Expression of IL-10 were analyzed by FCM levels. IL-10 MFI of stained with anti-IL10 and isotype control were shown in the upper right. (PPTX)
S6 Fig. Transcriptional levels ofTIGIT,Fgl2,Blimp1 and Il10genes in ATL cases. Expres-sion levels ofTIGIT,Fgl2,Blimp1andIL-10were analyzed by realtime PCR in PBMCs from ATL patients (n = 10–13) and in CD4+T cells from HD (n = 4).
(PPTX)
S7 Fig. Expression of C/EBPαin the presence of HBZ.Expression level of C/EBPαin
lucifer-ase assays (Fig 5C) were analyzed by realtime PCR. RNA was extracted from simultaneously transfected cells with luciferase assays. Results shown are the mean ± SD in triplicate. The rep-resentative result was shown for two independent experiments.
(PPTX)
S8 Fig. CD226 expression in mice and human.Expression levels ofCd226were analyzed by realtime PCR in CD4+T cells from non-Tg (n = 4), TIGIT+CD4+and TIGIT-CD4+T cells from HBZ-Tg (n = 3). Expression levels ofCD226were analyzed by realtime PCR in CD4+T cells from HD (n = 4) and ATL patients (n = 10).
(PPTX)
S9 Fig. PD-1 expression on CD4+T cells of HBZ-Tg mice.Expression levels of PD-1 were analyzed by FCM in CD4+T cells from non-Tg (n = 4) and HBZ-Tg (n = 4) mice. Representa-tive histograms were shown.P<0.05.
(PPTX)
S1 Table. Genes upregulated by HBZ (Log2fold>2.9).
(DOCX)
S2 Table. Genes downregulated by HBZ (Log2fold<-2.5).
(DOCX)
S3 Table. Reads and peaks of ChIP-seq analyses using HBZ transduced primary mouse T cells.
(DOCX)
S4 Table. Enriched gene promoters by HBZ-Flag-ChIP-seq.
(DOCX)
S5 Table. Percentages of TIGIT and/or PD-1 positivity in CD8+T cells of HAM/TSP cases.
The numbers indicate the percentage of CD8+T cells. The mean percentages (± SD) from 4 donors are shown for healthy donor (HD).
S6 Table. Primers used in this study.
(DOCX)
Acknowledgments
We thank H. Nishikawa and S. Sakaguchi for help in generating the recombinant Tax peptides, K. Imamura, T. Horiuchi, and M. Tosaka for technical support in sequencing, and Linda Kingsbury for proofreading.
Author Contributions
Conceived and designed the experiments: KY JiY MM. Performed the experiments: KY JiY KS YM YS. Analyzed the data: KY KT JiY MM. Contributed reagents/materials/analysis tools: KS NT MN. Wrote the paper: KY JiY MM.
References
1. Mesri EA, Feitelson MA, Munger K. Human viral oncogenesis: a cancer hallmarks analysis. Cell Host Microbe. 2014; 15(3):266–82. doi:10.1016/j.chom.2014.02.011PMID:24629334; PubMed Central PMCID: PMC3992243.
2. Matsuoka M, Jeang KT. Human T-cell leukaemia virus type 1 (HTLV-1) infectivity and cellular transfor-mation. Nature reviews. 2007; 7(4):270–80. PMID:17384582.
3. Bangham CR, Cook LB, Melamed A. HTLV-1 clonality in adult T-cell leukaemia and non-malignant HTLV-1 infection. Seminars in cancer biology. 2014; 26:89–98. doi:10.1016/j.semcancer.2013.11.003 PMID:24316494; PubMed Central PMCID: PMC4062949.
4. Matsuoka M, Green PL. The HBZ gene, a key player in HTLV-1 pathogenesis. Retrovirology. 2009; 6:71. Epub 2009/08/05. doi: 1742-4690-6-71 [pii] doi:10.1186/1742-4690-6-71PMID:19650892; PubMed Central PMCID: PMC2731725.
5. Satou Y, Yasunaga J, Zhao T, Yoshida M, Miyazato P, Takai K, et al. HTLV-1 bZIP Factor Induces T-Cell Lymphoma and Systemic Inflammation In Vivo. PLoS Pathog. 2011; 7(2):e1001274. Epub 2011/ 02/25. doi:10.1371/journal.ppat.1001274PMID:21347344.
6. Philip S, Zahoor MA, Zhi H, Ho YK, Giam CZ. Regulation of human T-lymphotropic virus type I latency and reactivation by HBZ and Rex. PLoS Pathog. 2014; 10(4):e1004040. doi:10.1371/journal.ppat. 1004040PMID:24699669; PubMed Central PMCID: PMC3974842.
7. Yamano Y, Araya N, Sato T, Utsunomiya A, Azakami K, Hasegawa D, et al. Abnormally high levels of virus-infected IFN-gamma+ CCR4+ CD4+ CD25+ T cells in a retrovirus-associated neuroinflammatory disorder. PLoS One. 2009; 4(8):e6517. doi:10.1371/journal.pone.0006517PMID:19654865; PubMed Central PMCID: PMC2715877.
8. Nakahata S, Saito Y, Marutsuka K, Hidaka T, Maeda K, Hatakeyama K, et al. Clinical significance of CADM1/TSLC1/IgSF4 expression in adult T-cell leukemia/lymphoma. Leukemia. 2012; 26(6):1238–46. doi:10.1038/leu.2011.379PMID:22289924.
9. Satou Y, Utsunomiya A, Tanabe J, Nakagawa M, Nosaka K, Matsuoka M. HTLV-1 modulates the fre-quency and phenotype of FoxP3+CD4+ T cells in virus-infected individuals. Retrovirology. 2012; 9 (1):46. Epub 2012/06/01. doi:10.1186/1742-4690-9-46PMID:22647666.
10. Zhao T, Satou Y, Sugata K, Miyazato P, Green PL, Imamura T, et al. HTLV-1 bZIP factor enhances TGF-{beta} signaling through p300 coactivator. Blood. 2011; 118(7):1865–76. Epub 2011/06/28. doi: 10.1182/blood-2010-12-326199PMID:21705495.
11. Schneider H, Downey J, Smith A, Zinselmeyer BH, Rush C, Brewer JM, et al. Reversal of the TCR stop signal by CTLA-4. Science. 2006; 313(5795):1972–5. doi:10.1126/science.1131078PMID:16931720. 12. Chen L, Flies DB. Molecular mechanisms of T cell co-stimulation and co-inhibition. Nat Rev Immunol.
2013; 13(4):227–42. doi:10.1038/nri3405PMID:23470321; PubMed Central PMCID: PMC3786574. 13. Topalian SL, Hodi FS, Brahmer JR, Gettinger SN, Smith DC, McDermott DF, et al. Safety, activity, and
immune correlates of anti-PD-1 antibody in cancer. N Engl J Med. 2012; 366(26):2443–54. doi:10. 1056/NEJMoa1200690PMID:22658127; PubMed Central PMCID: PMC3544539.
15. Topalian SL, Drake CG, Pardoll DM. Immune Checkpoint Blockade: A Common Denominator Approach to Cancer Therapy. Cancer Cell. 2015; 27(4):450–61. doi:10.1016/j.ccell.2015.03.001 PMID:25858804; PubMed Central PMCID: PMC4400238.
16. Yu X, Harden K, Gonzalez LC, Francesco M, Chiang E, Irving B, et al. The surface protein TIGIT sup-presses T cell activation by promoting the generation of mature immunoregulatory dendritic cells. Nat Immunol. 2009; 10(1):48–57. doi:10.1038/ni.1674PMID:19011627.
17. Joller N, Hafler JP, Brynedal B, Kassam N, Spoerl S, Levin SD, et al. Cutting edge: TIGIT has T cell-intrinsic inhibitory functions. Journal of immunology. 2011; 186(3):1338–42. doi:10.4049/jimmunol. 1003081PMID:21199897; PubMed Central PMCID: PMC3128994.
18. Levin SD, Taft DW, Brandt CS, Bucher C, Howard ED, Chadwick EM, et al. Vstm3 is a member of the CD28 family and an important modulator of T-cell function. Eur J Immunol. 2011; 41(4):902–15. doi:10. 1002/eji.201041136PMID:21416464; PubMed Central PMCID: PMC3733993.
19. Johnston RJ, Comps-Agrar L, Hackney J, Yu X, Huseni M, Yang Y, et al. The immunoreceptor TIGIT regulates antitumor and antiviral CD8(+) T cell effector function. Cancer Cell. 2014; 26(6):923–37. doi: 10.1016/j.ccell.2014.10.018PMID:25465800.
20. Kobayashi S, Nakano K, Watanabe E, Ishigaki T, Ohno N, Yuji K, et al. CADM1 expression and step-wise downregulation of CD7 are closely associated with clonal expansion of HTLV-I-infected cells in adult T-cell leukemia/lymphoma. Clin Cancer Res. 2014; 20(11):2851–61. doi:10.1158/1078-0432. CCR-13-3169PMID:24727323.
21. Matsuoka M, Hattori T, Chosa T, Tsuda H, Kuwata S, Yoshida M, et al. T3 surface molecules on adult T cell leukemia cells are modulated in vivo. Blood. 1986; 67(4):1070–6. PMID:2869803.
22. Zhang Y, Maksimovic J, Naselli G, Qian J, Chopin M, Blewitt ME, et al. Genome-wide DNA methylation analysis identifies hypomethylated genes regulated by FOXP3 in human regulatory T cells. Blood. 2013; 122(16):2823–36. doi:10.1182/blood-2013-02-481788PMID:23974203; PubMed Central PMCID: PMC3798997.
23. Satou Y, Yasunaga J, Yoshida M, Matsuoka M. HTLV-I basic leucine zipper factor gene mRNA sup-ports proliferation of adult T cell leukemia cells. Proc Natl Acad Sci U S A. 2006; 103(3):720–5. PMID: 16407133.
24. Mitobe Y, Yasunaga J, Furuta R, Matsuoka M. HTLV-1 bZIP Factor RNA and Protein Impart Distinct Functions on T-cell Proliferation and Survival. Cancer Res. 2015; 75(19):4143–52. doi: 10.1158/0008-5472.CAN-15-0942PMID:26383166.
25. Joller N, Lozano E, Burkett PR, Patel B, Xiao S, Zhu C, et al. Treg cells expressing the coinhibitory mol-ecule TIGIT selectively inhibit proinflammatory Th1 and Th17 cell responses. Immunity. 2014; 40 (4):569–81. doi:10.1016/j.immuni.2014.02.012PMID:24745333; PubMed Central PMCID: PMC4070748.
26. Cretney E, Xin A, Shi W, Minnich M, Masson F, Miasari M, et al. The transcription factors Blimp-1 and IRF4 jointly control the differentiation and function of effector regulatory T cells. Nat Immunol. 2011; 12 (4):304–11. doi:10.1038/ni.2006PMID:21378976.
27. Lozano E, Dominguez-Villar M, Kuchroo V, Hafler DA. The TIGIT/CD226 axis regulates human T cell function. Journal of immunology. 2012; 188(8):3869–75. doi:10.4049/jimmunol.1103627PMID: 22427644; PubMed Central PMCID: PMC3324669.
28. Kim R, Emi M, Tanabe K, Arihiro K. Tumor-driven evolution of immunosuppressive networks during malignant progression. Cancer Res. 2006; 66(11):5527–36. doi:10.1158/0008-5472.CAN-05-4128 PMID:16740684.
29. Zhao T, Coutts A, Xu L, Yu J, Ohshima K, Matsuoka M. HTLV-1 bZIP factor supports proliferation of adult T cell leukemia cells through suppression of C/EBPalpha signaling. Retrovirology. 2013; 10:159. doi:10.1186/1742-4690-10-159PMID:24359396; PubMed Central PMCID: PMC3880043.
30. Kozako T, Yoshimitsu M, Fujiwara H, Masamoto I, Horai S, White Y, et al. PD-1/PD-L1 expression in human T-cell leukemia virus type 1 carriers and adult T-cell leukemia/lymphoma patients. Leukemia. 2009; 23(2):375–82. doi:10.1038/leu.2008.272PMID:18830259.
31. Chauvin JM, Pagliano O, Fourcade J, Sun Z, Wang H, Sander C, et al. TIGIT and PD-1 impair tumor antigen-specific CD8+ T cells in melanoma patients. J Clin Invest. 2015; 125(5):2046–58. doi:10.1172/ JCI80445PMID:25866972.
32. Kleffel S, Posch C, Barthel SR, Mueller H, Schlapbach C, Guenova E, et al. Melanoma Cell-Intrinsic PD-1 Receptor Functions Promote Tumor Growth. Cell. 2015; 162(6):1242–56. doi:10.1016/j.cell. 2015.08.052PMID:26359984.
34. Foy E, Li K, Sumpter R Jr., Loo YM, Johnson CL, Wang C, et al. Control of antiviral defenses through hepatitis C virus disruption of retinoic acid-inducible gene-I signaling. Proc Natl Acad Sci U S A. 2005; 102(8):2986–91. doi:10.1073/pnas.0408707102PMID:15710892; PubMed Central PMCID: PMC549461.
35. Verweij MC, Horst D, Griffin BD, Luteijn RD, Davison AJ, Ressing ME, et al. Viral inhibition of the trans-porter associated with antigen processing (TAP): a striking example of functional convergent evolution. PLoS Pathog. 2015; 11(4):e1004743. doi:10.1371/journal.ppat.1004743PMID:25880312; PubMed Central PMCID: PMC4399834.
36. Johnson JM, Nicot C, Fullen J, Ciminale V, Casareto L, Mulloy JC, et al. Free major histocompatibility complex class I heavy chain is preferentially targeted for degradation by human T-cell leukemia/lym-photropic virus type 1 p12(I) protein. J Virol. 2001; 75(13):6086–94. Epub 2001/06/08. doi:10.1128/ JVI.75.13.6086–6094.2001PMID:11390610; PubMed Central PMCID: PMC114324.
37. Qin Z, Kearney P, Plaisance K, Parsons CH. Pivotal advance: Kaposi's sarcoma-associated herpesvi-rus (KSHV)-encoded microRNA specifically induce IL-6 and IL-10 secretion by macrophages and monocytes. J Leukoc Biol. 2010; 87(1):25–34. PMID:20052801; PubMed Central PMCID: PMC2801620.
38. Slobedman B, Barry PA, Spencer JV, Avdic S, Abendroth A. Virus-encoded homologs of cellular inter-leukin-10 and their control of host immune function. J Virol. 2009; 83(19):9618–29. doi:10.1128/JVI. 01098-09PMID:19640997; PubMed Central PMCID: PMC2747999.
39. de Waal Malefyt R, Haanen J, Spits H, Roncarolo MG, te Velde A, Figdor C, et al. Interleukin 10 (IL-10) and viral IL-10 strongly reduce specific human T cell proliferation by diminishing the antigen-presenting capacity of monocytes via downregulation of class II major histocompatibility complex expression. J Exp Med. 1991; 174(4):915–24. PMID:1655948; PubMed Central PMCID: PMC2118975.
40. Said EA, Dupuy FP, Trautmann L, Zhang Y, Shi Y, El-Far M, et al. Programmed death-1-induced inter-leukin-10 production by monocytes impairs CD4+ T cell activation during HIV infection. Nat Med. 2010; 16(4):452–9. doi:10.1038/nm.2106PMID:20208540; PubMed Central PMCID: PMC4229134. 41. Takenouchi N, Yao K, Jacobson S. Immunopathogensis of HTLV-I associated neurologic disease:
molecular, histopathologic, and immunologic approaches. Front Biosci. 2004; 9:2527–39. PMID: 15353305.
42. Yamamoto-Taguchi N, Satou Y, Miyazato P, Ohshima K, Nakagawa M, Katagiri K, et al. HTLV-1 bZIP factor induces inflammation through labile Foxp3 expression. PLoS Pathog. 2013; 9(9):e1003630. doi: 10.1371/journal.ppat.1003630PMID:24068936; PubMed Central PMCID: PMC3777874.
43. Araya N, Sato T, Ando H, Tomaru U, Yoshida M, Coler-Reilly A, et al. HTLV-1 induces a Th1-like state in CD4+CCR4+ T cells. J Clin Invest. 2014; 124(8):3431–42. doi:10.1172/JCI75250PMID:24960164; PubMed Central PMCID: PMC4109535.
44. Clerc I, Polakowski N, Andre-Arpin C, Cook P, Barbeau B, Mesnard JM, et al. An interaction between the human T cell leukemia virus type 1 basic leucine zipper factor (HBZ) and the KIX domain of p300/ CBP contributes to the down-regulation of tax-dependent viral transcription by HBZ. J Biol Chem. 2008; 283(35):23903–13. Epub 2008/07/05. doi: M803116200 [pii] doi:10.1074/jbc.M803116200PMID: 18599479.
45. Ferrari R, Gou D, Jawdekar G, Johnson SA, Nava M, Su T, et al. Adenovirus small E1A employs the lysine acetylases p300/CBP and tumor suppressor Rb to repress select host genes and promote pro-ductive virus infection. Cell Host Microbe. 2014; 16(5):663–76. doi:10.1016/j.chom.2014.10.004PMID: 25525796; PubMed Central PMCID: PMC4418520.
46. Feuerer M, Hill JA, Kretschmer K, von Boehmer H, Mathis D, Benoist C. Genomic definition of multiple ex vivo regulatory T cell subphenotypes. Proc Natl Acad Sci U S A. 2010; 107(13):5919–24. doi:10. 1073/pnas.1002006107PMID:20231436; PubMed Central PMCID: PMC2851866.
47. Zhao T, Yasunaga J, Satou Y, Nakao M, Takahashi M, Fujii M, et al. Human T-cell leukemia virus type 1 bZIP factor selectively suppresses the classical pathway of NF-kappaB. Blood. 2009; 113(12):2755– 64. PMID:19064727. doi:10.1182/blood-2008-06-161729
48. Suzuki A, Makinoshima H, Wakaguri H, Esumi H, Sugano S, Kohno T, et al. Aberrant transcriptional regulations in cancers: genome, transcriptome and epigenome analysis of lung adenocarcinoma cell lines. Nucleic Acids Res. 2014; 42(22):13557–72. doi:10.1093/nar/gku885PMID:25378332; PubMed Central PMCID: PMC4267666.
50. Robinson JT, Thorvaldsdottir H, Winckler W, Guttman M, Lander ES, Getz G, et al. Integrative geno-mics viewer. Nat Biotechnol. 2011; 29(1):24–6. doi:10.1038/nbt.1754PMID:21221095; PubMed Cen-tral PMCID: PMC3346182.
51. Trapnell C, Roberts A, Goff L, Pertea G, Kim D, Kelley DR, et al. Differential gene and transcript expres-sion analysis of RNA-seq experiments with TopHat and Cufflinks. Nat Protoc. 2012; 7(3):562–78. doi: 10.1038/nprot.2012.016PMID:22383036; PubMed Central PMCID: PMC3334321.
52. Thorvaldsdottir H, Robinson JT, Mesirov JP. Integrative Genomics Viewer (IGV): high-performance genomics data visualization and exploration. Brief Bioinform. 2013; 14(2):178–92. doi:10.1093/bib/ bbs017PMID:22517427; PubMed Central PMCID: PMC3603213.
53. Gomez-del Arco P, Kashiwagi M, Jackson AF, Naito T, Zhang J, Liu F, et al. Alternative promoter usage at the Notch1 locus supports ligand-independent signaling in T cell development and leukemo-genesis. Immunity. 2010; 33(5):685–98. doi:10.1016/j.immuni.2010.11.008PMID:21093322; PubMed Central PMCID: PMCPMC3072037.
54. Papait R, Cattaneo P, Kunderfranco P, Greco C, Carullo P, Guffanti A, et al. Genome-wide analysis of histone marks identifying an epigenetic signature of promoters and enhancers underlying cardiac hypertrophy. Proc Natl Acad Sci U S A. 2013; 110(50):20164–9. doi:10.1073/pnas.1315155110PMID: 24284169; PubMed Central PMCID: PMCPMC3864351.
55. Kobayashi S, Watanabe E, Ishigaki T, Ohno N, Yuji K, Nakano K, et al. Advanced human T-cell leuke-mia virus type 1 carriers and early-stage indolent adult T-cell leukeleuke-mia-lymphoma are indistinguishable based on CADM1 positivity in flow cytometry. Cancer Sci. 2015; 106(5):598–603. doi:10.1111/cas. 12639PMID:25703103.
56. Sugata K, Yasunaga JI, Mitobe Y, Miura M, Miyazato P, Kohara M, et al. Protective effect of cytotoxic T lymphocytes targeting HTLV-1 bZIP factor. Blood. 2015. doi:10.1182/blood-2015-04-641118PMID: 26063164.