www.ann-geophys.net/24/1311/2006/ © European Geosciences Union 2006
Annales
Geophysicae
F
-region Pedersen conductivity deduced using the TIMED/GUVI
limb retrievals
H. Kil, M. DeMajistre, L. J. Paxton, and Y. Zhang
Applied Physics Laboratory, Johns Hopkins University, 11100 Johns Hopkins Road, Laurel, MD 20723, USA Received: 17 August 2005 – Revised: 22 December 2005 – Accepted: 9 January 2006 – Published: 3 July 2006 Part of Special Issue “The 11th International Symposium on Equatorial Aeronomy (ISEA-11), Taipei, May 2005”
Abstract. As a proxy of the Rayleigh-Taylor instability growth rate for equatorial plasma bubbles, we investigate the flux-tube integratedF-region Pedersen conductivity (6PF) using the electron density profiles (EDPs) provided by the Global Ultraviolet Imager (GUVI) on board the Thermo-sphere IonoThermo-sphere and MesoThermo-sphere Energetics and Dynam-ics (TIMED) satellite. The investigation is conducted using the EDPs obtained in the Atlantic sector at 19:00–22:00 LT during 4–17 August and 6–16 December 2002. The seasonal difference of the strength and location of the equatorial ion-ization anomalies (EIAs) induces a significant difference in the deduced6PF. Much stronger EIAs are created at higher altitudes and latitudes in December rather than in August. At 19:00–20:00 LT, the peak value of the6PF has 23 mhos at 1100 km apex height during 14–16 December and 18 mhos at 600 km during 15–17 August. The6FP decreases as local time progresses. Therefore,6FP provides a preferred condi-tion for the growth of bubbles to higher altitudes at 19:00– 20:00 LT than at later hours, in December rather than in Au-gust in the Atlantic sector.
Keywords. Ionosphere (Equatorial ionosphere; Ionospheric irregularities; General or miscellaneous)
1 Introduction
The equatorial electron density irregularities in theFregion, often called bubbles, are known to be produced by the gravity induced collisional Rayleigh-Taylor (R-T) instability (Kel-ley, 1989). Modulation of the bottomsideFlayer induces a polarization electric field, by which the low-density bottom-side plasma is transported to the topbottom-side and creates irregular-ities. The global distribution of the irregularities shows large seasonal and longitudinal variations. The two competing hy-potheses are that the bubble distribution is controlled by the bottomside seed perturbations (e.g. R¨ottger, 1981; McClure Correspondence to:H. Kil
et al., 1998) and by the growth condition of the instability (e.g. Abdu et al., 1981, 1992; Maruyama and Matuura, 1984; Tsunoda, 1985; Mendillo et al., 1992; Kil et al., 2004a). The growth rate of the instability depends on various factors in theEandFregions and also in the thermosphere. The stud-ies related to the growth rate can be categorized into the E-region conditions (Abdu et al., 1981, 1992; Tsunoda, 1985) and theF-region conditions (Maruyama and Matuura, 1984; Mendillo et al., 1992; Kil et al., 2004a). These hypotheses were established more than two decades ago but they have not yet been validated, owing to a lack of global observation data.
The Global Ultraviolet Imager (GUVI) on board the Ther-mosphere Ionosphere Mesosphere Energetics and Dynamics (TIMED) satellite provides reliable electron density profiles (EDPs) in the altitude range of 200–500 km (Christensen et al., 2003; DeMajistre et al., 2004; Paxton et al., 2004). The equatorial ionization anomaly (EIA) is normally located in this altitude range. GUVI provides global EDPs and, for the first time, enables the investigation of the global bubble growth conditions. Kil et al. (2004a) reported close similari-ties in the global bubble distribution and theF-region plasma distribution. They postulated the use of theF-region Ped-ersen conductivity (6FP) as a measure of theF-region effect on the growth of the R-T instability. We extend the study of Kil et al. by calculating6PF using the GUVI EDPs. In Sect. 2, we describe the linear growth rate of the R-T insta-bility. In Sect. 3, the GUVI disk and limb scan images of the OI 135.6-nm radiance and the Pedersen conductivities de-duced from the GUVI EDPs are presented. Conclusions are given in Sect. 4.
2 Linear growth rate of the R-T instability
The linear growth rate of the flux-tube integrated R-T insta-bility (Ŵ) (Sultan, 1996) is given by
Ŵ= 6
F P
6PE+6PF V+Un+ g νineff
!
1 Ln
5 50 500 R
-180 -120 -60 0 60 120 180
-30 0 30
Latitude (
o )
August 3-4, 2002
UT:08:3807:0105:2403:4602:0900:3222:5521:1719:4018:0316:2614:4913:1111:3409:57
-180 -120 -60 0 60 120 180
-30 0 30
Latitude (
o )
December 6-7, 2002
UT: 06:5605:1903:4202:0500:2722:5021:1319:36 17:5916:2214:4413:0711:3009:53
-180 -120 -60 0 60 120 180
Longitude (o)
-30 0 30
Latitude (
o )
September 29-30, 2002
UT: 08:5107:1405:3703:5902:2200:45 23:0821:3119:5318:1616:3915:0213:2511:4710:10
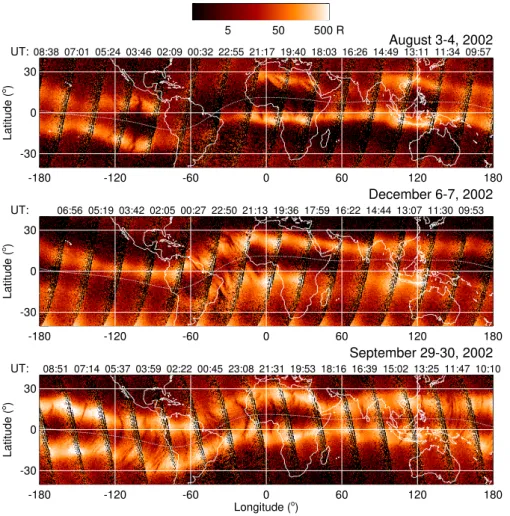
Fig. 1.Composite OI 135.6-nm radiance maps at 21:00 LT on 3–4 August (top), 6–7 December (middle), and 29–30 September (bottom) in 2002 . The bright arcs are produced by the EIAs. The dark bands within each swath of GUVI data result from plasma depletions.
Here6PE and6PF are flux-tube integrated E- andF-region Pedersen conductivities;Vis the upward component of the plasma drift velocity,Unis the downward component of the neutral wind velocity,gis gravitational acceleration,νineff is the flux-tube integrated effectiveF-region ion-neutral colli-sional frequency,Lnis the scale-length of the vertical gradi-ent of theF-region flux-tube integrated plasma density, and RT is the flux-tube integrated recombination rate. We do not know yet which parameter plays the dominant role in the growth of the R-T instability. The parameters related to the E-region, such as6PE, are extremely difficult to obtain even in a local region. Our approach is to start the investigation of the growth condition of the R-T instability with the easily observable parameters. As we will discuss below, we have chosen this approach because we have noticed what appears to be a strong correlation between the intensity of the EIA observed by GUVI and the occurrence of ionospheric bub-bles seen as depletions in the GUVI 135.6-nm images. Thus, it would seem reasonable to suggest that if the seasonal and longitudinal variations of6PF/(6PE +6FP)are much larger
than the variations of the quantities in the parenthesis orLn in Eq. (1), we can produce the global map ofŴ, even though we do not know the magnitude of the other parameters. We can proceed with this line of investigation using just6PF if the variation of6PF is much more significant than6PE.
The flux tube integrated Pedersen conductivity6P is de-fined by (Haerendel et al., 1992)
6P =REL
Z
σP(1+3ξ2)dξ. (2)
HereRE is the Earth radius,Lis the radius of the equatorial crossing point of the field line measured in units of Earth radius,σP is the local Pedersen conductivity,ξ=sinϕ, andϕ is the dipole latitude. The local Pedersen conductivityσP is defined by
σP=
ne B
κi
1+κi2− κe
1+κ2 e
!
(3)
Density
103 104 105 106 cm-3 August, 2002
-30 -20 -10 0 10 20 30 250
300 350 400 450 500
Altitude (km)
LT: 19-20
Aug. 15-17
-30 -20 -10 0 10 20 30 250
300 350 400 450 500
Altitude (km)
LT: 20-21
Aug. 9-14
-30 -20 -10 0 10 20 30 Mag. Latitude (o)
250 300 350 400 450 500
Altitude (km)
LT: 21-22
Aug. 4-8
December, 2002
-30 -20 -10 0 10 20 30 250
300 350 400 450 500
LT: 19-20
Dec. 14-16
-30 -20 -10 0 10 20 30 250
300 350 400 450 500
LT: 20-21
Dec. 8-13
-30 -20 -10 0 10 20 30 Mag. Latitude (o)
250 300 350 400 450 500
LT: 21-22
Dec. 6-7
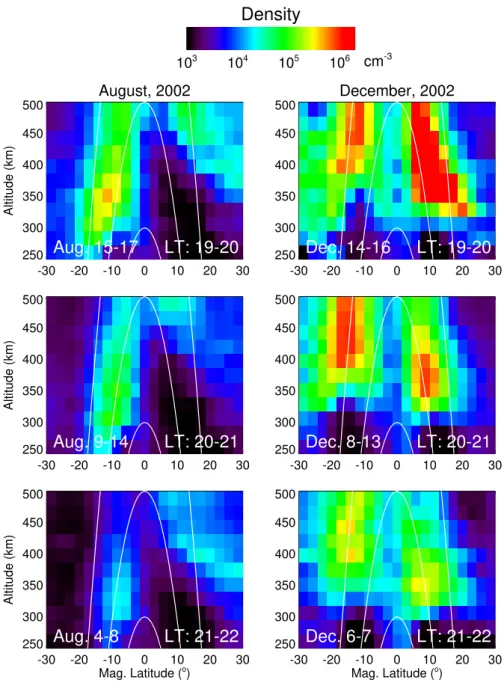
Fig. 2.Average electron density profiles deduced from the GUVI limb retrievals in the Atlantic sector during 4–17 August and 6–16 Decem-ber 2002. The dipole field lines at the apex heights of 300 km, 500 km, and 900 km are shown by white curves.
gyrofrequency to the collision frequency with neutral parti-cles of thej-th species (j/νj n). Herej=qjB/mjwithqj andmj for the charge and mass of thej-th species, respec-tively. Above 130 km, 1≪κi≪κe, andσP can be replaced by σP=nmiνin/B2. Here the ion-neutral collision frequency is given by
νin=(2.6×10⁻⁹)(nn+n)A−1/2, (4)
wherenn is the neutral density per cubic centimeter, and A is the mean molecular weight of the neutrals and ions (Kel-ley, 1989). SinceσP∝n(nn+n), 6PF or, consequently, the growth rate of the R-T instability increases with an increase
0
5
10
15
20
25
30
Pedersen Conductivity (mhos)
400
600
800
1000
1200
1400
Apex height (km)
Aug. 15-17
Dec. 14-16
LT:19-20
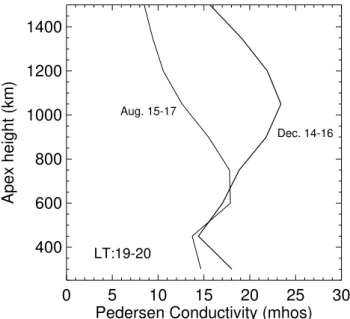
Fig. 3. 6FP at 19:00–20:00 LT in the Atlantic sector during 15– 17 August and 14–16 December 2002.
R-T instability through the influence onV in Eq. (1). The other effect of the uplift of the ionosphere is the increase in F-region plasma density and consequently6PF. The redistri-bution of theF-region plasma by neutral winds also affects 6PF. Therefore,6PF is anF-region parameter that includes the effects of the electric fields and winds.
3 Observations
The occurrence of bubbles in regions of high background plasma density is often observed in the GUVI 135.6-nm images. Figure 1 shows the GUVI disk-scan images at 21:00 LT on 3–4 August (top), 6–7 December (middle), and 29–30 September (bottom) in 2002. Each image is the com-posite image of the 14∼15 TIMED orbits of a day. The
lon-gitude and latitude bin size of the 135.6-nm radiance map is 0.5◦×
0.5◦
. Emission of OI 135.6-nm from the nightsideF region is the result of a radiative recombination of O+
ions with electrons and the subsequent decay of the excited states to the ground state. Since O+
is the dominantF-layer con-stituent the OI 135.6-nm radiance is proportional to the line-of-sight integral of the square of theF-region electron density up to the satellite altitude. TheF-region morphology may change day-to-day but some features occur repeatedly at the same longitude. The figure shows the smallest 135.6-nm ra-diance in the Atlantic sector August and the strongest in this sector in December. Large longitudinal variations in 135.6-nm radiance occur in in August and December. In Septem-ber, the EIAs are well developed in both hemispheres and are distinguishable in most longitude regions. The narrow dark bands elongated in the north-south directions are produced
by plasma depletions (e.g. Kelley et al., 2003; Kil et al., 2004b). The maps show the occurrence of the dark bands (plasma depletions) in the regions where the background ra-diance (F-region plasma density) is large. Relatively uniform distribution of the bubbles in September may be associated with the development of strong EIAs in most longitude re-gions. These observations indicate the possible correlation of the bubble occurrence with theF-region plasma distribu-tion.
To investigate the seasonal difference of the growth condi-tion of bubbles we used the EDPs deduced from the GUVI limb retrievals (see DeMajistre et al. (2004) for the descrip-tion of the GUVI limb retrieval). Precession of the TIMED satellite enables GUVI to sample the ionosphere for all local times every 60 days. Figure 2 shows average EDPs within a 1-h local time bin in the longitude range of 290◦
–350◦
E during 4–17 August (left column) and 6–16 December (right column) in 2002. Each EDP at the given local time inter-val is obtained by averaging the EDPs of a few days. The dipole field lines at the apex heights of 300 km, 500 km, and 900 km are shown by white lines. The altitude and latitude bin sizes of the EDPs are 25 km and 3◦
, respectively. The figure shows the presence of hemispheric asymmetries in the location and strength of the EIAs. As was shown in Fig. 1, the plasma density in August is much lower than that in De-cember in the Atlantic sector. This phenomenon is observed consistently at different local times.
August
0
5
10
15
20
25
30
400
600
800
1000
1200
1400
Apex height (km)
LT 19-20
LT 20-21 LT 21-22
December
0
5
10
15
20
25
30
Pedersen Conductivity (mhos)
400
600
800
1000
1200
1400
Apex height (km)
LT 19-20 LT 20-21
LT 21-22
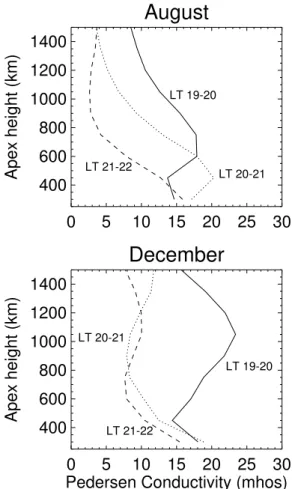
Fig. 4.Temporal evolution of the6PF.
from satellites or using a climatology for the rigorous calcu-lation of the6PF.
We further investigate the local time variations of 6PF. Figure 4 shows the decrease in6PF at later local times. If we consider only the effect of theF region on the growth of the bubbles,then the bubbles would preferentially develop at 19:00–20:00 LT rather than at later local times.We note that6PF at different local times is calculated from data ob-tained on the different days, thus the day-to-day variability of the EIA may have an effect on our results. However, the physically reasonable decrease in6PF at later local times is observed in both seasons, owing to the decrease in plasma density.
4 Conclusions
In an effort to understand the source mechanism of the global bubble distribution, we investigate theF-region effect on the growth of the R-T instability. The investigation is conducted in the Atlantic sector using the EDPs in August and De-cember 2002, provided by the TIMED/GUVI. TheF-region morphology shows a significant seasonal difference. The
stronger EIAs are developed at higher altitudes and latitudes in December than the EIAs in August. As a result, the peak of 6PF occurs at a higher apex height in December than in Au-gust. At 19:00–20:00 LT, the peak value of6PF has 23 mhos at 1100 km apex height during 14–16 December and 18 mhos at 600 km during 15–17 August. Therefore, the F region provides a preferred condition for the growth of bubbles to higher altitudes in December than in August. This study demonstrates the capability of using GUVI data for the calcu-lation of6FP. Our future goal is to create the global maps of 6PF using the GUVI data. The comparison of the global6PF maps with the global maps of the irregularities can be used to verify the importance of theF-region plasma distribution on the growth of bubbles.
Acknowledgements. H. Kil, R. DeMajistre, L. J. Paxton, and Y. Zhang acknowledge support from NASA TIMED program GUVI Grant NAG5-11412.
Topical Editor M. Pinnock thanks J. H. Sobral and another ref-eree for their help in evaluating this paper.
References
Abdu, M. A., Bittencourt, J. A., and Batista, I. S.: Magnetic dec-lination control of the equatorialF-region dynamo electric field development and spreadF, J. Geophys. Res., 86, 11 443–11 446, 1981.
Abdu, M. A., Batista, I. S., and Sobral, J. H. A.: A new aspect of magnetic declination control of equatorial spreadFandF-region dynamo, J. Geophys. Res., 97, 14 897–14 904, 1992.
Christensen, A. B., Paxton, L. J., and Avery, S. et al.: Initial Obser-vations with the Global Ultraviolet Imager (GUVI) in the NASA TIMED Satellite Mission, J. Geophys. Res., 108(A12), 1451, doi:10.1029/2003JA009918, 2003.
DeMajistre, R., Paxton, L. J., Morrison, D., Yee, J.-H., Gon-charenko, L., and Christensen, A.: Retrievals of night-time electron density from TIMED Global Ultraviolet Im-ager (GUVI) measurements, J. Geophys. Res., 109, A05305, doi:10.1029/2003JA010296, 2004.
Haerendel, G., Eccles, J. V., and Cakir, S.: Theory for modeling the equatorial evening ionosphere and the origin of the shear in the horizontal plasma flow, J. Geophys. Res., 97, 1209–1223, 1992. Kelley, M. C.: The Earth’s Ionosphere, Academic Press, San Diego,
California, 1989.
Kil, H. and Heelis, R. A.: Global distribution of density irregulari-ties in the equatorial ionosphere, J. Geophys. Res., 103, 407–417, 1998.
Kil, H., DeMajistre, R., and Paxton, L. J.:F-region plasma distri-bution seen from TIMED/GUVI and its relation to the equa-torial spread F activity, Geophys. Res. Lett., 31, L05810, doi:10.1029/2003GL018703, 2004a.
Kil, H., Su, S.-Y., Paxton, L. J., Wolven, B. C., Zhang, Y., Mor-rison, D., and Yeh, H. C.: Coincident equatorial bubble detec-tion by TIMED/GUVI and ROCSAT-1, Geophys. Res. Lett., 31, L03809, doi:10.1029/2003GL018696, 2004b.
McClure, J. P., Singh, S., Bamgboye, B. K., Johnson, F. S., and Kil, H.: Occurrence of equatorialFregion irregularities: Evidence for tropospheric seeding, J. Geophys. Res., 103, 29 119–29 135, 1998.
Mendillo, M., Baumgardner, J., Pi, X., and Sultan, P. J.: Onset condition for equatorial spreadF, J. Geophys. Res., 97, 13 865– 13 876, 1992.
Paxton, L. J., Christensen, A. B., Morrison, D., Wolven, B., Kil, H., Zhang, Y., Ogorzalek, B. S., Humm, D. C., Goldsten, J., DeMa-jistre, R., and Meng, C. -I.: GUVI: A hyperspectral imager for geospace, Proc. SPIE, 5660, 227–240, doi:10.1117/12/579171, 2004.
R¨ottger, J.: Equatorial spreadFby electric fields and atmospheric gravity waves generated by thunderstorms, J. Atmos. Terr. Phys., 43, 453–462, 1981.
Sultan, P. J.: Linear theory and modeling of the Rayleigh-Taylor instability leading to the occurrence of equatorial spreadF., J. Geophys. Res., 101, 26 875–26 891, 1996.