UNIVERSIDADE FEDERAL DO RIO GRANDE DO NORTE
CENTRO DE BIOCIÊNCIAS
DEPARTAMENTO DE OCEANOGRAFIA E LIMNOLOGIA
PROGRAMA DE PÓS-GRADUAÇÃO EM ECOLOGIA
Efeitos da tilápia do Nilo,
Oreochromis niloticus
, sobre a
biomassa planctônica e a transparência da água ao longo de
um gradiente de enriquecimento por nutrientes
NATAL/RN
Efeitos da tilápia do Nilo, Oreochromis niloticus, sobre a biomassa
planctônica e a transparência da água ao longo de um gradiente de enriquecimento por nutrientes
FRANCISCO RIVERA DE VASCONCELOS
Dissertação apresentada ao Programa de Pós-Graduação em Ecologia da Universidade Federal do Rio Grande do Norte, como parte dos requisitos necessários para obtenção do grau de Mestre.
ORIENTADOR: Dr. José Luiz de Attayde
NATAL/RN
Catalogação da Publicação na Fonte. UFRN / Biblioteca Setorial do Centro de Biociências
Vasconcelos, Francisco Rivera.
Efeitos da tilápia do Nilo, Oreochromis niloticus, sobre a biomassa
planctônica e a transparência da água ao longo de um gradiente de enriquecimento por nutrientes / Francisco Rivera Vasconcelos. – Natal, RN, 2010.
44 f. : Il.
Orientador: Dr. José Luiz de Attayde.
Dissertação (Mestrado) – Universidade Federal do Rio Grande do Norte. Centro de Biociências. Departamento de Oceanografia e Limnologia. Programa de Pós-Graduação em Ecologia.
1. Peixe – Dissertação. 2. Onivoria – Dissertação. 3. Mesocosmos – Dissertação. I. Attayde, José Luiz. II. Universidade Federal do Rio Grande do Norte. III. Título.
FRANCISCO RIVERA DE VASCONCELOS
Efeitos da tilápia do Nilo, Oreochromis niloticus, sobre a biomassa
planctônica e a transparência da água ao longo de um gradiente de enriquecimento por nutrientes
Dissertação de mestrado apresentada como requisito parcial à obtenção do Título de Mestre em Ecologia do Programa de Pós-Graduação da Universidade Federal do Rio Grande do Norte, julgada pela seguinte banca examidora:
Natal, 02 de julho de 2010
___________________________________________________
Prof. Dr. David da Motta Marques, UFRGS
Universidade Federal do Rio Grande do Sul (UFRGS)
___________________________________________________
Prof. Dr. Adriano Caliman Ferreira da Silva
Universidade Federal do Rio Grande do Norte (UFRN)
___________________________________________________
Prof. Dra. Luciana Silva Carneiro
Universidade Federal do Rio Grande do Norte (UFRN)
___________________________________________________
Prof. Dr. José Luiz de Attayde
SUMÁRIO
1. Introdução ... 6
2. Material e métodos ... 8
2.1. Área de estudo e desenho experimental ... 8
2.2. Coleta e análise das amostras ... 9
2.3. Análise estatística ... 11
3. Resultados ... 12
3.1. Variáveis abióticas e clorofila a ... 12
3.2. Biomassa do Zooplâncton ... 15
3.3. Biovolume do Fitoplâncton ... 19
3.4. Biomassa das tilápias ... 20
4 Discussão ... 21
Referências ... 25
Resumo
A tilápia do Nilo (Oreochromis niloticus) é um peixe onívoro filtrador que pode ter efeitos negativos sobre a qualidade da água favorecendo o processo de eutrofizção. Esses efeitos negativos dos peixes onívoros filtradores devem ser dependentes do nível de enriquecimento da água por nutrientes. Nós realizamos um experimento em mesocosmos por cinco semanas em um lago artificial tropical para testar se os efeitos das tilápias são dependentes do nível de enriquecimento por nutrientes. O experimento teve duração de 5 semanas e consistiu num delineamento fatorial 2x5 onde 2 níveis de tilápia (presença e ausência) foram manipulados em combinação com 5 diferentes niveis (aportes) de nutrientes num total de 10 tratamentos.. Uma ANOVA bifatorial com medidas repetidas no tempo foi realizada para testar os efeitos do tempo (t), da tilápia (F) e do nutriente (NP) e os efeitos de suas interações sobre a clorofila a, transparência do disco de Secchi, concentração de fósforo e nitrogênio total e a razão entre eles (N:P), além do efeito sobre a biomassa da comunidade zooplanctônica e o biovolume de fitoplâncton. O efeito da tilápia foi evidente, enquanto o enriquecimento por nutrientes não mostrou efeito algum. Quando presente, a tilápia diminuiu a transparência do disco de Secchi e a biomassa total do zooplâncton, de copépodos calanóides, naúplios de copépodos e de cladóceros. Porém, nenhum efeito foi detectado da tilápia sobre o biovolume do fitoplâncton. Essa ausência de efeito pode ser devido a herbivoria da tilápia que contrabalança os seus efeitos positivos via cascata trófica e ciclagem de nutrientes. Desta forma, uma redução do estoque pesqueiro de tilápias para promover uma melhoria na qualidade da água não afetaria a biomassa fitoplanctônica e consequentemente não atingiria o seu objetivo.
Palavras chaves: enriquecimento por nutrientes, onivoria, mesocosmos, Oreochromis
Abstract
The omnivorous filter-feeding fish, Nile tilapia (Oreochromis niloticus), can have negative effects on water quality enhancing the eutrophication process. These effects depend on the nutrient enrichment level in the water. We carried out a mesocosm experiment for five weeks in a tropical man-made lake in Brazil to test ifthe effects of tilapias depend on of the level of nutrient enrichment. The experiment lasted for 5 weeks and a factorial 2x5 experimental design was used where the presence and absence of tilapias were manipulated in combination to 5 different levels of nutrient load in a total of 10 treatments. A two way repeated measure ANOVA was performed to evaluate the effects of time (t), tilapia (F), nutrients (NP) and the interactions among these factors on: chlorophyll a, water transparency, total phosphorous, total nitrogen, N:P ratio, zooplankton biomass and phytoplankton biovolume. The tilapia effect was evident, but nutrient enrichment didn’t have any effect on the variables analyzed. Tilapia decreased the water transparency, total zooplankton biomass, calanoid copepod biomass, nauplii copepod biomass and cladocerans biomass. On the other hand, tilapia had no effect on phytoplankton biovolume. This lack of effect on phytoplankton is probably due to tilapia grazing that may counteract the positive effect of tilapia on phytoplankton via trophic cascades and nutrient recycling. Hence, a reduction in tilapia stock would not be an effective way to reduce phytoplankton biomass and improve water quality.
1. Introdução
A biomassa e a produtividade primária de algas e cianobactérias nos ecossistemas aquáticos é controlada não só pela disponibilidade de nutrientes e luz, mas também pela estrutura da rede alimentar. O avanço nos estudos de redes alimentares pelágicas tem sugerido que a manipulação da abundância de peixes no topo das cadeias alimentares pode desencadear efeitos em cascata que afetam a abundância de algas na base dessas cadeias. Tal biomanipulação tem sido proposta como uma ferramenta de manejo para a restauração de lagos eutrofizados em regiões climáticas temperadas. A hipótese envolvida nas estratégias clássicas de biomanipulação é que uma redução na abundância de peixes planctívoros, seja pela adição de peixes piscívoros ou remoção de peixes planctívoros, leva a um aumento da abundância do zooplâncton herbívoro e conseqüentemente uma redução da abundância de fitoplâncton e um aumento na transparência da água (Carpenter et al., 1985; Carpenter et al., 1987; Moss et al., 2004). No entanto, esta hipótese se baseia na premissa de que níveis tróficos são categorias discretas bem definidas e que as cadeias alimentares pelágicas possuem um baixo grau de onivoria. Portanto, em lagos e reservatórios tropicais, esta premissa não é realista visto que a comunidade de peixes desses ambientes é fortemente dominada por peixes onívoros.
assimilação pelo zooplâncton, principalmente o de pequeno porte que tende a dominar nesses ambientes.
No semi-árido brasileiro, por exemplo, uma espécie exótica de peixe onívoro oriundo da África, a tilápia do Nilo (Oreochromis niloticus) responde por grande parte da produção pesqueira registrada nos reservatórios públicos da região (Gurgel & Fernando, 1994). A tilápia do Nilo é um peixe onívoro filtrador que consome basicamente fitoplâncton, zooplâncton e detritos em suspensão (Starling et al., 2002; Lazzaro et al., 2003; Njiru et al. 2004; Figueredo & Giani 2005). Assim sendo, é possível que os efeitos positivos indiretos da tilápia do Nilo sobre o fitoplâncton via cascata trófica sejam contrabalançados com os efeitos negativos diretos da herbivoria da tilápia sobre as algas de modo que o efeito liquido da tilápia sobre o fitoplâncton seja mais fraco do que os efeitos de peixes exclusivamente zooplanctívoros (Diana et al., 1991; Polis & Strong, 1996; Pace et al., 1999). A tilápia ainda pode contribuir para aumentar a biomassa fitoplanctônica através da translocação de nutrientes do sedimento para a coluna d’água (Drenner et al. 1996; Drenner et al. 1998), uma vez que esta espécie possui o hábito de ressuspender sedimentos durante a nidificação e também é capaz de se alimentar de detritos no sedimento.
2. Material e métodos
2.1. Área de Estudo e desenho experimental
O experimento foi realizado no período de 19 de Outubro de 2006 a 17 de Novembro de 2006 no reservatório da Estação Ecológica do Seridó, que está localizado no município de Serra Negra do Norte, Rio Grande do Norte, Brasil (06°34’8520’’N, 37°15’519’’O). A Estação Ecológica possui uma área de 1166,38 hectares, inserida totalmente em uma região climática semi-árida e é um local destinado à preservação e conservação da biodiversidade da Caatinga desde 1982. O estado trófico do reservatório é mesotrófico, e este possui uma capacidade de 433.000 m³ (Medeiros, 2005), uma área aproximada de 1 ha e uma profundidade máxima de 6m.
O experimento foi realizado em 20 mesocosmos (enclosures) cilíndricos com 2 m de altura e 2,5 m de diâmetro, revestidos com plástico de polietileno transparente com espessura de 0,45µm, sendo completamente isolados do ambiente adjacente, mas abertos para a atmosfera e para o sedimento, para permitir interações físicas e químicas entre a atmosfera, água e sedimento. Cada mesocosmo tinha um volume aproximado de 9,8 m³ e foram cheios com a água do próprio reservatório, além de cobertos com uma rede para impedir possível fuga de peixes. Na extremidade inferior de cada mesocosmo também foi fixada uma tela de PVC para evitar escapes dos peixes utilizados nos experimentos.
Monobásico (KH2PO4). As soluções de nutrientes foram adicionadas semanalmente logo após a coleta das amostras de água.
A densidade de tilápias estocadas nos mesocosmos, que receberam peixes, foi de 1 peixe. m ³. A biomassa média de estocagem foi de 1327,6 g.m ³ (± 130,466) em cada mesocosmo. As tilápias foram cedidas pela Estação de Piscicultura Estevão de Oliveira do DNOCS em Caicó, e foram pesados no início e no final do experimento.
2.2. Coleta e análise das amostras
As amostras foram coletadas com o auxílio de um tubo de PVC, com capacidade de 15 litros, em três diferentes pontos de cada mesocosmo e integradas em uma única amostra de aproximadamente 45 litros do respectivo mesocosmo. Desta amostra integrada foram retirados 200 ml para análise de clorofila a, 300 ml para análise de fósforo total (Ptotal), 300 ml para análise de nitrogênio total (Ntotal) e 100ml para análise de fitoplâncton. As amostras para determinação do fósforo total e do nitrogênio total foram congeladas e as de fitoplâncton foram fixadas com lugol. Com auxílio de uma rede de plâncton com abertura de malha de 20µm foram feitos dois arrastos de 1,5m de profundidade. Os arrastos foram concentrados em um volume de 100 ml, e neste volume foram adicionados formol 4% para preservar o zooplâncton. Também foram feitas coletas em três pontos do reservatório durante cada semana de experimento.
feofitina (Stich & Brinker, 2005). A análise de fósforo total foi feita pelo método do ácido ascórbico após digestão com persulfato (APHA 1997), enquanto que o nitrogênio total foi realizado pelo método de Valderrama (1981), que se baseia na oxidação da maioria dos compostos nitrogenados em meio básico, e pelo método colorimétrico após reação do nitrato com o salicilato de sódio (Muller & Weidemann, 1955).
Os organismos zooplanctônicos foram contados em uma câmara de Sedwick-Rafter de 1 ml utilizando um microscópio binocular. Foram contadas de 3 a 4 subamostras para cada amostra coletada no campo. Após a contagem fez-se uma média para cada grupo de organismos contados nas subamostras. Esse valor foi multiplicado pelo volume da amostra (mL) e dividido pelo volume de água (L) que passou pela rede para estimar a quantidade total de organismos na amostra.
Para a estimativa da biomassa zooplanctônica foram medidos pelo menos 20-30 indivíduos, aleatoriamente escolhidos, das espécies ou gêneros mais abundantes. Para os rotíferos foram utilizadas fórmulas geométricas que melhor se ajustam aos organismos encontrados nas amostras (Ruttner-Kolisko, 1977). O peso fresco foi estimado através do biovolume de cada rotífero, assumindo que 106 m3 corresponde a 1 g do peso fresco. O peso seco foi estimado como sendo 10% do peso fresco (Pace & Orcutt, 1981). Para cladóceros e copépodos foram utilizadas equações de regressão que correlacionam peso seco e comprimento (Bottrell et al., 1976).
al., 1999). O fitoplâncton foi separado em dois grupos de acordo com a maior dimensão linear axial (Greastest Axial Linear Dimension - GALD): pequeno ( GALD 50µm) e grande (GALD > 50µm).
2.3. Análise Estatística
Para testar os efeitos da tilápia, do enriquecimento por nutrientes, do tempo, além da interação entre esses fatores sobre a biomassa fitoplanctônica e zooplanctônica, a profundidade do disco de Secchi, a concentração de nitrogênio e fósforo total, e a razão entre o nitrogênio e o fósforo total (N:P), foi realizada uma ANOVA fatorial modelo misto (fator nutrientes foi considerado aleatório e o fator tilápia foi considerado fixo) com medidas repetidas no tempo. O fator nutrientes foi escolhido pra ser aleatório, pois diferentemente do fator fixo que representa condições específicas de interesse (p.ex. ausência e presença da tilápia), o fator nutrientes foi representado por 5 níveis escolhidos aleatoriamente dentro de um conjunto bem maior de níveis possíveis (Jackson e Brashers, 1994). Apesar disso, os resultados da ANOVA utilizando os nutrientes como fator aleatório não diferiu daqueles na qual o fator nutrientes foi fixo. Portanto, apenas os resultados da ANOVA considerando os dois fatores fixos foram reportados neste trabalho.
3. Resultados
3.1 Variáveis abióticas e clorofila a
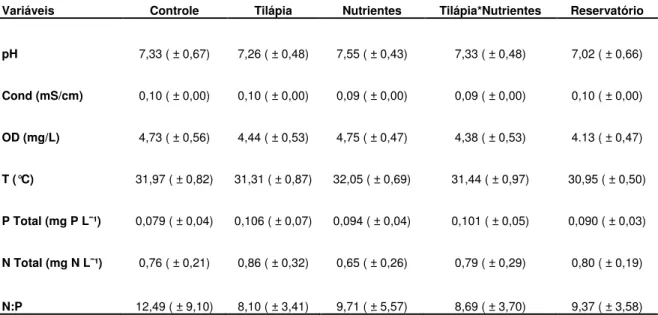
As variáveis abióticas pH, condutividade elétrica, oxigênio dissolvido e a temperatura também não sofreram efeito da tilápia, do enriquecimento por nutrientes, do tempo ou da interação entre esses fatores, desta forma, essas variáveis indicadoras de qualidade de água foram descritas pelas médias e seus respectivos desvios padrão por tratamento (Tabela 01).
Durante o experimento as concentrações de fósforo total e nitrogênio total e a razão N:P não foram afetadas significativamente pela tilápia, pelo enriquecimento por nutrientes ou pela interação entre esses dois fatores (Tabela 02). Apenas o fósforo total foi afetado pelo tempo.
Tabela 01 Valores médios e desvio padrão dos valores de pH, condutividade elétrica, oxigênio dissolvido, temperatura, fósforo e nitrogênio total, e razão N:P por tratamento.
Variáveis Controle Tilápia Nutrientes Tilápia*Nutrientes Reservatório
pH 7,33 ( ± 0,67) 7,26 ( ± 0,48) 7,55 ( ± 0,43) 7,33 ( ± 0,48) 7,02 ( ± 0,66)
Cond (mS/cm) 0,10 ( ± 0,00) 0,10 ( ± 0,00) 0,09 ( ± 0,00) 0,09 ( ± 0,00) 0,10 ( ± 0,00)
OD (mg/L) 4,73 ( ± 0,56) 4,44 ( ± 0,53) 4,75 ( ± 0,47) 4,38 ( ± 0,53) 4.13 ( ± 0,47)
T (°C) 31,97 ( ± 0,82) 31,31 ( ± 0,87) 32,05 ( ± 0,69) 31,44 ( ± 0,97) 30,95 ( ± 0,50)
P Total (mg P L ¹) 0,079 ( ± 0,04) 0,106 ( ± 0,07) 0,094 ( ± 0,04) 0,101 ( ± 0,05) 0,090 ( ± 0,03)
N Total (mg N L ¹) 0,76 ( ± 0,21) 0,86 ( ± 0,32) 0,65 ( ± 0,26) 0,79 ( ± 0,29) 0,80 ( ± 0,19)
Tabela 02 Resultado da ANOVA fatorial com medidas repetidas no tempo para clorofila a,
disco de Secchi, nitrogênio total, fósforo total e razão N:P. F= tilápia; NP = Enriquecimento por
nutrientes; FxNP = interação entre tilápia e enriquecimento por nutrientes; t = tempo; t*F =
interação entre tempo e tilápia; t*NP = interação entre tempo e o enriquecimentos por
nutrientes; e t*F*NP = interação entre tempo, tilápia, e enriquecimento por nutrientes.
Variáveis G. L QM F P
Chl a
F 1 0,08 2,02 0,21
NP 4 0,07 1,86 0,24
F x NP 4 0,16 4,06 0,06
Erro 6 0,04
t 3 0,97 19,60 0,000*
t*F 3 0,03 0,68 0,58
t*NP 12 0,03 0,65 0,78
t*F*NP 12 0,05 1,04 0,46
Erro 18 0,05
Secchi
F 1 0,01 19,38 0,001 *
NP 4 0,00 0,38 0,82
F x NP 4 0,00 1,25 0,35
Erro 10 0,00
t 4 0,00 8,46 0,00*
t*F 4 0,00 8,64 0,00*
t*NP 16 0,00 0,43 0,96
t*F*NP 16 0,00 0,92 0,55
Erro 40 0,00
Nitrogênio Total
F 0
NP 3 0,01 0,79 0,54
F x NP 3 0,00 0,22 0,88
Erro 6 0,02
t 0
t*F 0
t*NP 12 0,01 0,68 0,75
t*F*NP 12 0,01 0,61 0,81
Erro 24 0,01
Fósforo Total
F 1 0,02 1,46 0,26
NP 4 0,02 2,15 0,17
F x NP 4 0,03 3,19 0,08
Erro 8 0,01
t 4 0,39 14,88 0,00*
t*F 4 0,02 0,85 0,51
t*NP 16 0,02 0,76 0,72
t*F*NP 16 0,02 0,75 0,73
Erro 32 0,03
Razão N:P
F 0
NP 2 0,04 14,83 0,01*
F x NP 2 0,04 15,33 0,01*
Erro 5 0,00
t 0
t*F 0
t*NP 8 0,02 0,77 0,64
t*F*NP 8 0,02 0,65 0,73
Erro 20 0,03
Embora os dados iniciais da transparência do disco de Secchi já tenham sofrido um efeito significativo da tilápia ( F= 17,092, p< 0,003, em anexo), o efeito negativo da tilápia detectado pela ANOVA fatorial com medidas repetidas no tempo não pode ser negligenciado, pois no início do experimento os mesocosmos com tilápia apresentavam uma transparência do disco de Secchi maior do que nos mesocosmos sem tilápia e no decorrer do experimento essa situação foi revertida (Figura 01A). Apartir da segunda semana de experimento quando a tilápia estava presente a transparência do disco foi baixa, enquanto na ausência da tilápia a transparência do disco foi mais alta. Esse efeito da tilápia não dependeu do nível de enriquecimento por nutrientes mas dependeu do tempo (Figura 01A).
Figura 01 Valores médios e desvios padrão da transparência do disco de Secchi (A) e da
concentração da clorofil a (B) durante o experimento nos tratamentos com e sem tilápia e no
reservatório. São apresentados os valores de F e p resultantes da ANOVA fatorial com
medidas repetidas no tempo para o efeito da tilápia, do tempo e da interação entre esses dois fatores. F= tilápia; t = tempo; e t*F = interação tempo*tilápia. Valores considerados significativos assumindo = 0,05.
3.2 Biomassa do Zooplâncton
A biomassa zooplantônica foi dominada principalmente por copépodos calanóides do gênero Notodiaptomus tanto nos mesocosmos quanto no reservatório durante o experimento. Os principais gêneros de rotíferos foram Brachionus, Keratella, Filinia, Trichocerca e Hexarthra, enquanto Moina,
Ceriodaphnia, Diaphanosoma, Chidoridae e Bosmina corresponderam aos
principais grupos dentre os cladóceros. Thermocyclops foi o principal gênero no grupo dos copépodos ciclopóides.
A ANOVA fatorial com medidas repetidas no tempo detectou um efeito negativo significativo da tilápia sobre a biomassa de cladóceros, copépodos calanóides, naúplios de copépodos e sobre a biomassa total de zooplâncton (Tabela 03; Figura 02 A, C, E e F, respectivamente), enquanto as biomassas de rotíferos e copépodos ciclopóides não foram afetados pela tilápia (Tabela 03; Figura 02 B e D, respectivamente). Não houve efeito do enriquecimento por nutrientes nem da interação entre a tilápia e o enriquecimento por nutrientes sobre as biomassas dos grupos zooplanctônicos (Tabela 03).
calanóides maior do que nos mesocosmos sem tilápia, e no decorrer do experimento essa situação foi revertida (Figura 02 C).
Tabela 03 Resultado da ANOVA fatorial com medidas repetidas no tempo para os grupos
zooplanctônicos. F= tilápia; NP = Enriquecimento por nutrientes; FxNP = interação entre tilápia
e enriquecimento por nutrientes; t = tempo; t*F = interação entre tempo e tilápia; t*NP =
interação entre tempo e o enriquecimentos por nutrientes; e t*F*NP = interação entre tempo,
tilápia, e enriquecimento por nutrientes.
Variáveis G. L QM F P
Cladóceros
F 1 4,44 13,26 0,02 *
NP 4 0,29 0,86 0,56
F x NP 4 0,31 0,92 0,53
Erro 4 0,33
t 4 0,05 0,94 0,47
t*F 4 0,06 1,04 0,42
t*NP 16 0,07 1,28 0,31
t*F*NP 16 0,10 1,94 0,10
Erro 16 0,05
Rotíferos
F 1 0,05 0,48 0,51
NP 4 0,15 1,38 0,32
F x NP 4 0,09 0,87 0,52
Erro 8 0,11
t 4 0,8536 30,976 0,00*
t*F 4 0,0990 3,591 0,02*
t*NP 16 0,0435 1,578 0,13
t*F*NP 16 0,0322 1,169 0,34
Erro 32 0,0276
Calanóides
F 1 1,91 17,45 0,00 *
NP 4 0,11 1,03 0,45
F x NP 4 0,01 0,08 0,99
Erro 8 0,11
t 4 1,39 11,82 0,00*
t*F 4 0,39 3,32 0,02*
t*NP 16 0,06 0,54 0,90
t*F*NP 16 0,13 1,10 0,40
Erro 32 0,12
Ciclopóides
F 1 0,10 2,00 0,20
NP 4 0,04 0,70 0,61
F x NP 4 0,01 0,24 0,91
Erro 8 0,05
t 4 0,12271 3,3130 0,02*
t*F 4 0,03491 0,9426 0,45
t*NP 16 0,04437 1,1978 0,32
t*F*NP 16 0,02322 0,6270 0,84
Erro 32 0,03704
Naúplios
F 1 0,47 30,06 0,00 *
NP 4 0,06 3,71 0,054
F x NP 4 0,01 0,50 0,74
t 4 0,49 18,93 0,00*
t*F 4 0,04 1,37 0,27
t*NP 16 0,03 1,20 0,32
t*F*NP 16 0,02 0,92 0,55
Erro 32 0,03
Total
F 1 0,40 8,09 0,02 *
NP 4 0,15 3,09 0,07
F x NP 4 0,03 0,51 0,73
Erro 9 0,05
t 4 0,09 1,35 0,27
t*F 4 0,19 2,81 0,04*
t*NP 16 0,06 0,95 0,53
t*F*NP 16 0,08 1,13 0,36
Erro 36 0,07
*Valores considerados significativos assumindo um valor de igual a 0,05.
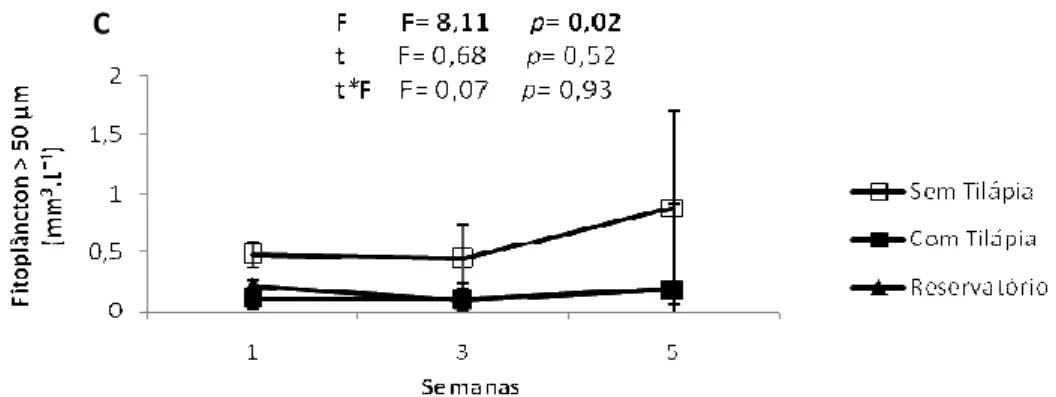
Figura 02 Valores médios e desvio padrão da biomassa de cladóceros (A), de rotíferos (B), de copépodos de calanóide (C), de copépodos de ciclopóides (D), de naúplios (E), e do total de zooplânton (F) durante o experimento nos tratamentos com e sem tilápia e no reservatório. São
apresentados os valores de F e p resultantes da ANOVA fatorial com medidas repetidas no
tempo para o efeito da tilápia, do tempo e da interação entre esses dois fatores. F= tilápia; t = tempo; e t*F = interação tempo*tilápia. Valores considerados significativos assumindo = 0,05.
3.3 Biovolume do Fitoplâncton
Figura 03 Valores médios e desvio padrão da biomassa total do fitoplâcton (A), do fitoplâncton pequeno (GALD 50µm) (B), e do fitoplâncton grande (GALD > 50µm) (C) durante o experimento nos tratamentos com e sem tilápia e no reservatório. São apresentados os valores
de F e p resultantes da ANOVA fatorial com medidas repetidas no tempo para o efeito da
tilápia, do tempo e da interação entre esses dois fatores. F= tilápia; t = tempo; e t*F = interação tempo*tilápia. Valores considerados significativos assumindo = 0,05.
3.4 Biomassa das tilápias
O teste t pareado mostrou que a biomassa das tilápias estocadas nos mesocosmos não aumentou ou diminuiu (t = -0,417626, p =0,69). Portanto, as tilápias não incrementaram biomassa ao longo do experimento, mantendo um peso constante (Figura 04).
4. Discussão
Peixes onívoros filtradores como a tilápia do Nilo (Oreochromis niloticus) podem afetar tanto os organismos zooplanctônicos quanto os fitoplanctônicos por vias diretas e indiretas. No presente experimento a tilápia do Nilo reduziu diretamente a biomassa total de zooplâncton, de cladóceros, de copépodos calanóides e de naúplios de copépodos, porém esta não desencadeou efeito positivo sobre o fitoplâncton via cascata trófica. Na verdade, a tilápia não teve efeito algum sobre a concentração de clorofila a, sobre os biovolumes do total de fitoplâncton, do fitoplâncton grande (GALD > 50µm) e do fitoplâncton pequeno (GALD 50µm). Contudo, houve redução na transparência do disco de Secchi e esta redução deve estar relacionada a bioturbação do sedimento ou resuspensão do seston em sedimentação, uma vez que não houve maior crescimento dos organismos fitoplanctônicos na presença dos peixes.
1998; Figueredo & Giani, 2005; Attayde & Menezes, 2008; Okun et al., 2008; Rondel et al., 2008; Menezes et al. 2009).
De uma forma mais específica, por exemplo, em um trabalho realizado nos mesmos mesocosmos e reservatório do presente estudo, Okun et al. (2008) constataram que na presença da tilápia do Nilo houve uma dimunição da biomassa total do zooplâncton, porém nenhum efeito foi encontrado sobre o biovolume total de fitoplâncton (assim como para a concentração de clorofila a) e sobre o fitoplâncton grande (GALD > 50µm). Apenas o fitoplâncton pequeno (GALD 50µm) foi afetado e esse efeito foi positivo na presença do peixe. Já em outro experimento, também realizado nos mesmos mesocosmos e mesmo reservatório, Menezes et al. (2009) encontraram um efeito negativo da tilápia sobre a biomassa total de zooplâncton e sobre os biovolumes do total de fitoplâncton e do fitoplâncton grande (GALD > 50µm), enquanto o fitoplâncton pequeno (GALD 50µm) não respondeu à presença da tilápia. Portanto, os dois trabalhos citados anteriormente e o presente estudo só concordam no fato de que a tilápia do Nilo afeta a biomassa total de zooplâncton de uma maneira análoga aos peixes zooplanctívoros, ou seja, diminui a biomassa dos organismos maiores como copépodos calanoides e cladóceros . Por outro lado, o efeito sobre o fitoplâncton foi variável e deve depender das condições iniciais do estudo e da importância relativa dos efeitos diretos e indiretos envolvidos nas teias alimentares planctônicas.
eficientemente filtrado pela tilápia (Turker et al., 2003), enquanto o presente estudo observou uma dominância do fitoplâncton pequeno (GALD 50µm), que é filtrado de forma menos eficiente. Uma outra razão para a divergência dos resultados, quanto ao biovolume do fitoplâncton, pode ser devido ao estado fisiológico dos peixes. Enquanto em Menezes et al. (2009, em anexo) os peixes praticamente dobraram em biomassa, o presente estudo não detectou nenhum mudança na biomassa do peixe ao longo do experimento. Portanto, a tilápia pode ter apresentado uma menor taxa metabólica em relação ao trabalho de Menezes et al. (2009, em anexo), havendo desta forma uma menor taxa de consumo de fitoplâncton por biomassa de peixe.
Ao contrário da tilápia do Nilo, o enriquecimento por nutrientes (fósforo e nitrogênio) não teve efeito nem sobre o zooplâncton nem sobre o fitoplâncton. Portanto, contrariando a hipótese levantada por alguns autores (Lazzaro, 1997; Moss et al., 2004; Stephen et al., 2004; Jeppesen et al., 2007) de que nos trópicos o controle via recurso sobrepuja o controle via consumidor, o presente trabalho mostrou que o peixe onívoro filtrador foi mais importante na regulação da cadeia alimentar do que o enriquecimento por nutrientes.
Alguns trabalhos sustentam a hipótese de que os efeitos dos peixes onívoros sobre a produção primária, sobre a transparência da água e sobre a biomassa do zooplâncton são dependentes do grau de enriquecimento por nutrientes do ambiente (Drenner et al. 1996, 1998; Vanni et al., 2006). Contrariando essa hipótese, o presente experimento mostrou que os efeitos da tilápia foram independentes do nível de enriquecimento por nutrientes.
disso, os nutrientes podem ter sido transferidos para o sedimento através de ligações com a matéria orgânica e/ou com partículas suspensas oriundas do sedimento (Wetzel, 2001).
Referências
Acuña, P., Vila, I. & Marín, V.H. (2008). Short-term of phytoplankton to nutrient enrichment and planktivorous fish predation in a temperature South American mesotrophic reservoir. Hydrobiologia, 600:1, 131-138.
APHA (1997). Standard methods for the examination of water and wastewater. 17th ed., Washington, DC.
Attayde, J.L., Okun, N., Brasil, J., Menezes, R. & Mesquita, P. (2007). Impactos da introdução da tilápia do Nilo, Oreochromis niloticus, sobre a
estrutura trófica dos ecossistemas aquáticos do bioma Caatinga. Oecol.Bras., 11 (3): 450 – 461.
Attayde, J. L. & Menezes, R. (2008).Effects of fish biomass and planktivore type on plankton communities. Journal of Plankton Research, 30: 885–892.
Bottrell, H.H., Duncan, A., Gliwicz, Z.M., Grygierek, E., Herzing, A., Hillbricht-Ilkowska, A., Kurasawa, H., Larsson, P. & Weglenska, T. (1976). A review of some problems in zooplankton production studies. Norw. J. Zool., 24: 419-456.
Bouvy M., Falcao D., Marinho M., Pagano M. & Moura A. (2000). Occurrence of Cylindrospermopsis (Cyanobacteria) in 39 Brazilian tropical reservoirs during the 1998 drought. Aquatic Microbial Ecology, 23, 13–27.
Carpenter, S. R, Kitchell, J. F. & Hodgson, J. R. (1985). Cascading trophic interactions and Lake Productivity. Bioscience. 35 (10): 635-639.
Carpenter, S. R, Kitchell, J. F. & Hodgson, J. R., Cochran, P. A., Elser, J. J., Elser, M. M., Lodge, D. M., Kretchmer, D., He, X., Ende, C. N. Von. (1987). Regulation of Lake Primary Productivity by Food Web Structure Ecology, 68, 6, 1863-1876.
Diana, J. S., Dettweiler, D. J. & Lin, C. K. (1991). Effect of Nile Tilapia
significance to the trophic cascade hypothesis. Canadian Journal of Fisheries and Aquatic Science. 48: 183-190.
Drenner, R. W., Smith, J. D. & Threlkeld, S. T. (1996). Lake trophic state and the limnological effects of omnivorous fish. Hydrobiologia. 319: 213-223.
Drenner, R. W.,Gallo, K. L., Baca, R. M. and Durward Smith, J. (1998). Synergistic effects of nutrient loading and omnivorous fish on phytoplankton biomass. Canadian Journal of Fisheries and Aquatic Sciences. 55: 2087-2096.
Elhigzi F.A.R., Haider S.A. & Larsson P. (1995). Interactions between Nile tilapia (Oreochromis niloticus) and cladocerans in ponds (Khartoum, Sudan). Hydrobiologia, 307: 263–272.
Fernando C.H. (1994). Zooplankton, fish and fisheries in tropical freshwaters. Hydrobiologia, 272, 105–123.
Figueredo, C. C. & Giani, A. (2005). Ecological interactions between Nile Tilapia (Oreochromis niloticus) and phytoplanktonic community of the
Furnas Reservoir (Brazil). Freshwater Biology, 50: 1391-1403.
Gurgel, J. J. S, Fernando, C. H. (1994). Fisheries in semi -arid northeast Brazil with special reference to the role of tilapias. Institute Revue Gestation Hydrobiology, 79 (1): 77-94.
Hillebrand, H., Dürselen, C., D., Kirschtel, D., Zohary, T., Pollingher, U. (1999). Biovolume calculation for pelagic and benthic microalgae. Journal of Phycology 35: 403–424.
Jackson, S. & Brashers, D. E. (1994). Random factors in Anova. Sage University Paper series on Quantitative Applications in the Social Sciences, 07-098. Thousand Oaks, CA: Sage.
of shallow lakes by nutrient control and biomanipulation – the successful strategy varies with lake size and climate. Hydrobiologia, 581: 269–285.
Jespersen, A. M. & Christoffersen, K. (1987). Measurements of chlorophyll-a from phytoplankton using ethanol as extraction solvent. Arch. Hydrobiol. 109: 445-454.
Lazzaro X. (1987). A review of planktivorous fishes: their evolution, feeding, behaviours, selectivities and impacts. Hydrobiologia, 146: 97–167.
Lazzaro X. (1997). Do the trophic cascade hypothesis and classical biomanipulation approaches apply to tropical lakes reservoirs? Verhandlungen Internationale Vereinigung fuer Theoretische und Angewandte Limnologie, 26: 719–730.
Lazzaro, X., Bouvy, M., Ribeiro-Filho, R.A., Oliveira, V.S., Sales, L.T., Vasconcelos, A.R.M. & Mata, M.R. (2003). Do fish regulate phytoplankton in shallow eutrophic Northeast Brazilian reservoirs. Freshwater Biology 48: 649-668.
Lu, K., Jin, C., Dong, S., Gu, B. & Bowen, S.H. (2006). Feeding and control of blue-green algal blooms by tilapia (Oreochromis niloticus). Hydrobiologia, 568: 111-120.
Lund J. W. G.; Kipling & Lecren, E. D. (1958). The inverted microscope method of estimating algae number and the statistical basis of estimating by counting. Hydrobiologia, 11: 143-170.
Margalef, R (1983). Limnologia. Barcelona: Editorial Ômega.
Menezes, R., Attayde, J. L. & Vasconcelos, F. R. (2009). Effects of omnivorous filter-feeding fish and nutrient enrichment on the plankton community and water transparency of a tropical reservoir. Freshwater Biology, 55: 767-779.
Moss, B., Stephen, D., Balayla, D.M., Bécares, E., Collings, S.E., Fernández-Aláez, C., Fernández-Fernández-Aláez, M., Ferriol, C., García, P., Gomá, J., Gyllström, M., Hansson, L.-A., Hietala, J., Kaireselo, T., Miracle, M.R., Romo, S., Rueda, J., Stahl-Delbanco, A., Svensson, M., Vakkilainen, K., Valentín, M., Van De Bund, W.J., Van Donk, E., Vicente, E. & Villena, M.J. (2004). Continental-scale patterns of nutrient and fish effects on shallow lakes: synthesis of a pan-European mesocosm experiment. Freshwater Biology, 49: 1633-1649.
Muller, R & Weidemann, O. (1955). Die Bestimmung des Nitrat-Ions in Wasser. Von Wasser. 22, 247p.
Njiru, M., Okeyo-Owuor, J. B., Muchiri, M. & Cowx, I. G. (2004). Shifts in the food of
the tilapia, Oreochromis niloticus (L.) in Lake Victoria, Kenya. African Journal of
Ecology, 42: 163-170.
Okun, N., Brasil, J., Attayde, J.L. and Costa, I.A.S. (2008). Omnivory does not prevent trophic cascades in pelagic food webs. Freshwater Biology, 53: 129-138.
Pace, M.L., Cole, J.J., Carpenter, S.R. and Kitchell, J.F. (1999) Trophic cascades revealed in diverse ecosystems. Trends Ecol. Evol., 14, 483-488.
Pace, M.L & Orcutt, J.D.Jr. (1981). The relative importance of protozoans, rotifers and crustaceans in a freshwater zooplankton community. Limnology and Oceanography, 26: 822-830.
Qin, J. & Culver, D.A. (1995). Separate and combined effects of larval Walleye and fertilization on plankton community structure in enclosures. Journal of Freshwater Ecology. 4: 385 – 391.
Romo, S., Miracle, M.R., Villena, M-J., Rueda, J., Ferriol, C. & Vicente, E. (2004). Mesocosm experiments on nutrient and fish effects on shallow lake food webs in a Mediterranean climate. Freshwater Biology, 49: 1593 – 1607.
Rondel C., Arfi R., Corbin D., Le Bihan F., Ndour E.H. & Lazzaro X. (2008). A cyanobacterial bloom prevents fish trophic cascades. Freshwater Biology, 53: 637–651.
Ruttner-Kolisko, A. (1977). Suggestions for biomass calculation of plankton rotifers. Archiv für Hydrobiologie Beihefte Ergebnisse der Limnologie, 8: 71-76.
Starling, F., Lazzaro, X., Cavalcanti, C., and Moreira, R. (2002). Contribution of omnivorous tilapia to eutrophication of a shallow tropical reservoir: evidence from a fish kill. Freshwater Biology. 47: 2443-2452.
Starling, F., Beveridge, M., Lazzaro, X. & Bayrd, D. (1998). Silver carp biomass effects on the plankton community in paranoa reservoir (Brazil) and assessment of its potencial for improving water quality in lacustrine environments. International Review of Hydrobiology, 83: 499-507.
Stephen, D., Balayla, D.M., Bécares, E., Collings, S.E., Fernández-Aláez, C., Fernández-Aláez, M., Ferriol, C., García, P., Gomá, J., Gyllström, M., Hansson, L.-A., Hietala, J., Kaireselo, T., Miracle, M.R., Romo, S., Rueda, J., Stahl-Delbanco, A., Svensson, M., Vakkilainen, K., Valentín, M., Van De Bund, W.J., Van Donk, E., Vicente, E., Villena, M.J. & Moss, B. (2004). Continental-scale patterns of nutrient and fish effects on shallow lakes: introduction to a pan-European mesocosm experiment. Freshwater Biology, 49: 1517-1524.
Stumm W. & Morgan J.J. (1981). Aquatic Chemistry. John Wiley & Sons, New York.
Turker, H., Eversole, A.G. & Brune, D.E. (2003). Filtration of green algae and cyanobacteria by Nile tilpia, Oreochromis niloticus, in the Partitioned
Aquaculture System. Aquaculture, 215: 93-101.
Uhelinger, V (1964). Étude statistique des méthodes de dénobrement planctonique. Arch Sci, 17: 121-23.
Ütermol, H. (1958). Zur vervollkommung der quantitativen phytoplankton methodik. Mitt Int cer Theor Angew Limnol. 9: 1-38.
Valderrama, J.C. (1981). The simultaneous analysis of total nitrogen and total phosphorus in natural waters. Marine Chemistry. 10: 109-122.
Vanni M. J., K. K. Arend, M. T. Bremigan, D. B. Bunnell, J. E. Garvey, M. J. González,
W. H. Renwick, P. A. Soranno, and R. A. Stein (2005). Linking landscapes and
food webs: Effects of omnivorous fish and watersheds on reservoir ecosystems.BioScience, 55: 155-167.
Vanni, M. J., A. M. Bowling, E. M. Dickman, R. S. Hale, K. A. Higgins, M. J. Horgan, L.
B. Knoll, W. H. Renwick, and R. A. Stein (2006). Nutrient cycling by fish supports
relatively more lake primary production as ecosystem productivity increases. Ecology 87:1696-1709.
Anexos
1. Resultados da ANOVA fatorial para os valores das variáveis clorofila a (Chl a), Secchi,
nitrogênio total, fósforo total e razão N:P no primeiro dia de experimento. F= tilápia; NP =
Enriquecimento por nutrientes; e FxNP = interação entre tilápia e enriquecimento por
nutrientes.
*Valores considerados significativos assumindo um valor de igual a 0,05.
Variáveis G. L QM F P
Chl a
F 1 0,02445 2,484 0,146117
NP 4 0,00547 0,556 0,699866
F x NP 4 0,01061 1,078 0,417450
Erro 10 0,00984
Secchi
F 1 0,005467 17,092 0,002030*
NP 4 0,000137 0,427 0,786255
F x NP 4 0,000238 0,745 0,583226
Erro 10 0,000320
Nitrogênio Total
F 1 0,0004 0,09 0,771678
NP 4 0,0079 1,78 0,237749
F x NP 4 0,0024 0,53 0,718521
Erro 7 0,0045
Fósforo Total
F 1 0,03921 0,934 0,359004
NP 4 0,01630 0,388 0,812023
F x NP 4 0,04825 1,149 0,393691
Erro 9 0,04197
N:P
F 1 0,03301 0,8556 0,385740
NP 4 0,03795 0,9838 0,474202
F x NP 4 0,03931 1,0190 0,459158
2. Resultados da ANOVA fatorial para os valores da biomassa de cladóceros, rotíferos, calanóides, ciclopóides, naúplios e do total de zooplâncton (Total) no primeiro dia de
experimento. F= tilápia; NP = Enriquecimento por nutrientes; e FxNP = interação entre tilápia e
enriquecimento por nutrientes.
Variáveis G. L QM F P
Cladóceros
F 1 0,06036 3,049 0,111366
NP 4 0,00707 0,357 0,833611
F x NP 4 0,02388 1,206 0,366936
Erro 10 0,01980
Rotíferos
F 1 0,06036 3,049 0,111366
NP 4 0,00707 0,357 0,833611
F x NP 4 0,02388 1,206 0,366936
Erro 10 0,01980
Calanóides
F 1 1,134004 16,1506 0,002443
NP 4 0,115264 1,6416 0,238972
F x NP 4 0,129570 1,8453 0,196879
Erro 10 0,070214
Ciclopóides
F 1 0,046245 1,5176 0,246160
NP 4 0,033096 1,0861 0,413998
F x NP 4 0,035375 1,1609 0,383983
Erro 10 0,030472
Naúplios
F 1 0,05067 1,5598 0,240144
NP 4 0,04796 1,4763 0,280628
F x NP 4 0,05185 1,5960 0,249718
Erro 10 0,03249
Total
F 1 0,03079 1,341 0,273700
NP 4 0,02637 1,149 0,388642
F x NP 4 0,03062 1,334 0,322966
Erro 10 0,02295
3. Resultados da ANOVA fatorial para os valores do biovolume do fitoplâncton grande (GALD > 50 µm), do fitoplâncton pequeno (GALD 50 µm) e do biovolume do total de fitoplâncton (Total)
no primeiro dia de experimento. F= tilápia; NP = Enriquecimento por nutrientes; e FxNP =
interação entre tilápia e enriquecimento por nutrientes.
Variáveis G. L QM F P
GALD > 50
F 1 0,081036 39,6170 0,000090*
NP 4 0,002802 1,3698 0,311687
F x NP 4 0,004857 2,3747 0,121891
Erro 10 0,002045
GALD 50
F 1 0,000003 0,0006 0,980216
NP 4 0,004101 0,8827 0,508178
F x NP 4 0,006818 1,4674 0,283092
Erro 10 0,004646
Total
F 1 0,029868 6,2257 0,031710*
NP 4 0,007598 1,5838 0,252691
F x NP 4 0,012107 2,5236 0,107186
Erro 10 0,004798
Effects of omnivorous filter-feeding fish and nutrient
enrichment on the plankton community and water
transparency of a tropical reservoir
R O S E M B E R G F E R N A N D E S M E N E Z E S , J O S E´ L U I Z A T T A Y D E A N D F R A N C I S C O R I V E R A V A S C O N C E L O S
Centro de Biocieˆncias, Departamento de Botaˆnica, Ecologia e Zoologia, Universidade Federal do Rio Grande do Norte, Natal, Rio Grande do Norte, Brazil
S U M M A R Y
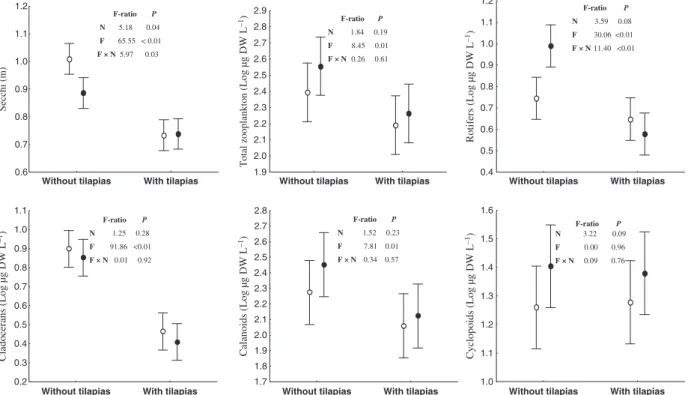
1. The major aim of this study was to test the hypothesis that nutrient enrichment and the introduction of the Nile tilapia (Oreochromis niloticus), an exotic omnivorous filter-feeding fish, operate interdependently to regulate plankton communities and water transparency of a tropical reservoir in the semi-arid northeastern Brazil. 2. A field experiment was performed for 5 weeks in 20 enclosures (9.8 m3) to which four treatments were randomly allocated: tilapia addition (F), nutrient addition (N), tilapia and nutrient addition (F + N) and a control treatment with no tilapia or nutrient
addition (C). A two-way repeated measuresA N O V AA N O V A was undertaken to test for time,
tilapia and nutrient effects and their interactions on water transparency, total phosphorus and total nitrogen concentrations, phytoplankton biovolume and zooplankton biomass. 3. Nutrient addition had no effect except on rotifer biomass, but there were significant fish effects on the biomass of total zooplankton, copepod nauplii, rotifers, cladocerans and calanoid copepods and on the biovolume of total phytoplankton, large algae
(GALD‡50lm), Bacillariophyta and Zygnemaphyceae and on Secchi depth. In addition, we found significant interaction effects between tilapia and nutrients on Secchi depth and rotifers. Overall, tilapia decreased the biomass of most zooplankton taxa and large algae (diatoms) and decreased water transparency, while nutrient enrichment
increased the biomass of rotifers, but only in the absence of tilapia.
4. In conclusion, the influence of fish on the reservoir plankton community and water transparency was significant and even greater than that of nutrient loading. This suggests that biomanipulation of filter-feeding tilapias may be of importance for water quality management of eutrophic reservoirs in tropical semi-arid regions.
Keywords: mesocosms, nutrient enrichment, omnivory,Oreochromis niloticus, trophic cascades
Introduction
Biological communities are regulated simultaneously by consumers and resources, but the relative impor-tance of top-down and bottom-up controls can be highly variable and a major goal of community
ecology is to understand when, where and why one structuring force is more important than the other. In the pelagic habitats of lakes, it has been hypothesised that the relative importance of top-down (i.e. fish predation) and bottom-up (i.e. nutrient enrichment) controls on plankton would change with latitude, with lower importance of top-down effects at lower latitudes (Lazzaro, 1997; Moss et al., 2004; Stephen et al., 2004; Jeppesenet al., 2007). One argument is that phytoplankton growth would benefit from extended Correspondence: Jose´ Luiz Attayde, Departamento de Botaˆnica,
Ecologia e Zoologia, CB, UFRN, Natal, Rio Grande do Norte, CEP: 59072-970, Brazil. E-mail: [email protected]
Freshwater Biology(2009) doi:10.1111/j.1365-2427.2009.02319.x
growing seasons in warm water lakes and, as phyto-plankton growth is faster than that of zoophyto-plankton, its growth would rather be controlled by nutrient short-age than by zooplankton grazing at lower latitudes (Moss et al., 2004; Stephen et al., 2004). Another argument is that zooplankton in (sub)tropical lakes, being often dominated by small-bodied species with low grazing pressure, would be less likely to control the development of algal populations than in temper-ate lakes (Fernando, 1994; Lazzaro, 1987; Jeppesen et al., 2007). Furthermore, the planktivorous fish stock in (sub)tropical lakes is often dominated by omnivo-rous species that reproduce throughout the year and are neither controlled by zooplankton availability nor by piscivore predation (Fernando, 1994; Lazzaro, 1997; Jeppesen et al., 2007). Therefore, the manipula-tion of fish communities in (sub)tropical lakes would be less likely to indirectly affect phytoplankton growth. Besides, the response of phytoplankton to this perturbation would be less predictable at lower latitudes due to higher levels of fish omnivory.
Omnivory (i.e. feeding on more than one trophic level) can either increase or decrease the biomass of primary producers depending on the relative strength of the direct and indirect effects of the omnivorous predators (Diehl, 1993). Many (sub)tropical lakes are dominated by omnivorous filter-feeding fish that can affect phytoplankton directly, by selectively consum-ing larger phytoplankton species (Datta & Jana, 1998; Turker, Eversole & Brune, 2003; Hambright, Blu-menhine & Shapiro, 2002; Lu et al., 2006), but also indirectly by suppressing herbivorous zooplankton, resuspending settled phytoplankton or excreting nutrients in dissolved forms into the water column (Stein, DeVries & Dettmers, 1995; Drenner, Smith & Threlkeld, 1996; Vanni, 2002). Therefore, while the abundance of large phytoplankton should be inhib-ited by fish grazing, the abundance of small phyto-plankton should be enhanced by filter-feeding fish due to suppression of large phytoplankton, reduction of herbivorous zooplankton and nutrient excretion (Drenneret al., 1996; Figueredo & Giani, 2005; Okun et al., 2008; Rondel et al., 2008). Hence, the overall effect of filter-feeding fish on total phytoplankton biomass and water transparency can be variable in both strength and direction and depends on the relative strength of these direct and indirect effects.
The strength of planktivorous fish effects on pelagic food webs depends also on lake trophic state (Brett
& Goldman, 1997; Pace et al., 1999). It has been suggested that the enhancement of phytoplankton biomass by planktivorous fish is stronger in oligo-trophic than in euoligo-trophic lakes (McQueen, Post & Mills, 1986; McQueen et al., 1989). However, other studies have demonstrated that changes in the biomass of planktivorous fish produce the greatest cascading effect on phytoplankton in eutrophic lakes (Perrowet al., 1997; Hanssonet al., 1998; Meijeret al., 1999; Paceet al., 1999; Jeppesenet al., 2003). Unfortu-nately, most work on the interaction between fish and nutrients has focused on visually feeding zooplank-tivorous fish and few studies have tried to understand the interaction between nutrients and filter-feeding fish effects on plankton communities (Chumchal & Drenner, 2004; Drenneret al., 1996, 1998).
Drenneret al. (1996, 1998) hypothesised that filter-feeding omnivorous fish interact synergistically with lake trophic state so that the fish effects on phytoplank-ton biomass and productivity become more intense with increased eutrophication. One mechanism for the existence of synergistic interactions between omnivo-rous fish and nutrients is that with simultaneous nutrient loading and zooplankton removal by fish, the phytoplankton can grow at a higher rate and reach higher biomass than in the absence of fish. Another mechanism is that nutrient recycling and translocation from benthic to pelagic habitats by omnivorous fish can increase with lake productivity and further increase phytoplankton biomass (Vanni & Headworth, 2004; Vanniet al., 2005). However, such synergism between nutrient enrichment and omnivorous fish effects implies that the negative effect of fish grazing on phytoplankton is negligible. If fish grazing on phyto-plankton is important one could actually expect an antagonistic or no interaction between nutrients and fish since the positive effect of enrichment on algal biomass would be counteracted by the negative effect of fish grazing. Likewise, an antagonistic or no inter-action would be expected between nutrients and fish effects on zooplankton if the negative effects of fish predation on zooplankton are attenuated by increased primary productivity with nutrient enrichment.
The present study aims to test the hypothesis that the effects of nutrient enrichment on phytoplankton biomass are enhanced by omnivorous filter-feeding fish, while the nutrient enrichment effects on zoo-plankton biomass are inhibited by fish. In other words, we aimed to test the hypothesis that nutrients
35 R. F. Menezeset al.
and omnivorous fish interact synergistically to affect phytoplankton and antagonistically to affect zoo-plankton in a tropical reservoir. We performed a field mesocosm experiment manipulating the pres-ence⁄absence of the Nile tilapia, Oreochromis niloticus L., at two levels of nutrient loading. The Nile tilapia is a planktivorous fish native to Africa but has been widely introduced to tropical lakes and reservoirs in Asia and America for aquaculture and fisheries purposes. The species is highly invasive (Canonico et al., 2005; Zambrano et al., 2006) and is probably the most widely distributed exotic fish worldwide after common carp (Cyprinus carpio carpio L.). To the best of our knowledge, this is the first experimental study that has investigated the combined effects of omnivorous fish and nutrients on the plankton community of a tropical freshwater system. Since many tropical lakes and reservoirs suffer from eutro-phication and introduction of exotic fish like tilapias, it is crucial to understand how omnivorous fish and nutrients may operate interdependently to regulate plankton communities and the water quality of these ecosystems.
Methods
Study area and experimental design
The experiment was performed from 4 September to 12 October 2006 in a small and shallow reservoir with an accumulation capacity of 433 000 m3 (V.M.A. Medeiros, unpubl. data) situated in Serido´ Ecological Station in Serra Negra, Rio Grande do Norte, Brazil (0634¢852¢¢N, 3715¢519¢¢W). The experiment was carried out in 20 mesocosms with a diameter of 2.5 m and a height of 2 m (c. 9.8 m3). They were placed side by side along the reservoir shore and had a cylinder shape with an iron frame on the bottom and at the top. The walls were made of transparent plastic (thickness: 0.45 mm). The mesocosms were open to the atmosphere and to the sediment but were com-pletely isolated from the surrounding reservoir water. The experimental design consisted of four treat-ments: tilapia addition (F), nutrient addition (N), tilapia and nutrient addition (F + N) and a control treatment with no tilapia or nutrient addition (C). The treatments were replicated five times and randomly allocated in the mesocosms containing the water and natural plankton community of the reservoir. The mesocosms
were free of fish and macrophytes from the beginning of the experiment. The fish (16.59 ± 7.23 cm) were collected at a fish hatching station 25 km from the reservoir and stocked in the treatments F and F + N with a density of 1 fish m)3. In the treatments with
nutrients, 1.14 g of KH2PO4and 10.88 g of NaNO3were added every week to get a final nutrient concentration in the water of the mesocosms of about 100lg L)1 P–PO4and 1000lg L)1N–NO
3.
The experiment lasted 5 weeks and sampling was performed on the first day, just after the stocking of fish into the enclosures and thereafter once every week. The nutrients were added once every week just after each sampling and the stocked fish were weighted at the start and at the end of the experiment. The variables monitored during the experiment, both in the mesocosms and reservoir, were: species com-position and relative abundance of phytoplankton and zooplankton, total phosphorus and total nitrogen concentrations, temperature, dissolved oxygen, pH, turbidity and electric conductivity of the water.
Collection and sample analysis
The water samples were collected through a 2 m high PVC channel at three different points in each mesocosm and integrated in a single representative sample, from which subsamples were taken for total nitrogen, total phosphorus and phytoplankton analyses. Zooplankton samples were collected through vertical taws with a plankton net with 20lm mesh size. The taws were done in the center of each mesocosm and the total volume filtered was about 212 L. The phytoplankton samples were fixed with lugol’s solution and the zooplankton samples with 4%formaldehyde. The total phosphorus
analysis was done according to the ascorbic acid method after persulphate digestion (APHA 1997), while total nitrogen was analysed as nitrate by the sodium salycilate method (Muller & Weidemann, 1955) after persulphate digestion in alkaline medium (Val-derrama, 1981). The temperature, pH, electric conduc-tivity and oxygen concentrations were measured through a multiparameter analyser U-22 HORIBA (Kyoto, Japan). The water transparency was measured with a Secchi disc.
The zooplankton organisms were counted under a microscope in a 1 mL Sedwick-Rafter chamber. Between three and five subsamples were counted for each sample collected in the field until a minimum of
Effects of omnivorous filter-feeding fish
36
100 individuals of each taxonomic group had been counted. Subsequently, the average of the subsamples was taken for each group of organisms counted, this being multiplied by the sample volume (mL) and divided by the subsample volume (1 mL) to estimate the total number of individuals in the sample. After-wards, the number of individuals in the sample was divided by the water volume (L) sampled in the field to calculate the original density (ind. L)1) of
organ-isms in the sample. For estimating zooplankton biomass at least 30, randomly chosen individual were measured, from the most abundant species. For rotifers geometrical formulae were used to estimate biovolume (Ruttner-Kolisko, 1977). Wet weight was estimated from the biovolume of each individual, assuming that 106lm3 corresponds to 1lg of wet weight. Dry weight was estimated as 10% of wet
weight (Pace & Orcutt, 1981). Microcrustacean bio-mass (copepods and cladocerans) was estimated using regression equations relating dry weight and body length according to Bottrellet al.(1976).
The phytoplankton was quantified according to Utermo¨hl’s method (Utermo¨hl, 1958) under an in-verted microscope. Before counting, the samples were allowed to sediment for 3 h for each centimetre height of the chamber (Margalef, 1983). The individuals (cells, colonies and filaments) were enumerated in random fields as proposed by Uhelinger (1964), with an error smaller than 20%and a confidence interval of
95%(Lund, Kipling & Lecren, 1958). To estimate the
phytoplankton biovolume at least 25 individuals from each species were measured by applying approxima-tions to similar geometric solids (Hillebrand et al., 1999).
Statistical analysis
A two-way repeated measures A N O V AA N O V A, with two
levels of nutrients, two levels of fish and five samples collected in each experimental unit was done to test the separated effects of tilapias (F), nutrients (N), time (t) and the interaction effects among these factors (F·N; t·N; t·F; t·N·F) on total nitrogen and phosphorus concentrations and ratio, on phytoplank-ton biovolume, zooplankphytoplank-ton biomass and water transparency. A two-way A N O V AA N O V A was done to test
for the separated effects of tilapias, nutrients and the interaction effects between these factors (F·N) on the size of zooplankton species on the last week of
the experiment. A pairedt-test was used to compare the tilapia biomass at the beginning and end of the experiment. Prior to analyses, data were log (x+ 1) transformed to stabilise variances. The significance level assumed was a= 0.05. All statistical analyses
were run with S T A T I S T I C AS T A T I S T I C A 7.0 (Statsoft, Inc., Tulsa,
OK, U.S.A.).
Results
Abiotic variables
During the experiment, the average values (±1 SD) of water temperature, pH, electric conductivity and dissolved oxygen were 29.62 (±1.13C), 6.85 (±0.67), 0.085 (±0.002lS cm)1) and 5.81 (±0.68 mg L)1) respec-tively, across the 20 mesocosms. The above variables were not affected by either fish or nutrients addition (data not shown) and are described here just by their overall average and SD. Results from the two-way repeated measures A N O V AA N O V A show that there were
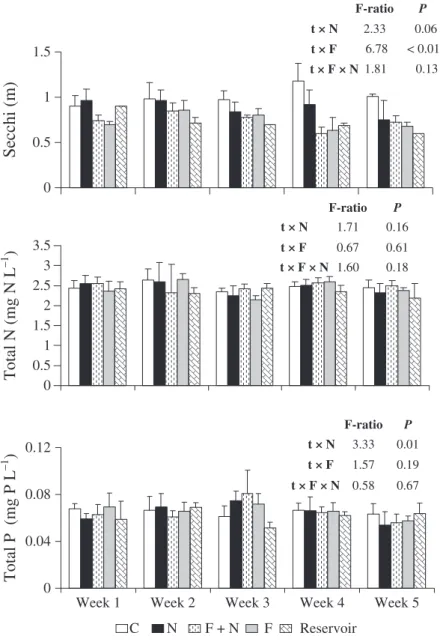
significant effects of nutrients (N) and tilapias (F) and a significant interaction between these factors (F·N) on the water transparency measured by the Secchi depth (Fig. 1). The water transparency was reduced due to tilapia addition independently of the nutrient level while the effect of nutrient addition on water transparency was only evident in the absence of tilapia (Fig. 1). Conversely, no significant effects of nutrients or tilapias nor significant interactions between these factors were found on total nitrogen and phosphorus concentrations and on the ratio between these ele-ments (data not shown). A significant interaction of fish addition with time was found on Secchi depth but not on the concentrations of nutrients (Fig. 2).
Zooplankton biomass
The zooplankton biomass was dominated by calanoid copepods in all treatments as well as in the reservoir and the genus Notodiaptomuscomprised the bulk of the total zooplankton biomass (>75%). The main
rotifer genera were: Brachionus, Trichocerca, Filinia, Hexarthra and Keratella, while the main genera of microcrustaceans (cladocerans and copepods) were: Moina,Ceriodaphnia,Diaphanosoma,Thermocyclopsand the dominantNotodiaptomus.
The two-way repeated measures A N O V AA N O V A results
show that the total biomass of zooplankton and the
37 R. F. Menezeset al.
38 biomass of rotifers, cladocerans, calanoid copepods
and copepod nauplii were negatively affected by tilapias (Fig. 1). The genera responsible for these significant responses were Filinia, Keratella, Moina andNotodiaptomus(data not shown). However, some effects of tilapia on zooplankton biomass were time dependent (Fig. 3). Nutrient enrichment had no significant effect on zooplankton biomass, but there was a significant interaction between the effects of nutrients and tilapias on rotifers (Fig. 1). The biomass of rotifers increased with nutrient addition but only in the absence of tilapia (Fig. 1). The negative effects of tilapia on copepods and cladocerans bio-mass were mediated by a decrease in density, because no difference in the individual mean size of the dominant species was found among the treatments (Fig. 4).
Phytoplankton biovolume
At the beginning of the experiment, the total phyto-plankton biovolume in all mesocosms was dominated
by cyanobacteria and bacillariophyta. The most repre-sentative genera, accounting together for more than 70% of the total phytoplankton biovolume, were
Cylindrospermopsis, Aphanocapsa, Synedra, Aulacoseira, Navicula andMicrasterias. During the experiment, the relative abundance of cyanobacteria (mainly Cylindro-spermopsis) increased in the treatments with tilapias and in the reservoir, while the relative abundance of bacillariophyta increased in the treatments without tilapias (data not shown). Results from the two-way repeated measures A N O V AA N O V A indicate that there were
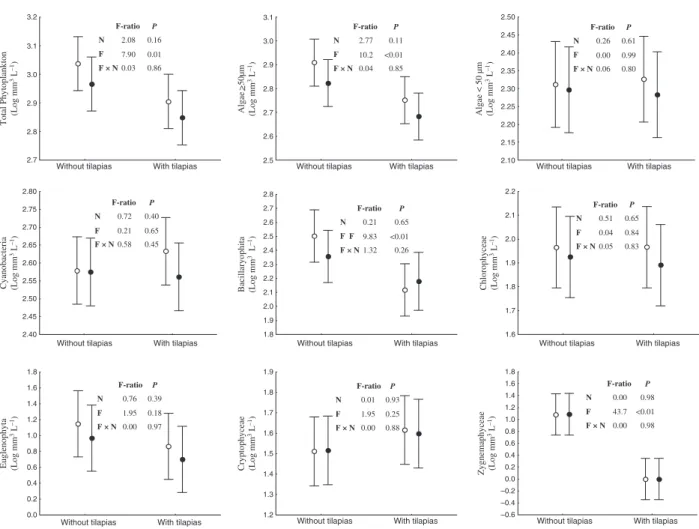
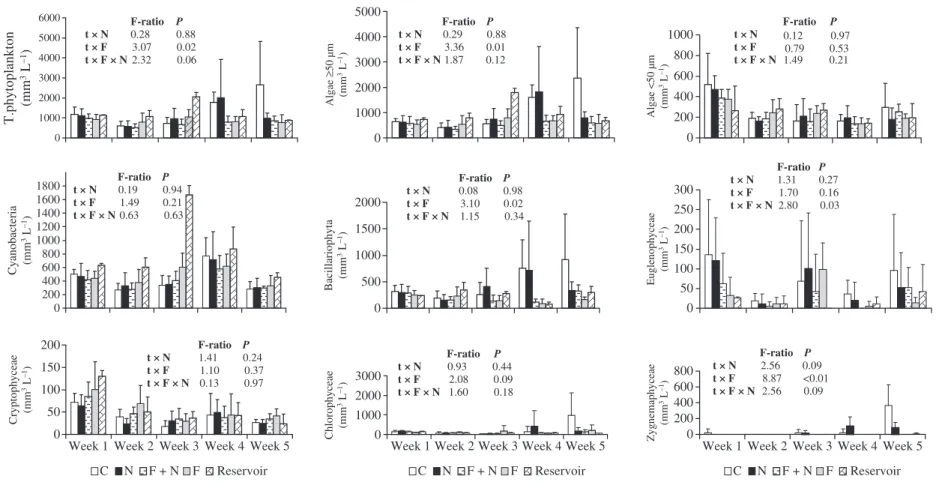
negative effects of tilapia on the total phytoplankton biovolume, on the biovolume of bacillariophyta, zygnemaphyceae and algae with GALD larger than 50lm (Fig. 5), but some of these effects were time dependent (Fig. 6). The genera responsible for these significant responses were mainly Synedra and Micrasterias(data not shown). Conversely, the phyto-plankton biovolume did not respond to nutrient enrichment and there was no interaction between the effects of tilapia and nutrients on phytoplankton (Fig. 5).
Without tilapias With tilapias Without tilapias With tilapias Without tilapias With tilapias
Without tilapias With tilapias Without tilapias With tilapias Without tilapias With tilapias 0.6 0.7 0.8 0.9 1.0 1.1 1.2 Secchi (m) 0.4 0.5 0.6 0.7 0.8 0.9 1.0 1.1 1.2 1.9 2.0 2.1 2.2 2.3 2.4 2.5 2.6 2.7 2.8 2.9 Total zooplankton
(Log µg DW L
–1) 0.2 0.3 0.4 0.5 0.6 0.7 0.8 0.9 1.0 1.1
Cladocerans (Log µg DW L
–1)
Calanoids (Log µg DW L
–1)
Rotifers (Log µg DW L
–1)
Cyclopoids (Log µg DW L
–1) 1.7 1.8 1.9 2.0 2.1 2.2 2.3 2.4 2.5 2.6 2.7 2.8 1.0 1.1 1.2 1.3 1.4 1.5 1.6 F-ratio P N F
F × N
5.18 0.04 65.55 < 0.01 5.97 0.03
F-ratio P
N 1.84 0.19
F 8.45 0.01
F × N 0.26 0.61
F-ratio
N 3.59 0.08
F 30.06 <0.01
F × N 11.40 <0.01
F-ratio
N 1.25 0.28
F 91.86 <0.01
F × N 0.01 0.92
F-ratio
N 1.52 0.23
F 7.81 0.01
F × N 0.34 0.57
F-ratio
3.22 0.09 0.00 0.96
0.09 0.76
P P
P P
N
F
F × N
Fig. 1 Results of two-way repeated measuresA N O V AA N O V A to test for the effects of tilapia (F), nutrients (N) and the interaction among these factors (F·N) on the water transparency, total zooplankton biomass and the biomass of major zooplankton groups
averaged across time. The dots and bars represent the means and standard deviation of treatments with (black) and without (white) nutrient additions. Results shown inside each graph are theF-ratios andP-values of theA N O V AA N O V A. Values were considered significant assuminga= 0.05.
Effects of omnivorous filter-feeding fish
Tilapia biomass
The tilapia biomass significantly increased during the experiment in both the F (t=)6.37; P= 0.0031) and F + N treatments (t=)14.46; P= 0.0001), but no difference was found in the initial (t= 1.8689; P= 0.098) or final (t=)0.2725; P= 0.7921) biomass between the treatments (Fig. 7).
Discussion
Our results indicate that omnivorous filter-feeding fish such as the Nile tilapia can reduce both zooplankton and phytoplankton biomass and still
decrease water transparency through mechanisms other than stimulating algal growth. Instead of indi-rectly enhancing phytoplankton through predation on zooplankton and nutrient excretion, the Nile tilapia reduced the biomass of large algae (GALD >50lm) and total phytoplankton biomass through direct grazing. Therefore, this widespread omnivorous fish can affect plankton communities in a different way than visually feeding zooplanktivorous fish. Conversely, nutrient enrichment did not affect the biomass of zooplankton and phytoplankton or the plankton community structure, with the exception of rotifers that were enhanced by enrichment, but only in the absence of tilapias. Contrary to our expectation,
0 0.04 0.08 0.12
Week 1 Week 2 Week 3 Week 4 Week 5
C N F + N F Reservoir
0 0.5 1 1.5 2 2.5 3 3.5
Total N (mg N L
–1 )
Total P (mg P L
–1 ) 0 0.5 1 1.5 Secchi (m)
F-ratio P
F-ratio P
F-ratio P t × N 2.33 0.06 t × F 6.78 < 0.01 t × F × N 1.81 0.13
t × N
t × F
t × F × N
t × N
t × F
t × F × N
1.71 0.67 1.60 0.18 0.61 0.16 3.33 1.57 0.58 0.67 0.19 0.01
Fig. 2 Average values (±1 SD) of Secchi depth and total nitrogen and phosphorus concentrations in the experimental treatments and in the reservoir at each sampling week. Results shown inside each graph are theF-ratios andP-values of the two-way repeated measuresA N O V AA N O V A
interaction terms with time (t). Values were considered significant assuming
a= 0.05.
39 R. F. Menezeset al.
except for rotifers we found no significant interactions between the effects of tilapia and nutrients on phyto-plankton or zoophyto-plankton, suggesting that their combined effects can be predicted as the sum of their
separate effects. Therefore, the picture that emerges from this experiment is that of a strong effect of fish and a negligible effect of nutrients on the plankton community of this small tropical reservoir. This seems
0 10 20 30 40 50 Rotifers
(µg DW L
–1)
Nauplii
(µg DW L
–1)
Calanoids
(µg DW L
–1)
Cladocerans (µg DW L –1)
Cyclopoids (µg DW L –1)
T.Zooplankton (µg DW L –1) 0 500 1000 1500 2000
Week 1 Week 2 Week 3 Week 4 Week 5 Week 1 Week 2 Week 3 Week 4 Week 5
0 100 200 300 400 500 600 700 0 500 1000 1500 2000
C N F + N F Reservoir
C N F + N F Reservoir
0 5 10 15 20 25 30 35 0 50 100 150 200
t × N 0.29 0.88
t × F 5.97 < 0.01
t × F × N 0.63 0.63
1.10 0.36
2.63 0.04
1.14 0.34
F-ratio P
F-ratio
t × N
t × F
t × F × N F-ratio P
t × N
t × F
t × F × N
F-ratio P
t × N
t × F
t × F × N
F-ratio P
t × N
t × F
t × F × N
F-ratio P 0.72 1.09 2.08 0.09 0.37 0.58 0.86 1.48 1.99 0.10 0.22 0.48 1.43 5.63 0.52 0.71 <0.01 0.23
t × N
t × F
t × F × N
1.08 7.76 0.82 0.51 <0.01 0.37 P
Fig. 3 Average values (±1 SD) of zooplankton biomass in the experimental treatments and in the reservoir at each sampling week. Results shown inside each graph are theF-ratios andP-values of the two-way repeated measuresA N O V AA N O V Ainteraction terms with time (t). Values were considered significant assuminga= 0.05.
0 200 400 600 800 1000 1200
C N F + N F Reservoir
Mean length (µm)
N. cearensis Thermocyclops sp. C. cornuta Moina sp.
Moina sp.
C. cornuta N. Cearensis Thermocyclops sp.
F-ratio N F F × N
0. 00 0. 00 0. 50 0. 93 0. 96 0. 49
P F-ratio
N F F × N
181 1.21 0.87 0.19 0.28 0.36
P F-ratio
N F F × N
1.70 0.30 0.30 0.21 0.59 0.59
P F-ratio
N F F × N
1.11 4.66 0.79 0.31 0.06 0.39 P
Fig. 4 Mean length (±1 SD) of the larger zooplankton taxa in the four experimental treatments and in the reservoir at the end of the experiment. Results shown inside the graph are theF-ratios and
P-values of the two-wayA N O V AA N O V A.
Effects of omnivorous filter-feeding fish
40