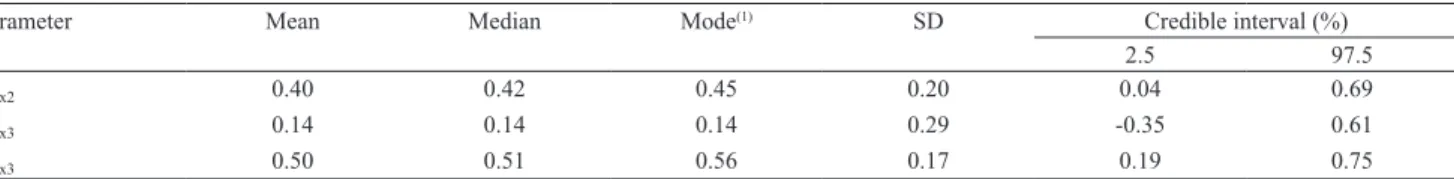
Bayesian genetic parameters for body weight and survival of Nile tilapia farmed in Brazil
Texto
Imagem
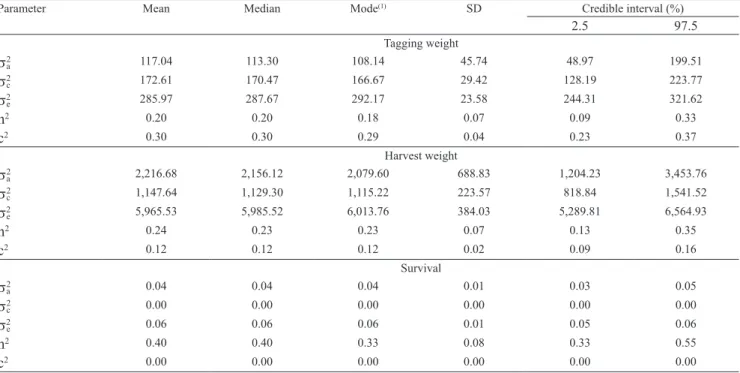
![Figure 1. Marginal posterior distributions of heritabilities [f(h 2 /y)] for: A, tagging weight; B, harvest weight; and C, survival for tilapia farmed in Brazil.](https://thumb-eu.123doks.com/thumbv2/123dok_br/15908606.673069/7.914.474.808.473.985/figure-marginal-posterior-distributions-heritabilities-tagging-harvest-survival.webp)
Documentos relacionados
Ainda que as dimensões da reflexão e do desenvolvimento de competências sejam referenciais aceites à partida por todos os intervenientes na disciplina, é para
Por fim, esse trabalho conclui que houve influência do peso ao nascer, da assistência à saúde no pré-natal e puerpério através da visita do ACS e da introdução precoce de alimentos
Diante disso, a cidade de Araguaína se encontra localizada em uma região que possibilita um amplo fluxo de circulação rodoviária, permitindo um incremento em
837/99 ou NBC T 10.4 (Fundações) já revogada pela ITG 2002, isto é, 5 organizações sem fins lucrativos afirmaram por meio de suas notas explicativas que não seguiram
Katzmair (2018), que mapeou iniciativas, projetos, grupos, pessoas e insti- tuições em 92 países com relação direta a essas práticas, identificou ainda algumas semelhanças
The aims of this study were to 1) determine the descriptor species of the phytoplanktonic community in a fishpond of Nile tilapia ( Oreochromis niloticus ); and 2) to evaluate
Para alcançar este objetivo foram realizadas as seguintes etapas: levantamento bibliográfico sobre a interpretação ambiental em Unidades de Conservação no Brasil e
No caso da primeira experiência, quando os participantes foram questionados sobre qual o sabor que esperavam encontrar para cada cor, verificou-se que vários
