Sovereign Debt with Adverse Selection:
A Quantitative Approach*
Laura Alfaro
*Fabio Kanczuk
***Harvard Business School University of Sao Paulo
August 2002
JEL classification: F340, H630
Key words: sovereign debt, default
Abstract
We construct a dynamic equilibrium model to quantitatively study sovereign debt with
contingent services and country risk spreads such that the benefits of defaulting are tempered by
higher interest rates in the future. For a wide range of parameters, the only equilibrium of the
model is one in which the sovereign defaults in all states, unless defaulting incurs additional
costs. Due to the adverse selection problem, some countries choose to delay default in order to
reduce reputation loss. Although equilibria with no default imply in greater welfare levels, they
are not sustainable in the highly indebted and volatile countries.
1. Introduction
“A loan to a foreign government is an act of faith.” -Herbert Feis (1930)
One of the advantages of integrated global financial markets and international capital
mobility is that it allows resources to be channeled to their most productive uses, thereby
increasing economic growth around the world. Developing countries with little domestic capital,
for example, can borrow to finance investment without sharp increases in national savings rates
or to smooth consumption. 1
Like all lending, foreign loans involve the current provision of credit in return for the
promise to repay certain amount in the future. Lenders, however, need some reassurance that
borrowing countries will repay their debts, an act that depends not just on a sovereign’s ability to
pay but also on her willingness to do so. Being there few direct legal sanctions that can be
invoked against sovereign borrowers, sovereign lending tends to be particularly problematic and
characterized by severe incentive problems derived from the sovereign’s behavior. Indeed, as
Grossman and Van Hyuck (1988) note, the power to abrogate commitment without having to
answer to a higher enforcement authority is the essential characteristic of sovereignty.
Yet, governments still have been able to borrow substantial amounts, and, in many
instances, countries have repudiated their debts. Moreover, sovereign states often are able to
borrow soon after default.2 In order to address this puzzle, economists argue that, with direct
invasion no longer commonly used, other threats and punishments such as interruption of foreign
lending and trade, can be evoked to enforce repayment of a sovereign’s debt. Default, in the
extreme, brings a permanent denial of capital market access. But at least some sovereign
borrowing could be supported by more limited penalties, such as a temporary capital market ban
or future higher interest rates. Theoretically, these threats can enforce contract obligations.
Empirically, however, the severity of punishment needed to sustain sovereign lending has yet to
be determined. This paper addresses this empirical question.
We construct and calibrate a dynamic equilibrium model to quantitatively study
sovereign default.3 We quantify the punishment costs necessary to sustain positive debts in a
signaling model with different types of governments, contingent services, and country risk
spreads where the benefits of defaulting are tempered by higher interest rates in the future. We
1
See Obstfeld (1998). 2
For an overview of major debt crises and stylized facts see Eichengreen and Portes (1986, 1989), Eichengreen and Lindert (1991), Cohen (1992) and Eaton and Fernandez (1995).
3
find that additional output costs of defaulting are required to obtain equilibria that resemble the
data where large amounts of lending are consistent with partia l defaults during “sufficiently bad”
states of nature.
In fact, these additional costs have been an important characteristic of debt crisis. As was
made clear by the 1980s experience with sovereign debt–as well as previous crises such as those
in 1870s, 1890s and 1930s– managing the debt crisis turned out to be a difficult process which led
led to economic uncertainty and stagnation in much of the developing world.
During the last 20 years the importance of the reoccurring phenomenon of debt default
has prompted an enormous volume of theoretical and empirical literature on sovereign debt.4
Initially, most of this research focused on why countries ever chose to pay their debts puzzled by
the fact that few direct legal sanctions can be used against sovereign borrowers. Eaton and
Gersovitz (1981) argue that sovereign countries might repay their debts because they would
otherwise develop a reputation for defaulting and thereby lose access to international capital
markets. Bulow and Rogoff (1989) challenged this explanation showing that for reputation to
enforce contracts the debtor country would have to be excluded from all international markets
including those that allow the sovereign country to sell financial assets such as stocks, bonds, and
insurance contracts. Subsequently, Cole and Kehoe (1995, 1998) showed that the ability of
reputation to support debt depends on the alternatives open to the country, its relationships in the
international arena, and assumptions made about institutions.
In light of the stylized facts, Grossman and Van Huyck (1988) interpret sovereign debts
as contingent claims. In their view, lenders sharply differentiate excusable defaults, which are
justifiable when associated with implicitly understood contingencies, from debt repudiation,
which would be inexcusable.5 Creditors would impose sanctions only if a country’s net payment
were below the foreseen state-contingent outcome of the renegotiation. In related work, but
focusing on incentives to repay a debt after defaulting, Cole, Dow and English (1995) developed
a model of sovereign debt whereby defaulting countries were excluded from capital markets and
regained access by making partial repayments. They model two unobservable types of
government, one more myopic than the other. The less myopic government signaled its type by
making a payment. If it paid enough to distinguish itself, it regained access to the loan market.
forces involved in economic processes. See Cole and Kehoe (1996), Kehoe and Perri (2001) and the literature reviewed in Lingquist and Sargent (2000).
4
For surveys of the literature see Eaton and Fernandez (1995) and Kletzer (1994). 5
Similarly to these latter two contributions, we study an economy where default is partial,
and the sovereign signals its type. But, we assume defaulting countries to be penalized with
higher interest rates where spread hikes reflect the country risk, which is a more general
interpretation of an international market shut down. As we observed above, the permanent
exclusion from credit as a way to enforce a sovereign’s debts does not seem a valid assumption
given stylized facts; neither is the use of direct sanctions. Moreover, spread hikes are broadly
consistent with the data as shown by Eichengreen and Portes (1989) and Ozler (1993), among
others.6 Their work suggests that lenders base their country risk assessment on past debt-servicing
behavior as well as newer information.
In our model, since the punishment is not permanent exclusion from international
markets, full default no longer is an optimal strategy. Furthermore, in line with Grossman and
Van Huyck (1988), the equilibrium path displays (partial) defaults that should be interpreted as
excusable in an implicit contingent service contract. Debt provides a sovereign a way to smooth
consumption. A sovereign’s incentive to default, which implies higher current consumption, is
tempered by loss of reputation. Failure to properly manage debt and a country’s subsequent loss
of reputation leads to higher future interest rates and lower future consumption levels. Because
lenders seldom have complete information about the sovereign, they must signal extract their type
from the occurrence (or not) of default.
We find that for a wide range of parameters, the only equilibrium of the model is one in
which the sovereign defaults in all states. This is not a reincarnation of Bulow and Rogoff´s
(1989) result: Grossman and Han (1999) observe that a contingent service scheme such as ours
can support reputational equilibrium even if a borrower can save after defaulting.7 Rather, our
result is a quantitative one: for our calibrated economy the value of debt is not sustainable.
However, when defaulting incurs additional output costs, our economy displays equilibria that
very much resemble the data.8 Although these additional output declines are well documented
(see, for example, Cohen (1992) and Barro (2001)), their micro-foundation remains to be
have shown that payments may be rescheduled, renegotiated or even changed unilaterally if the borrower’s economy falters and lenders have the option to make new loans or cut off existing credit lines.
6 Looking at data on bond flotations in the 1920s, Eichengreen and Portes (1989) find that investors dis criminated borrowers according to their past repayment record. Ozler (1993) finds that countries with histories of repayment difficulties were charged higher interest rates than countries with no repayment difficulty. However, this is not the only view prevailing in the literature. Jorgensen and Sachs (1989) and Eichengreen and Lindert (1991) present evidence that international markets shut down during crisis periods and that there is a general cutoff of lending to both “well-behaved and bad-behaved” borrowers.
7
See Section 5. 8
understood.9 This paper does not further this quest, but suggests that the existence of these costs
seems to be an important determinant behind sovereign debt sustainability.
A qualitative novelty of some of our equilibria is what we call “muddling through”
behavior. A commonly observed feature of the process of defaulting is delay, which tends to
exacerbate recession. For example, since 1997 the Argentinean economy was hit by a series of
negative shocks resulting in a protracted recession and high interest rates due to widespread
rumors of inability to service their debt. Eventually, but only in November 2001, the authorities
began a process of renegotiating and rescheduling debt with major creditors. Similarly, in the
1980s, Mexico transferred more than 3% of GDP between 1983 and 1986 before gaining some
reduction in the debt burden in 1989. Our view is that a “good” sovereign needs to show that it
really wants to repay debt in order to differentiate itself from a “bad” sovereign. To signal its
type, a government must endure a recession, which could be attributed in part to the high interest
rates associated with the higher default risk after that follows the negative shock and in part to the
high uncertainty that seems to accompany these events. By signaling its type, a good sovereign
can reduce the reputation loss associated with defaulting, which leads to lower future borrowing
interest rates.
We also find that the equilibrium in which there is no default for all states imply greater
welfare, despite providing less consumption smoothing. This result is due to the additional output
costs of defaulting, which are magnified by the adverse selection problem. A natural question
then is why we observe defaults so often. Our experiments suggest that countries with high debt
levels and/or high GDP volatilities cannot support this equilibrium and must therefore resort to
equilibria with state-contingent default.
The rest of the paper is organized as follows. The model is developed in section 2.
Section 3 presents the computational implementation and equilibrium. Section 4 defines the data
and calibration. The results are discussed in section 5. Section 6 concludes.
2. Model
Our economy is populated by a sovereign country that borrows funds from a continuum
of risk neutral investors. The borrowing country’s type evolves over time. The country can be one
fifteen years. Dooley (2000) theoretically explores whether the threat of substantial and protacted output losses following debt default is the dominant incentive for debt repayment.
9
of two types, “good” or “bad,” a condition that reflects its impatience. “Bad” countries are
extremely impatient and choose to default at any time independently of the state of the economy.
2. 1. The Borrowing Country
We assume that the borrowing country produce in each period a single good that is either
consumed or saved as capital. Production, which uses capital and inelastically supplied labor, is
subject to technological shocks. Additionally, the country borrows funds from investors.
Following Grossman and Van Huyck (1988), we consider a case in which levels of capital and
debt are fixed. We later discuss the implications of this assumption.10 Under this simplifying
scenario, the country’s only choice is whether or not to default.
The country budget constraint is given by
exp[ ( )] (1 )(1 )
t t t t t
c +δk− =b z −λ r−ρ kα − −θ +r b (1) where ct is consumption, δ is the depreciation rate, α is the capital share, k is the (constant) capital
level, δk stands for the investment, b is the (constant) debt level, zt is the technology coefficient, λ
≥ 0 is an exogenous parameter, rt is the (contractual) interest rate on the debt, ρ is the riskless
interest rate, and θt is the default rate.
We assume θt can take only two values, θt∈ {0, τ}, where τ ∈ [0, 1], which correspond
to the cases of not defaulting and defaulting. The technology coefficient, zt, can take a finite
number of values and evolves over time according to a Markov transition matrix with elements
π(zi , zj). That is, the probability that zt +1 = zj given that zt = zi is given by the matrix πelement of
row i and column j.
The term λ(rt - ρ) is a departure from standard open economy modeling meant to capture
the output reduction due to contractual interest rate increases that have been documented in the
literature. We add this term to consider the possibility that default causes an additional drop in
output through its consequential interest rate boost.11 Among others, Cohen (1992), in the context
of the 1980s debt crisis, and Barro (2001) in the context of the 1997 Asian crises, found an output
drop due to financial crises even when controlling by the investment rate. This crisis effect was
significant, corresponding to an output drop of about two percent per year. As Calvo (2000) puts
it, the literature has not yet paid sufficient attention to this stylized fact. He advances some
explanations based on either the halting of investment in a time to build model or a credit crunch
10
As Grossman and Van Huyck (1988) note, this setup simplifies the analysis without sacrificing qualitative generality. In addition, it greatly reduces the calculation burden thus allowing to compute the equilibrium. 11
amplified by a financial accelerator. The term λ(rt - ρ) in the productivity factor, which captures
this stylized fact, should be seen as a shortcut that deserves further study. Of course, we do
experiment with cases for which λ = 0, where this effect is absent. But, as we later argue, positive
values for λ seem to be an important factor for the quantitative nature of the equilibria.
The sovereign’s preferences are given by
0
( )
t t t
U
E
β
u c
∞ =
=
∑
with, 11
( )
(1
)
c
u c
σσ
−−
=
−
(2)where σ > 0. The two types of countries differ in the parameter β. For the “good” sovereign, β∈
(0, 1), for the “bad,” β = 0. A direct consequence of this assumption is that the “bad” type always defaults.12
As in Cole and Kehoe (1995, 1998) and Cole, Dow and English (1995), the sovereign
type evolves according to a Markov process (of common knowledge) with the transition
probabilities given by:
1 1 g g b b ψ ψ ψ ψ − −
That is, a “good” type at t remains a good type at (t + 1) with probability ψg, and
transitions to a bad type with probability (1- ψg). Similarly, a “bad” type at t remains a bad type
at (t + 1) with probability (1-ψb) and transitions to a “good” type with probability ψb. For this
process to display persistence, we assume ψg + (1 - ψb) > 1.
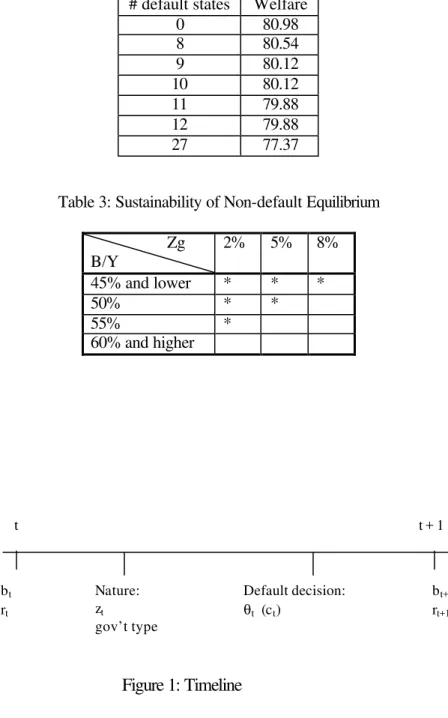
In each period the timing is as follows (see Figure 1). At the beginning of period t, the
country inherits a debt amount equal to b, which bears an interest rate rt. Then nature reveals the
government type and the technology shock. After observing the realization of output, the
government decides whether to default or not, θt, and, consequently, how much to consume, ct.
Based on this decision, lenders update their information about the sovereign’s type and decide
how much to charge for the next period debt, rt + 1.
Consider a good sovereign that chooses to default. If she defaults, choosing θt = τ,
expression (1) indicates that the country will enjoy a higher consumption level today, ct. This
decision might affect the future interest rate lenders charge and, thus, future consumption. Indeed,
12
lenders, when extracting the information from the default in order to set the next period’s interest
rate, most likely will consider the possibility that this period sovereign was of the “bad” type.
This, in turn, implies a higher probability that the sovereign country also will be of the “bad” type
next period. Consequently, the lender chooses to charge a higher interest rate. As a consequence
of defaulting, a good type will have higher consumption today in exchange for lower
consumption during the next period. Following the usual assumptions regarding utility functions,
borrowing countries’ welfare is higher for smoother consumption profiles. Thus, default is a more
likely outcome when the state of the economy is such that, for a constant θ, the sovereign’s
consumption today is lower than her expected consumption in the future.
2.2. The Lenders
Investors are risk neutral and have an opportunity cost of funds given by ρt, which
denotes the risk-free rate. As previously mentioned, we assume that lenders cannot directly
observe the government’s type. The investors’ action is to choose the lending rate rt, which
depends on the perceived likelihood of default.
We find it convenient to express the lenders’ information about the likelihood of default
by defining two probabilities, pt and qt. Let pt
∈
[0,1] be the probability that the sovereign inperiod t, at the time of choosing whether or not to default, is of the “good” type. Let qt
∈
[0,1] bethe probability that a sovereign given that she is of the “good” type will default at t. The
perceived probability of default at t is given by 1 – pt (1 – qt).
For lenders to be indifferent between a riskless asset and lending to a country, it must be
that 1+ =ρ pt(1−qt) 1
(
+rt)
+ −[
1 pt(1−qt) 1]
(
+rt)(
1−τ)
, which implies that the interest rate is given by1
+ = +
r
t(1
ρ
)/[1
−
τ
(1
−
p
t(1
−
q
t))]
(3)3. Computational Implementation and Equilibrium
The model described is a stochastic dynamic game. We analyze a subset of the Markov
perfect equilibrium, which we discuss next. We start by defining the state of the economy at
period t as the ordered set (zt – 1, zt, pt), and the excusable default set, D, as
D = {(z-1 z, p) such that lenders believe that the good type will default}
where, for any period, z-1 denotes the technology in the previous period, and z and p denote,
respectively, this period technology and the period lenders’ assessment of the probability that the
sovereign is of the good type. The excusable default set, part of the lender’s strategy, corresponds
to all states of the economy in which lenders believe that the sovereign will default. In Grossman
and Van Huyck’s (1988) language, D corresponds to the states of the economy in which defaults
are excusable.
Given D, we can write the lenders’ future probabilities assessments as a function of the
state and of the sovereign’s action as
pt + 1 = ψg , if θt = 0, (4a)
pt + 1 = ψb , if θt = τ and (zt – 1, zt, pt) ∉D, (4b)
pt + 1 = ptψg + (1 – pt)ψb , otherwise (4c)
which corresponds to simple Bayesian updating, and
1 1
1 1
( , , )
(
, )
t t t
t t t
z z p D
q
π
z
z
+ +
+ +
∈
=
∑
(5)which comes straight from the definition of the excusable default set.
Notice that the lender’s strategy is completely determined by the set D and the
expressions (3), (4), and (5). As a consequence, given D, we can write the sovereign’s problem as
1 1 1
(
t,
t,
t)
t{ ( )
t( ,
t t t)}
V z
−z p
=
Max
θu c
+
β
EV z z
+p
+ (6)such that (1), (2), (3), (4), and (5) hold.
Now we are ready for the definition of equilibrium.
A Markov perfect equilibrium is an excusable default set D, a value function V, and a
policy function θ such that, given D, θ is a solution for the problem (6), and
θ (z-1, z, p) =τ , for all (z-1, z, p) ∈ D, and θ (z-1, z, p) =0 , otherwise.
Although in a slightly different format much in line with one of “recursive competitive
equilibrium,” this definition is not different from the usual Markov perfect equilibrium definition.
Given the lender’s strategy (the set D and the expressions for p, q, and r) and the state, the
sovereign maximizes her utility. Given the sovereign strategy (θ) and the state, the investors are
indifferent between lending to the sovereign and earning the riskless rate, hence their strategy is
also optimal.
Because of too many Markov perfect equilibria, which imply huge computational costs,
A Markov perfect equilibrium is an engulfing equilibrium if (z-1, z, p) ∈ D implies that
(z’-1, z’ , p’ ) ∈ D for any z’-1≤ z-1, z’ ≤ z and p’ ≤ p. This definition says that a sovereign that in
equilibrium defaults for a given state would also default in any other state that has a lower z-1,
and/or a lower z, and/or a lower p.
Our intuition to look only at these equilibria is driven by the following observations: (i)
higher z, the smaller should be the consumption smoothing gains from defaulting (since a higher
technology coefficient implies a lower marginal utility of consumption today and, possibly,
smaller expected future marginal utility); (ii) the higher p, the lower today’s consumption gains
from defaulting (interest rates are lower for higher p) and, possibly, more severe future
punishments for defaulting (if p was already low it could not be reduced, but if it was high it
could); (iii) the higher z-1, the lower today’s consumption gains from defaulting (lower interest
rates given the observation (i)). We do not offer any proof that Markov equilibria are also
engulfing; in fact, we believe there is no such proof. However, we consider that the engulfing
equilibria are more relevant or at least more interesting to observe.
For our calibration, with three possible technology (z) and probability (p) levels, to look
for a Markov perfect equilibrium implies checking for 227 possible equilibria. That should take, in
our Pentium III, about five years. In contrast, for the same calibration it takes less than three
hours when we look for engulfing equilibria only. Interestingly, when we worked with smaller
state spaces, all the Markov equilibria we found were also engulfing equilibria. We, nevertheless
do not believe there exists any proof that, in our environment, all Markov are also engulfing
equilibria.
4. Data and Calibration
We calibrated our model so that each period corresponds to one year. We used the data
related to the indebted countries during the crises of the 1930s, 1980s, and 1990s.
Following the Real Business Cycle literature, we can calibrate the parameters of the
technology and preferences as ρ = 0.05 (which implies β = 0.95), σ = 1.5, δ = 0.05 and α =
0.4.13 The capital level k is chosen so that the capital-output ratio is equal to three, a typical value
in Latin American countries.
For virtually all the remaining parameters we perform some robustness tests,
experimenting with many possible values. Our benchmark parameters and the relevant ranges are
obtained by averaging the available data for most indebted countries cited in the following
13
studies: for the crisis of the 1930s the main reference is Eichengreen and Lindert (1989); for the
1980s Cohen (1992); and for the Mexico crisis in 1995 Eichengreen and Mody (1998).
For the technology coefficient z we adopted three possible levels that corresponded to
“good,” “regular,” and “bad times,” zg, zr, and zb,respectively. We first attempted to use four
possible levels, but the computational costs were too high. For the “regular” times we choose zr =
0. The “bad” times were calibrated by looking at the GDP drops during a crisis, about 5%, and
we set zb = .95. We chose the good times to be symmetrical with the bad times, that is, zg = .05.
We also experimented with zb =.98 and zb = .92 (with symmetrical values for zg).
The frequency of this state (π) is chosen such that (i) it is impossible to go straight from
bad to good times (and vice-versa) (ii) the duration of good and bad times is two years and of
regular times ten years, which is consistent with the stylized facts of the last 20 years; and (iii)
good and bad times occur on average once every 20 years. Together, these hypotheses uniquely
determine the transition of technology to be:
.5
.5
0
.05 .90 .05
.5
.5
0
π
=
The debt level b is chosen so that debt is equal to 50% of GDP during regular times,
which reflects the situation in most countries studied. We tried b equal to 100% of GDP as well.
For the transition probabilities of government type (which is empirically unobservable ),
we chose ψg = .9 and ψb =.1 as a benchmark. Recall that the further apart these parameters are
more severe the punishments for defaulting. As we discuss later in this section, our calibration
exercises reveal this punishment, however, to be too small to sustain positive amounts of debt.
We further find that this result persists even as ψg takes values closer to one and ψb values closer
to zero.
For computational reasons we restrict p to only three values (which correspond to ψg, ψb,
and their average). These three levels, nevertheless, allow for interesting updating dynamics. For
example, the punishment for defaulting in a state in which a sovereign is expected to default (an
“excusable default” in the language of Grossman and Van Huyck) is different from that for
defaulting in a state in which the sovereign is not expected to default (a debt “repudiation”).
The parameter τ, which reflects the default rate, is difficult to calibrate given the
complexity of information in each debt renegotiation. Some researchers attempt to calculate how
much is paid by calculating the ratio of the present value of the payments corrected by the Libor
defaulted about 35% of their debt during the 1930s. Cohen (1992) found that in the 1980s, when
the residual debt at the secondary markets is considered, the default is almost null, that is, debtor
countries paid roughly a return of close to the Libor rate over their debts.14 Bulow (1992)
calculates that, if one considers that investors hedged against the dollar depreciation, the defaults
in the 1980s amount to about 30%. To match these observations we use as our benchmark τ =
20%, which corresponds roughly to Cohen’s calculations, but also experiment with τ = 10% and
τ = 30%.
Finally, for the parameter λ, which corresponds approximately to the output elasticity to
the contractual interest rates, we use as a benchmark λ = 0, which corresponds to no output drop.
We also experiment with higher values: λ = 5%, λ = 10%, λ = 15% and λ = 20%. For example,
note that an interest rate premium of 20% with a value of λ= 25% implies an additional output
drop of about 5%. This is inline with the stylized facts captured by Cohen (1992).
5. Results
5.1. Number of Equilibria
Our model is set up so that for any parameter there is always an equilibrium that
corresponds to a case in which the sovereign defaults for all the possible states. To observe that,
consider that the excusable default set D contains all the possible states. Then, from expression
(5), one sees that q = 1, and from expression (2), that
1
+ = +
r
t(1
ρ
)/(1
−
τ
)
, for all states. Theseexpressions indicate that punishment is independent of what a sovereign does or, better, that
investors are not drawing any information from a sovereign’s actions. Consequently, the
sovereign has no incentive not to default and chooses to default in any state. This strategy
validates the equilibrium.
This trivial equilibrium of “defaulting in all states” does not, however, seem to
correspond to countries’ actual behavior because we do observe positive debt levels. Hence, we
decided to focus only on the other equilibria. It turns out that, for our benchmark economy, these
other equilibria do not exist. Perhaps surprisingly, the same is true for a wide range of parameters.
Table 1 reproduces the grid of the parameters we tried and the number of equilibria other than the
trivial one obtained. Notice that for all ranges of the other parameters, λ = 0 and λ = 0.5% imply
that the only equilibrium is the trivial one.
14
This result, again, is not a reincarnation of Bulow and Rogoff’s (1989) theorem. In an
environment such as ours, in which the sovereign can save after defaulting, Grossman and Han
(1999) proved there to be positive amount of sustainable debt. Contingent debt servicing permits
more consumption smoothing than would solely saving and dissaving and thus, the sovereign will
resist the temptation to repudiate its debt.. Our result is rather a quantitative one: for our economy
the calibrated value of debt is not sustainable if we assume low λ values.
It is important to question how robust this finding is to our simplifying assumptions. In
particular, one could ask if the nonexistence of non-trivial equilibria (for the case λ= 0) is robust
to the assumption that b is constant. The answer to this question is affirmative, as shown by
Grossman and Han (1999). Saving and disaving cannot support debt in an economy in which the
sovereign can save after defaulting, which would be the case if b were not constant.
Table 1 shows, then, that positive values for λ and thus and additional cost of defaulting,
which have been documented consistently in defaulting episodes, are an important factor for the
qualitative nature of the equilibria.
5.2. Outcome Characteristics and Muddling Through
In this section we choose a set of parameters that implies a rich set of equilibria. In
particular, we select the case λ = 0.2, τ =20%, B/Y = 50% and zg = 5%, which has six non-trivial
equilibria. Of these, we describe in detail what we call the “muddling through” equilibrium,
which presents interesting characteristics that seem to match the experience of a number of
developing countries.
Figures 2a to 2f describe what happens in a country that initially experiences a sequence
of good technology shocks, then endures a crisis, and finally recovers. Figure 2a reflects this
choice of the technological shocks; the remaining figures are endogenously determined.
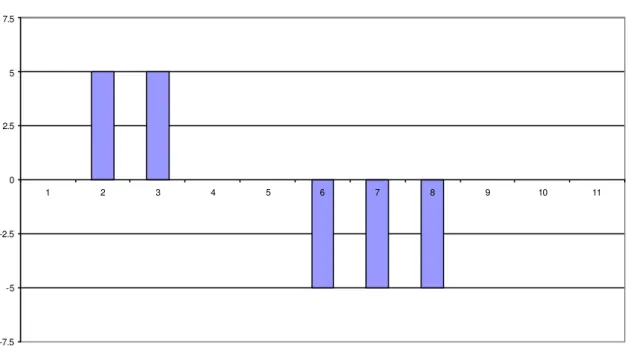
Figure 2b describes the occurrence of default. Notice that default occurs in periods 7, 8,
and 9, whereas bad technology shocks occur in periods 6, 7, and 8. This means that the sovereign
decided to “wait to default” or, more precisely, not to default right after a bad shock, a behavior
that we call muddling through. The reason, as we mentioned, is that the sovereign would have
been punished harshly for defaulting in period 6, since the situation would not have been
perceived sufficiently “bad” by the lender as to warrant default.15 Instead, in period 7, after a
sequence of (two) bad shocks, the situation is considered bad enough to diminish the optimal
punishment for defaulting. Notice that even though the technology shock has recovered in period
15
9, the sovereign still decides to default in this period, because the punishment for defaulting is too
small, the sovereign chooses to halt debt services for another period.
Figure 2c describes the lender’s assessment of the probability that the sovereign is of the
good type. Note, in particular, that in period 8, after the default has occurred, the probability has
not yet dropped to its lowest level. During this period the sovereign was, in a sense, allowed to
default. Figure 2d depicts the contractual interest rate. In good periods its value is slightly higher
than the risk-free rate (5%) due to some probability that the sovereign might “become” the bad
type. It escalates during the crisis to values greater than 30%, then, soon after the crisis, returns to
its original value in line with the stylized facts.
Figure 2e describes the country’s output. As expected, this figure is similar to figure 2a,
the difference corresponding to the linkage between interest rates and output. In the crisis, this
difference rises to 2.5%, an extremely relevant amount, but in line with the values obtained, for
example, by Cohen (1992). Finally, Figure 2f shows the debt services paid by the sovereign.
Notice that in period 7, when default occurs for the first time, debt services are significantly
negative because the sovereign is still able to sell new bonds. Due to higher (effective) interest
rates, this benefit evaporates during the crisis period. In period 11, the sovereign decides not to
default, service payments are extremely elevated because contractual rates are still very high. In a
sense, these huge services are the amount that must be paid to restore the sovereign’s reputation.
5.3. Welfare and Sustainability
To analyze the welfare consequences of different implicit contracts we obtain the
invariant distribution of the occurrence of the possible 27 states and average their pay-offs. As in
the previous section, we arbitrarily chose the parameter values λ = 0.2, τ =20%, B/Y = 50% and
zg = 5%.
We depict the welfare for each of the equilibria in table 2. We also report in the same
table the number of states in which there is default.
The simple conclusion to be drawn is that equilibria that correspond to implicit contracts
that have more defaulting states have lower welfare. The reason for this stems from our additional
output-cost and adverse selection assumptions. Because lenders cannot perfectly observe the
sovereign type they charge higher interest rates to defaulting countries, which implies lower
welfare. If the implicit contract has more defaulting states, this imperfect information cost might
occur more often. Hence, these contracts are associated with lower welfare. Moreover, for every
In this model, as in any repeated game, one lacks a good way to choose among the many
possible equilibria. However, with this caveat in mind, we ask: given λ and τ, what is the set of
parameter values for B/Y and zgfor which the equilibrium with no default exists?
Table 3 depicts the parameter values of B/Y and zggiven λ = 0.2, τ =20%, for which the
equilibrium with no default exists.16 The lesson from Table 3 is that the equilibrium with no
default exists for lower levels of debt (B/Y) and lower magnitudes of technology shocks (zg). The
intuition is fairly simple. In our economy with contingent debt service, when debt is higher and/or
output oscillates a lot, the benefits of defaulting increase. In these cases it is harder to sustain an
equilibrium in which the sovereign always chooses not to default.
Interestingly, the results depicted in Tables 2 and 3 seem to be consistent with casual
observation of cross-country experiences. Developed countries, which tend to have lower volatile
technology and lower (or negative) debt-to-GDP ratios, tend never to default on their debt. In
contrast, developing countries hold debt, which, as an “implicit contract,” includes states with
excusable defaults. Although, due to information asymmetries, excusable defaults imply lower
welfare levels, the combination of high volatility and high debt levels supports only this form of
debt contract.
6. Conclusions
In this paper we studied sovereign debt default using the methodology of simulating a
calibrated artificial economy. We found that additional output costs of defaulting are required to
obtain equilibria that resemble the data whereby large amounts of lending are consistent with
partial defaults during “sufficiently bad” states of nature.
Some equilibria exhibit what we call “muddling through” behavior: the sovereign, to
signal being of the “good” type, does not default after a bad shock. Only when the situation is
considered sufficiently bad and the penalty for defaulting diminishes does the sovereign default.
We believe that these equilibria mimic defaulting episodes such as the one that occurred in
Argentina in 2001 when authorities endured a long recession before suspending external
payments.
Although we also found welfare to be higher in equilibria for which there is never
default, these equilibria arise only in economies with small amounts of debt and/or with low
output volatilities. In this sense, it is likely that less developed countries, because they tend to be
7. References
Barro, Robert (2001). “Economic Growth in East Asia Before and After the Financial Crisis,”
NBER Working Paper, No.8330.
Bulow, Jeremy; Rogoff, Kenneth. (1989) “Sovereign Debt: Is to Forgive to Forget?” American
Economic Review. Vol. 79 (1): 43-50.
Bulow, Jeremy. (1992) Comment to “The Debt Crisis: A Postmortem” by Daniel Cohen. NBER
Macroeconomics Annual, edited by Oliver Blanchard and Stanley Fischer, Stanley, Cambridge and London: MIT Press. p 65-105.
Calvo, Guillermo. (2000) “Balance of Payments Crises in Emerging Markets: Large Capital
Inflows and Sovereign Governments” in Currency Crises edited by Paul Krugman.
Chicago: The University of Chicago Press.
Cohen, Daniel. (1992) “The Debt Crisis: A Postmortem.” NBER Macroeconomics Annual, edited
by Oliver Blanchard and Stanley Fischer, Stanley, Cambridge and London: MIT Press:
65-105.
Cole, Harold L.; Kehoe, Patrick J. (1998) “Models of Sovereign Debt: Partial versus General
Reputations.” International Economic Review. Vol. 39 (1): 55-70.
Cole, Harold L.; Kehoe, Patrick J. (1995) “The Role of Institutions in Reputation Models of
Sovereign Debt.” Journal of Monetary Economics. Vol. 35 (1): 45-64.
Cole, Harold L.; Timothy Kehoe. (1996) “A Self Fulfilling Model of Mexico’s 1994-1995 Debt
Crisis,” Journal of International Economics. 41(3/4): 309-330.
Cole, Harold L, Dow, James, English, William B. (1995) “Default, Settlement, and Signaling:
Lending Resumption in a Reputational Model of Sovereign Debt.” International
Economic Review Vol. 36 (2):365-85.
Cooley, Thomas F. ed. (1995) Frontiers of Business Cycles, Princeton: Princeton University
Press.
Dooley, Michael (2000) “Can Output Losses Following International Financial Crises be
Avoided?” NBER Working Paper W7531.
Eaton, Jonathan; Gersovitz, Mark. (1981) “Debt with Potential Repudiation: Theoretical and
Empirical Analysis.” The Review of Economic Studies. Vol. 48 (2): 289-309.
Eaton, Jonathan; Fernandez, Raquel. (1995) “Sovereign Debt,” Handbook of International
Economic, Vol. 3, edited by Gene Grossman and Kenneth Rogoff. Amsterdam, New York and Oxford: Elsevier, North-Holland. p 2031-77.
16
Eichengreen, Barry; Portes, Richard. (1986) “Debt and Default in the 1930s: Causes and
Consequences.” European Economic Review. Vol. 30 (3):599-640.
Eichengreen, Barry; Portes, Richard. (1989) “After the Deluge: Default, Negotiation and
Readjustment during the Interwar Years,” in The International Debt Crisis in Historical
perspective, edited by B. Eichengreen and P. H. Lindert, , Cambridge, Mass MIT Press.
Eichengreen Barry; and P. H. Lindert. (1989) “Introduction,” in The International Debt Crisis in
HistoricalPerspective, edited by B. Eichengreen and P. H. Lindert, Cambridge, Mass.: MIT Press.
Eichengreen, Barry; Mody, Ashoka. (1998) “What Explains Changing Spreads on
Emerging-Market Debt: Fundamentals or Emerging-Market Sentiment?” National Bureau of Economic
Research Working Paper 6408.
Grossman, Herschel I.; Van Huyck, John B. (1988) “Sovereign Debt as a Contingent Claim:
Excusable Default, Repudiation, and Reputation.” American Economic Review. Vol. 78
(5):1088-1097.
Grossman, Herschel I.; Han, Taejoon. (1999) “Sovereign Debt and Consumption Smoothing.”
Journal ofMonetary Economics Vol. 44 (1):149-58.
Jorgensen, Erika; Sachs, Jeffrey. (1989) “Default and Renegotiation of Latin American Foreign
bonds in the Interwar Period.” in The International Debt Crisis in Historical Perspective,
edited by B. Eichengreen and P. H. Lindert. Cambridge, Mass: MIT Press.
Kehoe, Patrick; Perri, Fabrizio. (2000) “International Business Cycles With Endogenous
Incomplete Markets.” Federal Reserve Bank of Minneapolis Staff Report: 265.
Kletzer, M. Kenneth. (1994) “Sovereign Immunity and International Lending,” The Handbook of
International Macroeconomics, edited by Frederick van der Ploeg. U.K.: Basil Blackwell Publisher.
Lingquist, Lars; Sargent, Thomas. (2000) Recursive Macroeconomic Theory. Cambridge, Mass.:
MIT Press.
Rose, Andrew. (2002) “One Reason Countries Pay their Debts: Renegotiation and International
trade,” NBER Working Paper 8853, March.
Obstfeld, Maurice. (1998) “The Global Capital Market: Benefactor or Menace?” Journal of
Economic Perspectives. 12-4: 9-30.
Obsteld, Maurice; Rogoff, Kenneth. (1996) Foundations of International Macroeconomics,
Cambridge, Mass.: MIT Press.
Ozler, Sule. (1993) “Have Commercial Banks Ignored History?” American Economic
Table I: Number of Non-trivial Equilibria
λ τ B/Y Zg # equil λ τ B/Y Zg # equil
0 .1 .5 .2 0 .10 .2 1 .2 0
0 .1 .5 .5 0 .10 .2 1 .5 0
0 .1 .5 .8 0 .10 .2 1 .8 0
0 .1 1 .2 0 .10 .3 .5 .2 6
0 .1 1 .5 0 .10 .3 .5 .5 2
0 .1 1 .8 0 .10 .3 .5 .8 0
0 .2 .5 .2 0 .10 .3 1 .2 0
0 .2 .5 .5 0 .10 .3 1 .5 0
0 .2 .5 .8 0 .10 .3 1 .8 0
0 .2 1 .2 0 .15 .1 .5 .2 0
0 .2 1 .5 0 .15 .1 .5 .5 0
0 .2 1 .8 0 .15 .1 .5 .8 0
0 .3 .5 .2 0 .15 .1 1 .2 1
0 .3 .5 .5 0 .15 .1 1 .5 0
0 .3 .5 .8 0 .15 .1 1 .8 0
0 .3 1 .2 0 .15 .2 .5 .2 0
0 .3 1 .5 0 .15 .2 .5 .5 0
0 .3 1 .8 0 .15 .2 .5 .8 2
.05 .1 .5 .2 0 .15 .2 1 .2 5
.05 .1 .5 .5 0 .15 .2 1 .5 5
.05 .1 .5 .8 0 .15 .2 1 .8 5
.05 .1 1 .2 0 .15 .3 .5 .2 0
.05 .1 1 .5 0 .15 .3 .5 .5 2
.05 .1 1 .8 0 .15 .3 .5 .8 2
.05 .2 .5 .2 0 .15 .3 1 .2 4
.05 .2 .5 .5 0 .15 .3 1 .5 6
.05 .2 .5 .8 0 .15 .3 1 .8 6
.05 .2 1 .2 0 .20 .1 .5 .2 4*
.05 .2 1 .5 0 .20 .1 .5 .5 4*
.05 .2 1 .8 0 .20 .1 .5 .8 3
.05 .3 .5 .2 0 .20 .1 1 .2 1
.05 .3 .5 .5 0 .20 .1 1 .5 2
.05 .3 .5 .8 0 .20 .1 1 .8 0
.05 .3 1 .2 0 .20 .2 .5 .2 7*
.05 .3 1 .5 0 .20 .2 .5 .5 6*
.05 .3 1 .8 0 .20 .2 .5 .8 5
.10 .1 .5 .2 2 .20 .2 1 .2 6
.10 .1 .5 .5 1 .20 .2 1 .5 8
.10 .1 .5 .8 0 .20 .2 1 .8 10
.10 .1 1 .2 0 .20 .3 .5 .2 3*
.10 .1 1 .5 0 .20 .3 .5 .5 2
.10 .1 1 .8 0 .20 .3 .5 .8 2
.10 .2 .5 .2 8 .20 .3 1 .2 10
.10 .2 .5 .5 1 .20 .3 1 .5 16
.10 .2 .5 .8 1 .20 .3 1 .8 15
Table 2: Welfare and Implicit Contracts
# default states Welfare
0 80.98
8 80.54
9 80.12
10 80.12
11 79.88
12 79.88
27 77.37
Table 3: Sustainability of Non-default Equilibrium
Zg B/Y
2% 5% 8%
45% and lower * * *
50% * *
55% *
60% and higher
bt rt
Nature: zt gov’t type t
Default decision:
θt (ct)
t+ 1
bt+1 rt+1
Figure 2a: Technology Shock - Zg (%)
-7.5 -5 -2.5 0 2.5 5 7.5
1 2 3 4 5 6 7 8 9 10 11
Figure 2b: Default Rate (%)
0 10 20 30
Figure 2c: Probability of Good Type (%)
0 25 50 75 100
1 2 3 4 5 6 7 8 9 10 11
Figure 2d: Contractual Interest Rates (%)
0 5 10 15 20 25 30 35
Figure 2e: Output Deviation (%)
-10 -7.5 -5 -2.5 0 2.5 5 7.5 10
1 2 3 4 5 6 7 8 9 10 11
Figure 2f: Debt Services (% GDP)
-4 0 4 8 12 16