Journal of Applied Fluid Mechanics, Vol. 9, No. 2, pp. 877-888, 2016. Available online at www.jafmonline.net, ISSN 1735-3572, EISSN 1735-3645.
Experimental Investigation of Separation Control on a
NACA0024 Airfoil using Stationary and Non-Stationary
AC-Dielectric Barrier Discharge Plasma Actuator
G. Tathiri
1†, H. Parishani
2, S. G. Pouryoussefi
3, E. Esmaeilzadeh
4, S. M. Mirsajedi
5,
M. Mirzaei
3and N. Khatibzadeh
61
Department of Engineering, Zanjan Branch, Islamic Azad University, Zanjan, Iran 2
Department of Earth System Science, University of California Irvine, Irvine, CA 92697-3100, USA 3
Department of Aerospace Engineering, K.N. Toosi University of Technology, Tehran, Iran 4
Department of Mechanical Engineering, University of Tabriz, Tabriz, Iran 5 New Technologies Engineering Faculty, Shahid Beheshti University, Tehran, Iran
6
Beckman Laser Institute and Medical Clinic, Irvine, CA 92612, USA
†Corresponding Author Email: gh_tathiri@iauz.ac.ir
(Received December 28, 2014; accepted March 16, 2015)
A
BSTRACTAn experimental study of stationary and non-stationary dielectric barrier discharge (DBD) plasma actuator is presented to control the flow around a NACA0024 airfoil. First, an induced air velocity of ~5 m/s is generated on a flat plate in still air using an AC-DBD actuator to find the optimal setup of the actuator (voltage, frequency, electrode width and gap size). Using the same actuator in the optimal position/setup on a NACA0024 airfoil at Reynolds number of 0.48×10⁶, we are able to increase the stall angle of the airfoil to 18º, compared to 16º in no-actuator state. Furthermore, during the plasma actuation, the lift is increased by up to 5%. We show that non-stationary actuation, while yielding a performance similar to stationary actuation, leads to a considerable reduction of ~51% in plasma power consumption.
Keywords:Flow control; Induced flow; DBD plasma actuator; NACA0024 Airfoil; Separation point.
NOMENCLATURE
c, Le chord, electrode length, m
CP pressure coefficient, dimensionless
F*
, F*
v, F*htotal force on airfoil element,
vertical/horizontal components, dimensionless
Fac AC-carrier frequency of the plasma
actuator signal, s-1
fexcitation (fe) non-stationary excitation frequency, s-1
I (Irms) root-mean-square current intensity of
plasma actuator, A
L, D lift/drag force, dimensionless
L, φ element length/angle on airfoil surface, m/degree
P, P∞ surface, ambient pressure, kgm-1s-2 Re Reynolds number in terms of chord and
air viscosity in standard temperature, dimensionless
T1 , T2 one actuator impulse period including on
& off state, time period when the impulse is non-zero, s
u∞ free-stream velocity at entrance to the test section, ms-1
Umax maximum induced velocity in still air at the nearest point to the flat plate surface, ms-1
Vrms root-mean-square voltage of plasma actuator, kgm2s-3A-1
W power consumption per unit length of electrodes, kgms-3
x distance from airfoil leading edge, m α angle of attack (AOA), degree β duty cycle, dimensionless ρ air density, kgm-3
V (Vpp) maximum to minimum applied voltage of plasma actuator, kgm2s-3A-1
1.
INTRODUCTION
Flow separation may lead to uncontrollable changes
leading edge (global separation or stall) and the turbulent boundary layer separation in the mid-chord or trailing edge region. If the flow is not reattached to the wing surface, it may cause substantial losses on the airfoil performance. Therefore, various methods and techniques are used to control the flow and hence gain a better lift/drag performance.
The common flow control strategies are mostly focused on optimal displacement of the separation point/line. Among the active flow control methods, Electro-Hydro-Dynamic (EHD) actuators have received special attention. These actuators produce ionized airflow and add localized momentum to the flow through a collision of the migrating charged particles with the neutral species of the ambient gas. The main advantages of these actuators are as follows. They are relatively light, energy efficient, low power and have no moving parts with a short response time. Furthermore, their deployment and application is straightforward without having to change the surface shape. Finally, there is no need to remove the actuator when they are not in use (D’Adamo et al. 2002; Wang et al. 2013; Moreau 2007; Corke et al. 2010). A number of different EHD actuators have been considered including dielectric barrier discharge (DBD) (Roth 2003; Corke et al. 2004; Pouryoussefi and Mirzaei 2015), DC glow discharge (Kimmel et al. 2004), radio-frequency glow discharge (Merriman et al. 2001), and filamentary arc discharge (Samimy et al. 2004). Suchomel et al. (2003) provided an overview of various EHD technologies for aeronautical applications.
Over the last few years, DBD plasma actuators have become increasingly popular for flow control applications. In DBD actuators, the gap between the electrodes is covered with an insulating material and therefore a smaller gap is feasible without experiencing unwanted discharges. Consequently, plasma with higher power is generated to better accelerate the flow. Furthermore, the smaller gap reduces the size of the actuator substantially and makes it possible for DBD actuators to be installed and used more conveniently in the exact desired spots. From practical point of view, this is the major advantage of DBD actuators over other EHD actuators. Indeed, this growth in popularity and demand of DBD actuators has been so rapid that Kriegseis et al. (2013) felt the need to introduce performance evaluation measures to quantify the flow control effectiveness of the DBD plasma actuators. They also thoughtfully attempted to clarify the ambiguities with regards to power efficiency by introducing a power-flow diagram. Several excellent reviews are published on the topic, and here we only mention the most relevant from recent studies.
Kotsonis and Veldhuis (2010) performed experiments to study the DBD actuators in pulse mode. They focused on the effectiveness of the actuator in inducing fluctuating velocity components. They found that duty cycle and pulse frequency together determine the magnitude and the consistency of the fluctuating velocity and
introduced an empirical envelope to predict the actuator operation for low speed flow control. Kotsonis et al. (2014) used a DBD plasma actuator to study the effect of circulation on a rounded trailing edge of an airfoil up to Reynolds number 0.28×10⁶. They found that the plasma actuator
installed at the trailing edge increases the effective thickness of the trailing edge and also decreases the vortex shedding frequency. Also Zhang et al. (2014) deployed a DBD plasma actuator on an unmanned aerial vehicle (UAV) to study the flow control on a UAV. They found an increase of 2.5% in lift coefficient and a significant improvement in lift/drag ratio.
There have been various studies of plasma actuation on airfoils for flow control purposes. Li et al. (2014) performed experiments by installing a DBD actuator on a flap of a three-element McDonnell Douglas 30P/37N airfoil. They reported suppression of flow separation at speeds of up to 30 m/s along with decreased vortex shedding from the airfoil flap, consistent with the findings of Kotsonis et al. (2014). In another study, Taleghani et al. (2012) installed three plasma actuators on an NLF0414 airfoil and were able to improve the lift of the airfoil by up to 17% at optimum setup of duty cycle and excitation frequency. Further, in a similar study on a NACA0012 airfoil with a Gurney flap, Feng et al. (2012) showed that using a DBD actuator a reasonable gain in lift is achieved with a minor drag penalty for their particular setup. They quantified that the gain in lift is a function of Reynolds number and angle of attack for given plasma properties. Mabe et al. (2009) carried out similar experiments on two different types of airfoils and concluded that for high Reynolds numbers (Re>105), a single plasma actuator does not yield a significant gain. They argued that from flow control perspective, single DBD actuation is only suitable for small (micro) air vehicles. Recently, a comprehensive numerical study by Sato et al. (2013) categorized the different effects of DBD actuation on a NACA0015 airfoil at Re=0.63×10⁵. They deployed Large Eddy Simulation and found among other results that the vicinity of the separation point is the most desirable spot for a DBD actuator on an airfoil.
On a different front, a host of studies are carried out on nano-second (ns) pulsed DBD actuators for highly specialized applications. This is a particular form of actuation where the excitation time is much smaller than that of an AC-DBD actuator and therefore a substantially higher level of flow control is achieved. Unlike the AC-DBD actuation, which essentially works on the momentum input by ionized gas, the ns-DBD actuation works on thermal expansion of the gas in the discharge volume. The ns-DBD actuators are beyond the scope of this paper and therefore briefly reviewed here only for the sake of completeness (Little et al. 2012; Correale et al. 2014; Zheng et al. 2014).
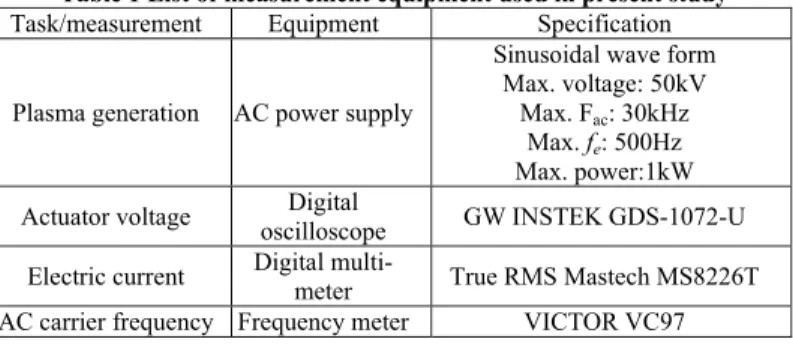
Table 1 List of measurement equipment used in present study
Task/measurement Equipment Specification
Plasma generation AC power supply
Sinusoidal wave form Max. voltage: 50kV
Max. Fac: 30kHz
Max. fe: 500Hz Max. power:1kW
Actuator voltage Digital
oscilloscope GW INSTEK GDS-1072-U
Electric current Digital
multi-meter True RMS Mastech MS8226T AC carrier frequency Frequency meter VICTOR VC97
airfoil, installation of plasma actuator in the natural separation point is more effective in removing the separation point from the airfoil surface. Further, Jukes et al. (2012) showed that a plasma actuator installed in an optimal location can reattach the separated flow to the NACA0024 airfoil surface for angles of attack up to α=16º. Their experiment is carried out for Re=0.53×10⁵ and α=12º, 14º and 16º. In a more recent study, Bouremel et al. (2013) studied the effect of DBD actuator location on the flow separation and performance of NACA4415 airfoil. They conducted experiments at Re=0.35×10⁵ for angles of attack in the range of -6° to 16°. They quantified the optimum location of the actuator for different angles of attack and found that the best lift and drag are resulted from actuators placed closer to the leading edge. They also showed that the actuator has to be in upstream of the separation point to be most efficient. They showed that the actuators located after the separation zone are the least efficient. Thomas et al. (2009) among others studied the optimum plasma actuator setup to yield an improved level of control at higher Reynolds numbers. They investigated the effects of dielectric material and thickness, voltage and frequency, geometry of the exposed and covered electrodes, and multiple actuator setups. Among other conclusions, they showed that a thicker dielectric material with high dielectric strength and low dielectric constant leads to an order of magnitude increase in the attainable body force.
The goal of this experimental research is to study the performance characteristics of an AC-DBD plasma actuator on a NACA0024 airfoil. This is achieved by installing the plasma actuator near flow separation point on the airfoil at Re=0.48×10⁶.
Simultaneously, we have also measured the pressure coefficient and consequently the lift and drag forces. The first part of this research on the advantages of the AC-DBD over DC-corona actuation is recently published (Tathiri et al. 2014) and the current paper is the continuation of that study. The current paper extends the results of Jukes et al. (2012) to a higher Reynolds number along with results from non-stationary actuation.
The rest of the paper is organized as follows. Section 2 summarizes the experimental setup and equipment. In section 3, we discuss the results of deploying the actuator on a flat plate. The results of experiments on NACA0024 airfoil are presented in section 4. Finally, section 5 summarizes the most
important results and conclusions.
2.
EXPERIMENTAL SETUP
AC-DBD plasma actuators are used to control the flow in both low and high speed flows. These actuators are usually composed of two plate-electrodes, which are periodically actuated by an AC power source. Usually, one electrode is exposed and the other electrode is insulated using a dielectric material. The dielectric material between the electrodes stabilizes the plasma discharge and prevents the electrodes from over-heating. The schematic view of the DBD plasma actuator, used in this study, is shown in Fig. 1. Due to the intermittent nature of the input AC, the body force is also intermittent. Orlov (2006) and Orlov et al. (2006) among others showed that the direction of the body force is from the upper exposed electrode to the lower covered electrode (see Fig. 1).
Fig. 1. Schematic of the DBD plasma actuator.
For this research, two steps are considered. First, we evaluate the method by applying the actuator on a flat plate in still air to optimize the geometrical and electrical parameters. Then, by applying the same actuator (with the optimum setup obtained in step one) the flow control on a NACA0024 airfoil is investigated. Our electrodes are made from copper strips with 0.05mm thickness. The dielectric material is a flexible Kapton adhesive with breakdown voltage of 275kV/mm, dielectric constant of 3.4 at 1MHz and thickness of 0.05mm per layer. In order to achieve higher voltages, 6 layers of Kapton are used to increase the insulation property. Table 1 summarizes the instruments/equipment used during this experiment.
3.
FLAT PLATE EXPERIMENT
plate to set the optimal voltage and frequency of the plasma. A high-resolution digital micro-manometer (Testo 0560 5126) with accuracy of ±0.1Pa is used (yielding ±0.05 uncertainty) for induced velocity measurements. The outer diameter of the Pitot tube is 0.6 mm and is located 6mm downstream of the HV electrode and 0.3mm above the surface, which allows measuring the maximum velocity in the nearest feasible point to the wall. In Fig. 2, the maximum induced velocity (a) and root-mean-square current intensity (b) are plotted for a constant frequency of 10k Hz. The current draw (Irms) is an important variable determining the total
power consumption of the actuator. We observe that the current draw increases by the applied voltage. However, as is shown in Fig. 2(b), the maximum attainable velocity (Umax) increases linearly and
peaks at ~5m/s. After a certain threshold voltage, the induced velocity starts to decrease (this threshold is 9kV for Fac=10 kHz). This decrease is
caused by streaks of luminous discharges, which dissipate the plasma power to heat, light and sound. Consequently the attainable velocity does not increase beyond ~5m/s. Thus the optimal plasma setup is defined as homogenous plasma without saturation (i.e. no luminous discharge streaks).
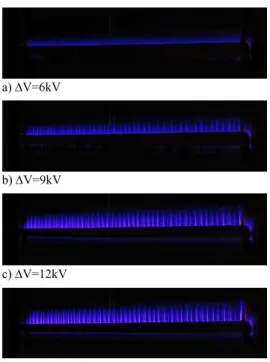
An example of luminous discharge is shown in Fig. 3. These series of pictures are taken for Fac=12 kHz
by increasing the voltage from 6kv (panel a) to 15kv (panel d). The pictures may be compared with Figure 8 of Thomas et al. (2009) where they show the plasma saturation for various frequencies. We note that saturation voltage and frequency are inter-dependent as discussed in detail by Thomas et al. (2009).
(a)
(b)
Fig. 2. Umax and Irms versus applied voltage, Fac
=10 kHz, 6 layers Kapton.
Structural damage is possible due to high discharge intensities. For instance, local hotspots from the discharges generate undesirable bubbles in the inner layers of the dielectric. This is shown in Fig. 4.
a) V=6kV
b) V=9kV
c) V=12kV
d) V=15kV
Fig. 3. Electric discharge regime changes from homogenous discharge to filamentary luminous discharge (saturation) by increasing the applied
voltage, Fac =12 kHz, 6 layers Kapton.
Fig. 4. Bubbles in the mid-layers of dielectric causes a reduction of the dielectric properties of
Kapton, Fac =12 kHz, 6 layers Kapton.
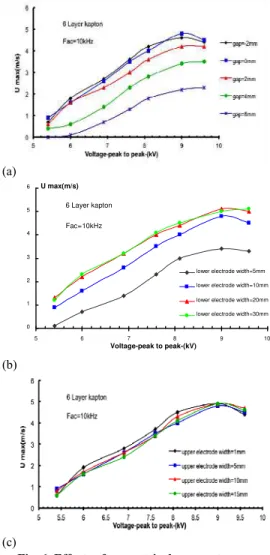
In Fig. 5, the maximum induced velocity and root-mean-square current intensity are plotted versus AC frequency. We observe that for a fixed voltage, the current draw increases by increasing the AC frequency, due to increase in the plasma permeation. The maximum velocity increases to a certain peak and then decreases mainly due to non-uniformity of the plasma. Figure 5(a) shows that at higher voltages, the dielectric is capitulated in lower frequencies. Thus an increase in the AC frequency reduces the plasma efficiency after a certain limit. This limit depends on the applied voltage and is approximately 10 kHz for 8.4 kV, 14 kHz for 6.6 kV and 16 kHz for 8.4 kV. In comparison with Fig. 2, we note that the AC frequency is not as effective as voltage on increasing the induced velocity.
Effects of the geometrical properties (over-lapping, width of the covered electrode and width of the 6 Layer kapton
Fac=10kHz
0 10 20 30 40 50 60 70
5 6 7 8 9 10
Voltage-peak to peak-(kV) I rms(mA)
6 Layer kapton
Fac=10kHz
0 1 2 3 4 5 6
5 6 7 8 9 10
exposed electrode) on the induced velocity are shown in Fig. 6. We find that by increasing the gap between the electrodes, plasma power and consequently induced velocity decreases. The slope of the induced velocity versus voltage attains the highest value for gap=0mm as shown in Fig. 6(a). Thus the optimal overlapping of 0mm of the electrodes is selected for the rest of this study. Figure 6(b) shows the effect of the lower electrode width on the induced velocity while the size of the upper electrode is fixed at 5 mm.
6 Layer kapton
0 1 2 3 4 5 6
8 10 12 14 16 18
AC-frequency(kHz)
U
m
ax(
m
/s
)
Voltage=5.4kV
Voltage=6.6kV
Voltage=8.4kV
(a)
6 Layer kapton
0 10 20 30 40 50 60 70 80
8 10 12 14 16 18
AC-frequency(kHz)
I r
m
s
(m
A
)
Voltage=5.4kV
Voltage=6.6kV
Voltage=8.4kV
(b)
Fig. 5. Umax and Irms versus AC-carrier
frequency, V =5.4kV, 6.6kV, 8.4kV, 6 layers
Kapton.
We found that increasing the surface area of the covered electrode significantly increases the induced velocity. However, this effect is limited only up to an optimal surface area where the plasma intensity saturates. Beyond this saturation point, the surface area of the covered electrode does not have a significant effect on the induced velocity. As is shown in Fig. 6(c), the surface area of the exposed electrode has a negligible effect on the current draw and induced velocity(the size of the lower electrode is held constant at 20 mm). This is due to the fact that the upper electrode (with generation of electric field) is only responsible for ionization of air molecules and electron production.
Since a large number of electrons per unit area of electrodes are available, ionization does not depend on the width of the exposed electrode. Therefore, the following optimal values are selected for rest of the experiments in this paper: width of the exposed upper electrode=5mm, width of the covered lower electrode=15mm. Finally, in order to achieve a fully
two-dimensional flow, we set the electrode length of 320mm. This measure is long enough to avoid the wing-tip effects.
(a)
(b)
(c)
Fig. 6. Effects of geometrical parameters on
plasma power, Fac=10kHz, 6 layers Kapton.
4.
NACA0024 AIRFOIL
EXPE-RIMENT
A model of the NACA0024 airfoil is made using laser-cut sections of Plexiglas (poly methyl methacrylate). Assembling multiple sections together, a model of the airfoil is built with the following dimensions: chord=300mm, maximum thickness= 72mm, span=630mm. In the leading edge (where high pressure gradients exist), a denser pattern of pressure taps is considered to accurately measure the pressure. To find the best spot to install the actuator, we performed experiments with NACA0024 airfoil (without the plasma actuator) in wind tunnel. The stall angle of this airfoil is found to be approximately 16º (Fig. 16) and in this angle of attack separation occurs downstream of the maximum thickness. Thus the plasma actuator's location is chosen in such a way that the tangential induced flow of plasma actuator in the maximum thickness is parallel to the airfoil surface. In doing so, one of the pressure taps is blocked
6 Layer kapton
Fac=10kHz
0 1 2 3 4 5 6
5 6 7 8 9 10
Voltage-peak to peak-(kV) U max(m/s)
lower electrode width=5mm
lower electrode width=10mm
lower electrode width=20mm
undesirably. However, we note that this blockage does not compromise the validity/accuracy of our results in any manner. The edge of upper exposed electrode is placed in 64mm (x/c=0.21) from the leading edge. An overview of pressure taps and plasma actuator location is shown in Fig. 7.
Fig. 7. Arrangement of pressure taps and electrodes of the plasma actuator on the
NACA0024 airfoil.
Our experiments are performed in the low speed open circuit suction wind-tunnel in the Aerospace Department of K. N. Toosi University. The test section of this tunnel is 1m×1.2m in cross section and 2.5m in length. The maximum available velocity in the test section is 70m/s, yielding a maximum Reynolds number=1.34×10⁶ for our model. The intensity of free-stream turbulence is measured to be 0.2% and non-uniformity of the flow is less than 0.5%. The air speed is set at 25m/s yielding a Reynolds number Re=0.48×10⁶, in terms of the chord length and viscosity in standard laboratory temperature. Views of this tunnel and location of airfoil in test section in different states are shown in Fig. 8.
4.1 Results and Discussion, Stationary
Actuation
Pressure is measured using
Honeywell-DC005NDC4 digital pressure transducers. Total uncertainties in measuring the pressure gradient, density, free-stream velocity of the wind tunnel, and other geometric uncertainties amount to about 1.5%. The measured pressure values are non-dimensionalized using:
2 2
0.5 0.5
P
P P P
C
u u
(1)
Fac=15kHz AOA=12
-3
-2.5
-2
-1.5
-1
-0.5
0
0.5
1
1.5
0 0.1 0.2 0.3 0.4 0.5 0.6 0.7 0.8 0.9 1
(x/c)
Cp
Clean-suction(upper) side
Plasma off Plasma on-voltage=3.6kV Plasma on-voltage=5.4kV Plasma on-voltage=6.0kV Plasma on-voltage=6.6kV
Clean-pressure(lower) side
Plasma off Plasma on-voltage=3.6kV Plasma on-voltage=5.4kV Plasma on-voltage=6.0kV Plasma on-voltage=6.6kV
(a) V=3.6kV, 5.4kV, 6.0kV, 6.6kV, α =12º
Fac=15kHz AOA=14
-3
-2.5
-2
-1.5
-1
-0.5
0
0.5
1
1.5
0 0.1 0.2 0.3 0.4 0.5 0.6 0.7 0.8 0.9 1
(x/c)
Cp
Clean-suction(upper) side
Plasma off Plasma on-voltage=6.0kV Plasma on-voltage=7.2kV Plasma on-voltage=7.8kV Plasma on-voltage=8.1kV
Clean-pressure(lower) side
Plasma off Plasma on-voltage=6.0kV Plasma on-voltage=7.2kV Plasma on-voltage=7.8kV Plasma on-voltage=8.1kV
(b) V=6.0kV, 7.2kV, 7.8kV, 8.1kV, α =14º
Fac=15kHz AOA=16
-3.5
-3
-2.5
-2
-1.5
-1
-0.5
0
0.5
1
1.5
0 0.1 0.2 0.3 0.4 0.5 0.6 0.7 0.8 0.9 1
(x/c)
Cp
Clean-suction(upper) side
Plasma off Plasma on-voltage=6.0kV Plasma on-voltage=7.4kV Plasma on-voltage=7.9kV Plasma on-voltage=8.1kV
Clean-pressure(lower) side
Plasma off Plasma on-voltage=6.0kV Plasma on-voltage=7.4kV Plasma on-voltage=7.9kV Plasma on-voltage=8.1kV
(c) V=6.0kV, 7.4kV, 7.9kV, 8.1kV, α =16º
Fig. 9. CP distribution on suction and pressure
side of NACA0024 airfoil in three states of clean, plasma-off and plasma-on, for various applied
voltages, Fac=15kHz, Re=0.48×10⁶.
In Fig. 9, the pressure coefficient is plotted versus the distance (x/c) from the leading edge at different angles of attack for both suction and pressure sides of the airfoil. The results are shown for different voltages and Fac=15 kHz at three angles of attack
plasma off and with plasma on. The measurement of CP without the actuator are carried out for α in
the range of α=0º-22º with 2º variations. Since the stall angle of the NACA0024 airfoil is ~16º, the measurements related to the plasma-on are carried out near the stall angle.
As shown in Fig. 9, on the suction side of the airfoil where the actuator is installed, there are small differences in CP when comparing the clean state
with actuator-off state. This difference is mainly due to the extra thickness of the electrode and hence the small perturbations in the local streamlines. Since the electrode thickness is much smaller than the boundary layer thickness, we can safely neglect the minor changes in the geometry of the airfoil due to the electrode thickness.
We note that in both cases of the actuator on and off, the CP curves are identical on both suction side
and pressure side. Namely, in these angles of attack (α =12º, 14º, 16º) the flow around the airfoil is not separated and if there is any separation, it is far from the actuator base. Therefore the induced flow generated by plasma has no effect on the flow characteristics. We conclude that the induced momentum is highly local and can be used for flow control only in downstream regions of the plasma actuator. In practice, in the regions far from the actuator, the free stream air velocity damps the induced momentum leaving virtually no effect from the induced momentum. Because of this reason, the plasma actuators are known as post-stall actuators (Sato et al. 2013; Jolibois et al. 2008; Bouremel et al. 2013).
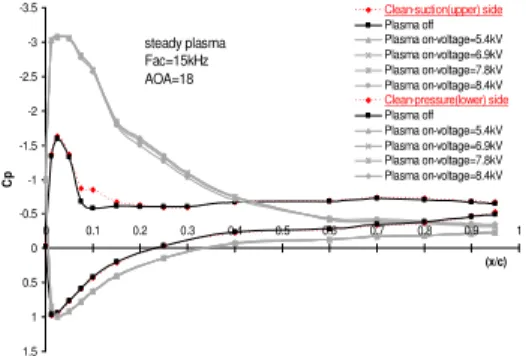
Now focusing on post-stall characteristics of the flow, in Fig. 10, CP is plotted versus x/c for both
suction and pressure sides of the airfoil at α =18º. Three states of clean, plasma-off and plasma-on are considered in different voltages and AC frequencies. We observe that at α=18º, the plasma actuator substantially changes the shape of the pressure coefficient curves. For no-actuator state, on the suction side CP reaches a plateau and becomes almost
constant at x/c~0.1 where the flow is separated. In Fig. 10, we show that plasma actuation delays the flow separation and consequently the CP plateau to
approximately x/c~0.6. Since in this angle of attack flow separation occurs near the plasma base, by delaying the separation from x/c~0.1 to x/c~0.6 the actuation has a significant effect on shrinking the wake region and consequently improving the airfoil performance.
We emphasize that there is a rapid and large displacement of the separation point from mid-chord at α =16º to the leading edge proximity at α=18º (i.e. compare Fig. 9(c) against Fig. 10. The main reason for this rapid shift is the high thickness of NACA0024 airfoil which causes the separation point to quickly move from mid-chord to the leading edge proximity, with only 2º increase in the attack angle. For various voltages the CP values are almost identical at the
pressure side of the airfoil. On the other hand, CP
curves have measurable differences on the suction side. The difference in CP distribution for various
applied voltages, however, is small. This implies that
the applied voltage affects the pressure distribution slightly. Further, we found that for three frequencies of 12, 14, 16kHz, our CP curves are almost identical.
As shown in Fig. 10(b), this implies that unlike the applied voltage, the AC frequency does not have a considerable effect on CP.
steady plasma Fac=15kHz AOA=18
-3.5
-3
-2.5
-2
-1.5
-1
-0.5
0
0.5
1
1.5
0 0.1 0.2 0.3 0.4 0.5 0.6 0.7 0.8 0.9 1
(x/c)
Cp
Clean-suction(upper) side
Plasma off Plasma on-voltage=5.4kV Plasma on-voltage=6.9kV Plasma on-voltage=7.8kV Plasma on-voltage=8.4kV
Clean-pressure(lower) side
Plasma off Plasma on-voltage=5.4kV Plasma on-voltage=6.9kV Plasma on-voltage=7.8kV Plasma on-voltage=8.4kV
(a) V=5.4kV, 6.9kV, 7.8kV, 8.4kV, Fac=15 kHz
steady plasma V=6.6kV AOA=18
-3.5
-3
-2.5
-2
-1.5
-1
-0.5
0
0.5
1
1.5
0 0.1 0.2 0.3 0.4 0.5 0.6 0.7 0.8 0.9 1
(x/c)
Cp
Clean-suction(upper) side
Plasma off Plasma on-Fac=12kHz Plasma on-Fac=14kHz Plasma on-Fac=16kHz
Clean-pressure(lower) side
Plasma off Plasma on-Fac=12kHz Plasma on-Fac=14kHz Plasma on-Fac=16kHz
(b) V=6.6kV, Fac=12 kHz, 14 kHz, 16 kHz
Fig. 10. CP distribution around suction and
pressure side of the NACA0024 airfoil in three states of clean, plasma off and plasma on,
Re=0.48×10⁶, α =18º.
4.2 Results and Discussion, Non-Stationary
Actuation
Now we focus on the non-stationary actuation. In the non-stationary excitation of the plasma actuator, two additional parameters of excitation frequency (unsteady frequency) and duty cycle are introduced. The portion of a single period, in which the applied signal is on, is denoted by T2 and one period is T1.
The ratio is defined as duty cycle as:
2 1
(T /T) 100
. Also excitation frequency is defined as: fexcitation1 /T1. The differences in the waveform of stationary and non-stationary actuation are schematically shown in Fig. 11.
excellent study by Jukes and Choia (2013).
Fig. 11. Principle waveforms of stationary and non-stationary actuations.
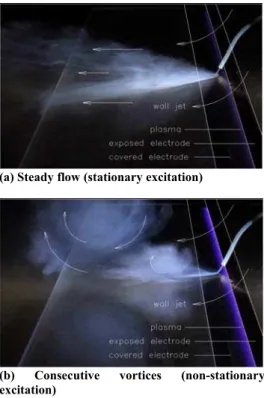
In this section, our target is to take advantage of this complex flow pattern to yield a better lift/drag performance while lowering the power consumption when compared to steady actuation. Indeed for higher excitation frequencies (larger than 100Hz), the flow pattern from non-stationary actuation becomes similar to that of a stationary actuation. This is due to the fact that the flow response time is not short enough to follow the fast changes due to the plasma-induced velocity. Therefore there is an optimum waveform for non-stationary actuation, which we will discover through experiments in the following sections.
(a) Steady flow (stationary excitation)
(b) Consecutive vortices (non-stationary excitation)
Fig. 12. Induced flow patterns caused by a) stationary and b) non-stationary actuation.
For non-stationary actuation, we show in Fig. 13(a) that increasing the duty cycle at a constant excitation frequency of 100Hz increases the required current and thus the induced velocity. The quasi-linear increase in current draw is in agreement with the results of Kotsonis and Veldhuis (2010) and Taleghani et al. (2012) for duty cycles in the range of 15%-80%. However, excitation frequency
at a constant duty cycle of 50% does not have a significant effect on the current draw (Fig. 13(b)). To better understand the benefits of the non-stationary actuation, we calculate the power consumption of the actuator per unit length of the electrodes in terms of root-mean-square voltage and current drawn to yield:
( ) / ( ) /
2 2 peak peak
rms rms e rms e
V
W V I L I L
(2)
Applied voltage=7.2kV Fac=15kHz,f-excitation=100Hz
20 25 30 35 40 45 50 55 60
0 20 40 60 80 100
Duty cycle(%)
I r
m
s
(m
A
)
(a) Irms versus duty cycle, fe=100Hz
Applied voltage=7.2kV Fac=15kHz,Duty cycle=50%
30 35 40 45 50 55 60
20 70 120 170 220
f-excitation(Hz)
I r
m
s
(m
A
)
(b) Irms versus excitation frequency, β=50%
Fig. 13. Effects of non-stationary parameters on
plasma, Re=0.48×10⁶, α=18º, V=7.2kV,
Fac=15kHz.
Figure 14 compares both CP and power
consumption in suction side of the airfoil for two states of stationary actuation (V=7.2kV, Fac=15kHz)
and non-stationary actuation (V=7.2kV, Fac=15kHz)
with fe=100Hz and β=15%, 40%, 80%. The CP from
non-stationary actuation is similar in magnitude to the CP from stationary actuation for three duty
cycles. This figure shows that the same increase in CP is reached with a duty cycle of 15% for
for non-stationary actuation (duty cycle of 15%). This amounts to ~51% energy saving due to non-stationary actuation.
steady & unsteady plasma suction(upper) side V=7.2kV,Fac=15kHz AOA=18
-3.5
-3
-2.5
-2
-1.5
-1
-0.5
0
0 0.1 0.2 0.3 0.4 0.5 0.6 0.7 0.8 0.9 1
(x/c)
Cp
Clean
Plasma off
Plasma on-unsteady,f excitation=100Hz, Duty cycle=15%,Power consumption=2.15W/cm
Plasma on-unsteady,f excitation=100Hz, Duty cycle=40%,Power consumption=3.35W/cm
Plasma on-unsteady,f excitation=100Hz, Duty cycle=80%,Power consumption=4.40W/cm
Plasma on-steady Power consumption=4.44W/cm
Fig. 14. CP distribution on the suction side of
NACA0024 airfoil in stationary actuation (V=7.2kV, Fac=15kHz) and non-stationary
actuation in the same conditions with fe=100Hz,
β=15%, 40%, 80%. Re=0.48×10⁶, α =18º.
At α=20º, because of the separation from the leading edge of the airfoil, the actuator is entirely located in the separated region. Therefore, the actuator does not affect the pressure distribution. This is shown in Fig. 15.
Fac=15kHz AOA=20
-2
-1.5
-1
-0.5
0
0.5
1
1.5
0 0.1 0.2 0.3 0.4 0.5 0.6 0.7 0.8 0.9 1
(x/c)
Cp
Clean-suction(upper) side
Plasma off Plasma on-voltage=5.4kV Plasma on-voltage=6.9kV Plasma on-voltage=7.8kV
Clean-pressure(lower) side
Plasma off Plasma on-voltage=5.4kV Plasma on-voltage=6.9kV Plasma on-voltage=7.8kV
(a) V=5.4kV, 6.9kV, 7.8kV, Fac=15kHz
V=6.6kV AOA=20
-2
-1.5
-1
-0.5
0
0.5
1
1.5
0 0.1 0.2 0.3 0.4 0.5 0.6 0.7 0.8 0.9 1
(x/c)
Cp
Clean-suction(upper) side
Plasma off Plasma on-Fac=12kHz Plasma on-Fac=14kHz Plasma on-Fac=16kHz
Clean-pressure(lower) side
Plasma off Plasma on-Fac=12kHz Plasma on-Fac=14kHz Plasma on-Fac=16kHz
(b) V=6.6kV, Fac=12 kHz, 14kHz, 16kHz
Fig. 15. CP distribution on suction and pressure
side of the NACA0024 airfoil in three states of
clean, plasma off and plasma on, Re=0.48×10⁶,
α =20º.
Friction (skin) drag is produced by viscose forces acting on the surface of the airfoil while pressure (shape) drag is caused by an imbalance in the pressure forces on the body. The contribution of each component in the total drag highly depends on the shape and position of the body in the flow field. In this paper, we only consider the pressure drag
and neglect the friction drag. This assumption is safe for the current research, because in high angles of attack and near the stall angles, the friction drag is negligible and the pressure drag dominates the total drag. To calculate the lift and drag forces, first we calculate the normal (N) and axial (A) components of the forces acting on the airfoil. Then the normal and axial components are projected to compute the total lift and drag forces using:
cos sin
LN A
(3)
sin cos
DN A
(4) To measure the normal and axial components of the forces acting on the airfoil, we carefully mesh the surface of the airfoil to the location of pressure sensors in upper and lower surfaces of the airfoil. In order to do this, the pressure sensors are treated as element center and the midpoints of any two adjacent pressure sensors are considered as the sides of the rectangular element. Using the coordinates of center points, the length and angle associated with each element is computed as:
2 2 1 2 1
2 1 2 1
2 1
( ) ( ) , tan (y y )
l y y x x
x x
(5) Therefore, the dimensionless force on each element of the airfoil surface is calculated using
dimensionless length and CP as
P
FC ( l / chord ). This force is perpendicular to the element surface. Thus it must be decomposed into vertical and horizontal components in order to be assembled with other forces. Then using Eq. (3) and Eq. (4) dimensionless lift and drag forces on airfoil are determined as N
Fv
Fcosand A
Fh
Fsin.At α=18º, the lift/drag coefficients and power consumption per unit length of electrodes are summarized in Table 2. There are few important results:
1- In stationary plasma actuation, although increasing the voltage increases the power consumption per unit length of the electrodes, but this does not necessarily translate to an increase in the lift coefficient. This is due to the generation of luminous streaks of electric discharge and non-homogeneity of the plasma, which was previously discussed in section 3.
2- For non-stationary actuation, the lift coefficient does not change with increasing the duty cycle and is approximately equal to that of the stationary actuation. Thus the duty cycle of ~15% while producing the same lift coefficient, can hold off the actuator in most of the actuation time and consequently results in a considerable saving in power consumption. This prevents overheating the dielectric and thus conserves the dielectric properties of the insulating material.
stationary actuation, we obtained an average exponent of 2.51, however the exponent reported in different studies varies between 3.3 and 3.5 (Enloe et al. 2004; Forte et al. 2007; Thomas et al. 2009; Kriegseis et al. 2011; Benard and Moreau 2014). We believe that this difference in exponent is the error caused by small number of samples (only 3 data points are available) in our measurements.
Table 2 Power consumption and lift/drag coefficients of the NACA0024 with and without
actuator, Re=0.48×10⁶, α =18º
Plasma state CL CD Power (W/cm) Clean
off
0.5485 0.5188
0.2569
0.2531 -
Stationary, Fac=15kHz
V=6.9kV V=7.8kV V=8.4kV
1.0220 1.0169 0.9980
0.1556 0.1562 0.1549
3.88 5.34 6.13
Non-stationary, Fac=15kHz, V=5.4kV, fe=100Hz
β=15%
β=40%
β=80%
0.9840 0.9919 1.0097
0.1465 0.1475 0.1537
2.15 3.35 4.40
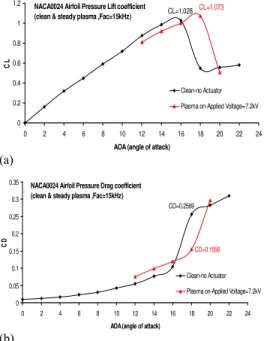
In Fig. 16, the lift and drag coefficients are plotted versus angle of attack for plasma-on and no-actuator cases. We observe that for no-no-actuator case, the maximum lift is at α~16º and then the lift force is greatly reduced due to stall. It is clear from Fig. 16(a) that application of the actuator for this setup increases the stall angle from 16º to 18º. Also we note that using the plasma actuator, the maximum lift coefficient is increased by about 5%. From Fig. 16(b), it is clear that actuation has a significant drag penalty for α<16º and therefore for practical applications, plasma actuation is not recommended before the stall point.
NACA0024 Airfoil Pressure Lift coefficient (clean & steady plasma ,Fac=15kHz) CL=1.028
CL=1.073
0 0.2 0.4 0.6 0.8 1 1.2
0 2 4 6 8 10 12 14 16 18 20 22 24
AOA (angle of attack)
CL
Clean-no Actuator
Plasma on-Applied Voltage=7.2kV
(a)
NACA0024 Airfoil Pressure Drag coefficient (clean & steady plasma ,Fac=15kHz)
CD=0.2569
CD=0.1556
0 0.05 0.1 0.15 0.2 0.25 0.3 0.35
0 2 4 6 8 10 12 14 16 18 20 22 24
AOA (angle of attack)
CD
Clean-no Actuator
Plasma on-Applied Voltage=7.2kV
(b)
Fig. 16. Lift and drag coefficients of NACA0024 airfoil with and without stationary actuator,
V=7.2kV, Fac=15kHz, Re=0.48×10⁶.
5.
CONCLUSIONS
In this experimental research we studied the effects of induced flow on separation control on the NACA0024 airfoil. We induced a velocity of ~5 m/s on a flat plate in still air using a DBD plasma actuator. The induced velocity increases with voltage and frequency, but is capped to a limit due to plasma saturation. Using the actuator on a NACA0024 airfoil, we are able to increase the stall angle by 2º at Re=0.48×10⁶, from 16º to 18º. Also
an increase of 5% in the lift coefficient is achieved. Because of the high thickness of NACA0024 airfoil, the separation point is displaced rapidly by increasing the angle of attack. Therefore, location of the plasma actuator is highly important in delaying the flow separation. We confirmed that the best location for a DBD plasma actuator is the vicinity of separation point/line, where the effects of the induced flow are at a maximum.
By switching from stationary to non-stationary actuation, we showed that it is possible to reduce the plasma power consumption by 51% while retaining the airfoil performance and flow control authority at the level of stationary actuation. Further studies may be carried out on dielectric insulation material properties and arrangement of multiple electrodes to maximize the induced flow velocity.
ACKNOWLEDGEMENT
This research is carried out in aerodynamics research laboratory of Aerospace Department in K. N. Toosi University of Technology. The authors would like to thank Alireza Doostmahmoodi for providing support with the airfoil fabrication, and experimental setup.
REFERENCES
Benard, N. and E. Moreau (2014). Electrical and mechanical characteristics of surface AC dielectric barrier discharge plasma actuators applied to airflow control. Exp. Fluids 55, 1846-1889.
Bouremel, Y., J. M. Li, Z. Zhao and M. Debiasi (2013). Effects of AC Dielectric Barrier Discharge plasma actuator location on flow separation and airfoil performance. Procedia Engineering 67, 270-278.
Corke, T. C. and M. Post (2004). Overview of Plasma Actuators: Concepts, Optimization, and Applications, AIAA Paper 2005-0563.
Corke, T. C., C. L. Enloe and S. P. Wilkinson (2010). Dielectric Barrier Discharge Plasma Actuators for Flow Control. Annu. Rev. Fluid Mech. 42, 505-529.
D’Adamo, J., G. Artana, E. Moreau and G. Touchard (2002). Control of the airflow close to a flat plate with electrohydrodynamic actuators. ASME Paper 2002-31041.
Enloe, C. L., T. McLaughlin, R. Van Dyken, K. Kachner, E. Jumper and T.C. Corke (2004). Mechanisms and responses of a single dielectric barrier plasma actuator: plasma morphology. AIAA J. 42, 589-594.
Feng, L. H., T. N. Jukes, K. S. Choi and J. J. Wang (2012). Flow control over a NACA 0012 airfoil using dielectric-barrier-discharge plasma actuator with a Gurney flap. Exp. Fluids 52, 1533-1546.
Forte, M., J. Jolibois, J. Pons, E. Moreau, G. Touchard and M. Cazalens (2007). Optimization of a dielectric barrier discharge actuator by stationary and non-stationary measurements of the induced flow velocity: application to airflow control. Exp. Fluids 43, 917-928.
Jolibois, J., F. Maxime and E. Moreau (2008). Application of an AC barrier discharge actuator to control airflow separation above a NACA 0015 airfoil: Optimization of the actuation location along the chord. J. Electrostatics 66, 496-503.
Jukes, T. N. and K. S. Choia (2013). On the formation of streamwise vortices by plasma vortex generators. J. Fluid Mech. 733, 370-393.
Jukes, T. N., S. Takehiko, W. Seth, F. Hirohide, I. Norihiko and A. Shinya (2012). Active Separation Control over a NACA0024 by DBD Plasma Actuator and FBG Sensor. J. Fluid Science and Technology 7(1), 39-52.
Kimmel, R. L., J. R. Hayes, J. A. Menart and J. Shang (2004). Effect of Surface Plasma Discharges on Boundary Layers at Mach 5. AIAA Paper 2004-0509.
Kotsonis M. and L. Veldhuis (2010). Experimental study on dielectric barrier discharge actuators operating in pulse mode. J. Applied Phys. 108, 113304.
Kotsonis, M., R. Pul and L. Veldhuis (2014). Influence of circulation on a rounded-trailing-edge airfoil using plasma actuators. Exp. Fluids 55, 1772.
Kriegseis, J., A. Duchmann C. Tropea and S. Grundmann (2013). On the classification of dielectric barrier discharge plasma actuators: A comprehensive performance evaluation study. J. Applied Phys. 114, 053301.
Kriegseis, J., B. Moller, S. Grundmann and C. Tropea (2011). Capacitance and power consumption quantification of dielectric barrier discharge (DBD) plasma actuators. J. Electrostatics 69, 302-312.
Li, J., L. Yang, B. Wang, J. Cai and G. Wang (2014). Airflow control by DBD actuator over an MDA airfoil. IEEE Transactions on Plasma
Science 42(10), 2820-2821.
Little, J., K. Takashima, M. Nishihara, I. Adamovich and M. Samimy (2012). Separation Control with Nanosecond-Pulse-Driven Dielectric Barrier Discharge Plasma Actuators. AIAA J. 50(2), 350-365.
Mabe, J. H., F. T. Calkins, B. Wesley, R. Woszidlo, L. Taubert and I. Wygnanski (2009). Single Dielectric Barrier Discharge Plasma Actuators for Improved Airfoil Performance. J. Aircraft 46(3), 847-855.
Merriman, S., E. Ploenjes, P. Palm and I. Admovich (2001). Shock Wave Control by Nonequilibrium Plasmas in Cold Supersonic Gas Flows. AIAA J. 39(8), 1547-1552.
Moreau, E. (2007). Airflow control by non-thermal plasma actuators. J. Phys. D: Appl. Phys. 40, 605-636.
Orlov, D. M. (2006). Modeling and Simulation of Single Dielectric Barrier Discharge Plasma Actuators. PhD thesis, University of Notre Dame, Indiana.
Orlov, D. M., T. C. Corke and M. Patel (2006). Electric Circuit Model for Aerodynamic Plasma Actuator. AIAA Paper 2006-1206.
Pouryoussefi, S. G. and M. Mirzaei (2015). Experimental study of the unsteady actuation effect on the induced flow characteristics in DBD plasma actuators. Plasma Science and Technology 17(5), Accepted paper.
Pouryoussefi, S. G., M. Mirzaei and M. Hajipour (2015). Experimental study of separation bubble control behind a backward-facing step using plasma actuators. Acta Mechanica, Published online 07 October 2014
Roth, J. R. (2003). Aerodynamic Flow Acceleration Using Paraelectric and Peristaltic Electro-hydrodynamic Effects of a One Atmosphere Uniform Glow Discharge Plasma. Physics of Plasmas 10(5), 2117-2126.
Samimy, M., I. Adamovich, B. Webb, J. Kastner, J. Hileman, S. Keshav and P. Palm (2004). Development and Characterization of Plasma Actuators for High Speed Jet Control. Exp. Fluids 37(4), 577-588.
Sato, M., K. Okada, T. Nonomura H. Aono, A. Yakeno, K. Asada, Y. Abe and K. Fujii (2013). Massive parametric study by LES on separated-flow control around airfoil using DBD Plasma Actuator at Reynolds Number 63,000. AIAA Paper 2013-2750.
Suchomel, C., D. Van Wie and D. Risha (2003). Perspectives on Cataloguing Plasma Technologies Applied to Aeronautical Sciences. AIAA Paper 2003-3852.
Science 40(5), 1434-1440.
Tathiri, G., E. Esmaeilzadeh, S. M. Mirsajedi and H. Mahdavi Moghaddam (2014). Experimental Investigation of “Why an AC dielectric barrier discharge plasma actuator is preferred to DC corona wind actuator in boundary layer flow control?”. J. App. Fluid Mech. 7(3), 525-534.
Thomas, F.O., T. C. Corke, M. Iqbal, A. Kozlov, and D. Schatzman (2009). Optimization of dielectric barrier discharge plasma actuators for active aerodynamic flow control AIAA J. 47(9), 2169-2178.
Wang, J. J., K. S. Choi, L. H. Feng, T. N. Jukes and
R. D. Whalley (2013). Recent developments in DBD plasma flow control. Progress in Aerospace Sciences 62, 52-78.
Zhang, X., Y. Huang, W. Wang, X. Wang and H. Li (2014). Unmanned air vehicle flow separation control using dielectric barrier discharge plasma at high wind speed. Sci. China-Phys. Mech. Astron.