Biogeosciences, 9, 1479–1491, 2012 www.biogeosciences.net/9/1479/2012/ doi:10.5194/bg-9-1479-2012
© Author(s) 2012. CC Attribution 3.0 License.
Biogeosciences
Peat decomposition records in three pristine ombrotrophic bogs in
southern Patagonia
T. Broder1, C. Blodau2,*, H. Biester3, and K. H. Knorr1
1Limnological Research Station and Department of Hydrology, University of Bayreuth, Germany 2School of Environmental Sciences, University of Guelph, Canada
3Institute for Geoecology, TU-Braunschweig, Germany
*present address: Hydrology Group, Institute of Landscape Ecology, FB 14 Geosciences, University of M¨unster, Germany
Correspondence to: K. H. Knorr ([email protected])
Received: 16 September 2011 – Published in Biogeosciences Discuss.: 26 October 2011 Revised: 14 March 2012 – Accepted: 3 April 2012 – Published: 20 April 2012
Abstract. Ombrotrophic bogs in southern Patagonia have been examined with regard to paleoclimatic and geochem-ical research questions but knowledge about organic mat-ter decomposition in these bogs is limited. Therefore, we examined peat humification with depth by Fourier Trans-formed Infrared (FTIR) measurements of solid peat, C/N ra-tio, andδ13C andδ15N isotope measurements in three bog sites. Peat decomposition generally increased with depth but distinct small scale variation occurred, reflecting fluctu-ations in factors controlling decomposition. C/N ratios var-ied mostly between 40 and 120 and were significantly cor-related (R2>0.55,p <0.01) with FTIR-derived humifica-tion indices. The degree of decomposihumifica-tion was lowest at a site presently dominated by Sphagnum mosses. The peat was most strongly decomposed at the driest site, where cur-rently peat-forming vegetation produced less refractory or-ganic material, possibly due to fertilizing effects of high sea spray deposition. Decomposition of peat was also advanced near ash layers, suggesting a stimulation of decomposition by ash deposition. Values ofδ13C were 26.5±2 ‰ in the peat and partly related to decomposition indices, whileδ15N in the peat varied around zero and did not consistently relate to any decomposition index. Concentrations of DOM partly related to C/N ratios, partly to FTIR derived indices. They were not conclusively linked to the decomposition degree of the peat. DOM was enriched in13C and in15N relative to
the solid phase probably due to multiple microbial modifi-cations and recycling of N in these N-poor environments. In summary, the depth profiles of C/N ratios,δ13C values, and FTIR spectra seemed to reflect changes in
environmen-tal conditions affecting decomposition, such as bog wetness, but were dominated by site specific factors, and are further influenced by ash deposition and possibly by sea spray input.
1 Introduction
Peatlands cover about 3 % of the earth’s surface (Aselmann and Crutzen, 1989) and occur in three different regions: a northern (boreal), tropical and southern region. South-ern peatlands, mostly in Patagonia, have accumulated 13 to 18 Pg C during the Holocene with an overall accumula-tion rate of 22 g C m−2yr−1 and cover 45 000 km2 (Yu et al., 2010). Prevailing westerly winds bring unpolluted air masses from the Pacific Ocean resulting in low atmospheric nitrogen deposition in the region (Godoy et al., 2003). As ombrotrophic bogs receive nutrients by atmospheric deposi-tions only, Patagonian bogs provide a reference system com-pared to more polluted northern bogs. Southern Patagonia peatlands have thus been frequently used as paleoclimate archives (e.g. McCulloch and Davies, 2001; Markgraf, 1993; Heusser et al., 2000) and for examination of halogen and mercury deposition records (Biester et al., 2003, 2004). The validity of such records partly depends on the decomposi-tion patterns of organic matter but investigadecomposi-tions of different, complementary proxies to address this issue are scarce for this region.
underlying, water-saturated catotelm. Here, anaerobic de-composition proceeds at a rate of only∼1 % or less of the rate in the acrotelm (Clymo, 1984; Frolking et al., 2001; Beer et al., 2008). Controls on decomposition rates are the plant community type (e.g. Bragazza et al., 2007), temper-ature (e.g. Bridgham et al., 1999) and waterlevel position and soil moisture (e.g. Laiho, 2006). The slow decompo-sition rates under permanently waterlogged conditions result from combined effects of limited oxygen diffusion into the saturated peat, the poorly decomposable litter of Sphagnum vegetation (e.g. Hogg, 1993), low temperatures and further constraints on the processes, such as enzymatic activities or free energy limitations (e.g. Freeman et al., 2001; Beer and Blodau, 2007).
Due to strong westerly winds and their close proximity to the sea peatlands in southern Patagonia are exposed to sea spray, which was shown to influence vegetation due to a fer-tilizing effect (Kleinebecker et al., 2008). As the contain-ing sulfate may be used as an electron acceptor for anaer-obic respiration (Segers and Kengen, 1998) also a stimula-tion of anaerobic respirastimula-tion and thus decomposistimula-tion by sea spray input may be postulated. Retained halogens in the peat thereby serve as an indicator for the extent of sea spray in-put (Biester et al., 2004). In Patagonia also ash layers from various volcanic eruptions in the past occur, which can have an additional stimulating effect on decomposition due to nu-trient supply or release of electron acceptors, such as sulfate, during weathering and diagenesis of the ashes (Hotes et al., 2010).
While such potential influences on organic matter decom-position and humification patterns have been identified, their relative impact is unknown. In this study we attempted to address this research gap using several indicators of or-ganic matter decomposition along the depositional record, i.e. C/N ratios of organic matter, Fourier Transform In-frared spectroscopy (FTIR) and content of stable13C and
15N isotopes in the peat. C/N ratios of the organic
mate-rial have been shown to relate to decomposition processes (e.g. Malmer and Holm, 1984) as microbial consumption of carbon- and hydrogen-rich organic substances results in a de-creased abundance of carbon relative to nitrogen. Relative nitrogen abundance increased during decomposition because mineralized nitrogen is mostly retained in microbial biomass (Damman, 1988). Therefore, the C/N ratio has been com-monly used as indicator for the degree of decomposition, based on the relatively higher loss of C compared to N during decomposition and thus indicating peat mass loss (e.g. Horni-brook et al., 2000; Kuhry and Vitt, 1996). Fourier Transform Infrared spectroscopy (FTIR) has been widely used to char-acterize organic matter quality of humic and fulvic acids and bulk peat (e.g. Holmgren and Norden, 1988; Niemeyer et al., 1992) and provides information about the relative abundance of functional groups. This method is thus used to identify hu-mification processes, i.e. changes in the molecular structure of organic matter, based on an increase in the relative
abun-dance of recalcitrant moieties such as aliphatics or aromatics compared to labile fractions, such as carbohydrates (e.g. Beer et al., 2008; Kalbitz et al., 1999; Cocozza et al., 2003). More decomposed peat was further reported to release less DOC than undecomposed peat (Biester et al., 2006; Kalbitz and Geyer, 2002). Thus, an inverse relation of the peat degree of decomposition and DOC concentrations may be expected, although the DOC quality and thus degradability may also change. Isotope ratios have been quantified as well as an indicator of decomposition processes, as changes were as-sumed to reflect isotope fractionation by microbial processes because of preferential utilization of 12C (e.g. Kalbitz and Geyer, 2002; Novak et al., 1999). This interpretation is in line with Hornibrook et al.’s (2000) finding that C/N and δ13C values in peat soils correlated. As changing vegeta-tion, microhabitat or climate also affectδ13C values, their in-terpretation with respect to decomposition or paleoclimatic conditions needs caution (Pancost et al., 2003; Price et al., 1997; Novak et al., 2010; Skrzypek et al., 2007). Other than δ13C, alsoδ15N has been applied to track nitrogen transfor-mation during decomposition in organic soils (Kalbitz et al., 2000).
The aim of this study was thus to elucidate organic mat-ter decomposition patmat-terns in Patagonian ombrotrophic bogs using a set of complementary decomposition indices as out-lined above. We assumed decomposition to be mainly con-trolled by water table levels and temperature and considered potential nutrient and electron acceptor inputs through sea spray and ash deposition as additional factors. We expected advanced decomposition (i) under drier conditions and (ii) with increasing inputs from sea spray and ash deposition.
2 Materials and methods
2.1 Site description
The investigated bogs (SkyI, SkyII, PBr2) are located in southern Patagonia near Punta Arenas (Chile) (Fig. 1) and have been partly described by Biester et al. (2003). They are situated between the Magellanic Moorlands with up to 10 000 mm yr−1 and the Pampa grassland with less than 500 mm yr−1 of precipitation. Mean annual temperature is about 6.5◦C (Schneider et al., 2003). We derived relative differences in spray input by mean bromide concentrations in the solid peat, as bromide is a major constituent of sea spray and better retained in the peat than chloride (Biester et al., 2006). Highest precipitation occurs at the SkyI site (∼1500 mm yr−1). The vegetation of the central raised part is dominated by Sphagnum mosses (e.g. Sphagnum
magel-lanicum), shrubs (e.g. Empetrum rubrum) and cushion plants
T. Broder et al.: Peat decomposition records in three pristine ombrotrophic bogs 1481
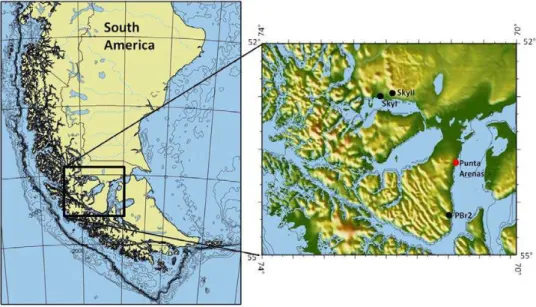
Fig. 1. Map of the study area in southern South America. Locations of the sampling sites are marked in the detailed map. Maps were
generated online at https://sfb574.ifm-geomar.de/gmt-maps at 26 February 2011 (IFM-GEOMAR).
dominating species are Sphagnum magellanicum and
Em-petrum rubrum and hummock-hollow micro-topography is
pronounced. Peat thickness reaches>4 m in the central part (I. Reisen, personal communication, 2011). The third site, PBr2, receives the least precipitation of 650–800 mm yr−1 (Heusser et al., 2000). The vegetation is dominated by
Empetrum rubrum, Sphagnum magellanicum, sedges and
rushes. Mean peat thickness is about 6.50 m (Kilian et al., 2003). At the SkyI and PBr2 sites, tephra layers from erup-tions of volcanoes located in the southern Andes had pre-viously been described (Kilian et al., 2003). All bogs are underlain by acidic and base-poor materials (Kleinebecker et al., 2008).
2.2 Field sampling
Field sampling was conducted in March/April 2010 in hol-lows. The water level was determined using piezometers (PVC) of 4 cm diameter, fully slotted and 1 m in depth. Hy-draulic conductivity (kH) was obtained using piezometers
(PVC) of similar design and a slotted segment of 20 cm in 1, 2 or 3 m depth. Values ofkH in the catotelm were
de-termined in slug tests on several occasions using a tempera-ture and air pressure compensated water pressure transducer over several days with a temporal resolution of 1 min (Level-ogger Gold and Barol(Level-ogger, Solinst, Georgetown, Canada), following the Hvorslev method as described in Fetter (2001). This method has been successfully applied in peatland envi-ronments (e.g. Chason and Siegel, 1986; Fraser et al., 2001; Baird et al., 2008).
Peat samples were collected using a Russian peat corer (Eijkelkamp Agrisearch Equipment BV, Giesbeek,
Nether-lands). Cores were extracted to a depth of 300 cm in the SkyII and PBr2 bog and 180 cm in SkyI bog, divided into 10 cm segments and filled in plastic bags (Whirl Paks®, Nasco, Fort Atkinson, USA). Distinct volcanic ash layers were sampled separately. Samples were stored at∼5◦C until freeze drying. Visible plant roots were removed before milling in the lab-oratory. Vegetation samples for isotope measurements and carbon and nitrogen contents were collected at the SkyI bog. To extract greater volumes of pore-water samples for iso-tope measurements on DOM, we applied a pore-water suc-tion sampler consisting of PE-sinter pieces (5×0.5×1 cm) inserted in a 3.50 m long rod at different depths and con-nected by tubing (2.5×4 mm, Polyurethane) to a stop-cock above the peatland surface. Suction samplers were installed at least one day prior to sampling and samples taken over a maximum period of two days by standard PE syringes, discarding the first milliliters of sampled water. The suc-tion technique had a resolusuc-tion of 20 cm to a max. depth of 195 cm and a 30 cm resolution beyond to max. 345 cm. Sam-ples were transferred in 125 ml PE-flasks (Nalgene), stored at ∼5◦C and analyzed within 12–14 days.
2.3 Analytical procedures
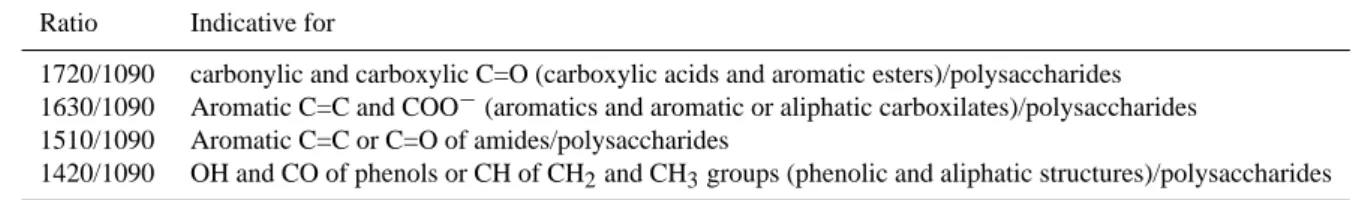
Table 1. Overview of calculated FTIR ratios as a humification index according to Beer et al. (2008) and attribution of structural units in
organic matter FTIR-spectra after Niemeyer et al. (1992) and Senesi et al. (1989).
Ratio Indicative for
1720/1090 carbonylic and carboxylic C=O (carboxylic acids and aromatic esters)/polysaccharides 1630/1090 Aromatic C=C and COO−(aromatics and aromatic or aliphatic carboxilates)/polysaccharides 1510/1090 Aromatic C=C or C=O of amides/polysaccharides
1420/1090 OH and CO of phenols or CH of CH2and CH3groups (phenolic and aliphatic structures)/polysaccharides
information (300–2000 cm−1), absorption peaks indicative of structural units in organic matter were used as an indica-tor for peat organic matter quality and identified according to Senesi et al. (1989) and Niemeyer et al. (1992) as fol-lows: Absorption bands at 950–1170 cm−1 (∼1090 cm−1) were allocated to OH vibrations of polysaccharides. Absorp-tion at ∼1420 cm−1 was ascribed to OH deformations and CO stretch of phenols or CH deformation of CH2 or CH3
groups (phenolic and aliphatic structures), at∼1510 cm−1to
aromatic C=C or to CO of amide groups. The∼1630 cm−1
region is indicative of aromatic C=C and asymmetric COO− group vibrations (lignin and other aromatics and aromatic or aliphatic carboxylates) and ∼1720 cm−1 of CO stretch of carbonyl and carboxyl groups (carboxylic acids and aro-matic esters). To determine relative abundances of functional groups in form of a humification index, ratios between peak intensities for the following wavenumbers (given in cm−1) with respect to polysaccharides (1090 cm−1) were calcu-lated: 1720/1090; 1630/1090; 1510/1090 and 1420/1090 (Holmgren and Norden, 1988; Niemeyer et al., 1992; Beer et al., 2008) (Table 1). These ratios are referred to as a hu-mification index in the context of this paper, because humic substances are typically enriched in carboxylic, aromatic and phenolic moieties compared to polysaccharides (Norden et al., 1986).
For identification of volcanic ash layers, metal concen-trations of the peat samples (Rb, Sr, and Zr) were deter-mined by an energy-dispersive miniprobe multielement an-alyzer (EMMA), which is a small desk-top X-ray Fluores-cence analyzer (XRF) system. Absorption bands of min-erals were identified after Marel and Beutelspacher (1976) in the FTIR-spectra and the affected samples were excluded from the interpretation of the FTIR-based humification in-dices. Furthermore, a set of samples was also examined with X-ray Diffraction (XRD; Siemens D5000, Co Kαradiation; 2θrange 2◦to 80◦) regarding mineral content.
Dissolved organic carbon (DOC) concentrations were quantified in 0.45 µm filtered samples using a total carbon an-alyzer (Shimadzu TOC 5050). Pore-water samples for DOC and dissolved organic nitrogen (DON) isotope analysis were filtered, frozen in an ethanol bath (−60◦C) in round bottom flasks and subsequently freeze-dried.
Ratios of13C/12C and15N/14N and total carbon and nitro-gen were quantified in freeze-dried bulk plant material, peat
and DOM on mass basis using an elemental analyzer (CE in-struments NA 1108, Milano, Italy), connected via ConFlo III interface to a delta S IR-MS (Thermo Finnigan MAT, Bre-men, Germany). Isotope signatures are given in the common δ-notationδ‰ = ((Rsample/Rstandard)−1)×103, relative to
the V-PDB-standard or N2in ambient air.
Statistical analyses were performed using PASW Statistics 18.0 (IBM Corporation). All data were tested for correlation with a level of significance (p) of 0.01 and 0.05 (Pearson, two-tailed).
3 Results
3.1 Water table and hydraulic conductivity
The mean water table level over six weeks of the measure-ment period was 9±3 cm at the PBr2 site, 12±3 cm at the SkyI site, and 15±2 cm at the SkyII site (Table 2). Head recovery in the slug tests was s-shaped. The hydraulic con-ductivities reached 10−6m s−1in 1 m depth and 10−8m s−1 in 2 and 3 m depth. At the PBr2 site hydraulic conductivity in 2 m depth was 10−6m s−1and thus higher than at the other
sites.
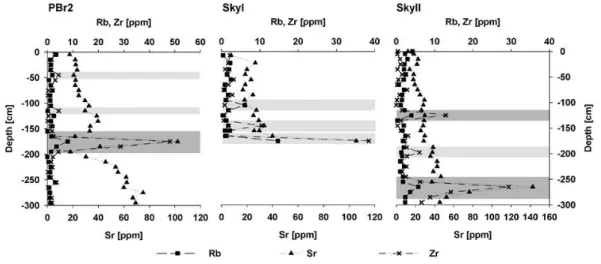
3.2 Identification of ash deposits and sea-spray input
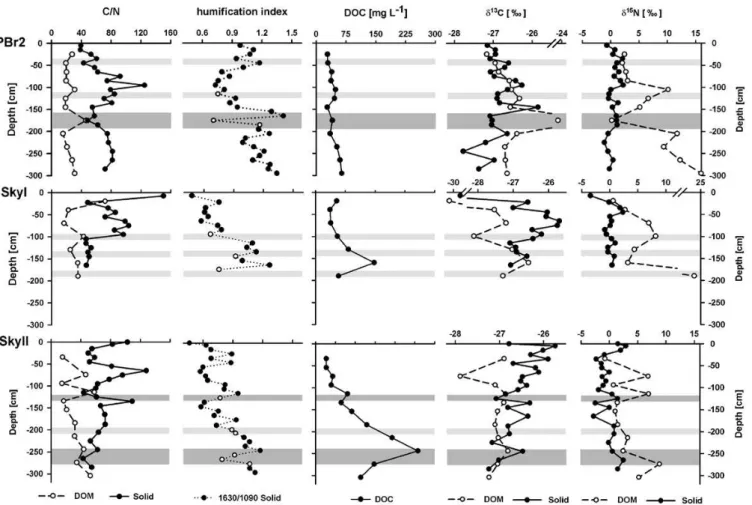
Several tephra layers were identified by elemental concentra-tions of Rubidium, Strontium and Zirconium (Fig. 2). Ash layers in the PBr2 record at around 175 cm and in the SkyII record at around 265 cm could be related to the Mt. Burney eruption 4250 yr BP. In the SkyII record, two other layers in 125 cm and 200 cm depth were identified. Two small Rubid-ium peaks in 45 cm and 115 cm depth at the PBr2 record may also indicate ash layers. At the SkyI site, no tephra layers were evident from trace metal concentrations, except of two small peaks of Rubidium in 105 cm and Zirconium in 145 cm depth. At 180 cm depth, high metal concentrations indicated the influence of the underlying mineral rich sediment.
T. Broder et al.: Peat decomposition records in three pristine ombrotrophic bogs 1483
Fig. 2. Concentrations of Rubidium (solid squares), Strontium (solid triangles) and Zirconium (crosses) in the peat samples in parts per
million. Clearly identified volcanic tephra layers are highlighted in gray. Less well defined tephra layers and underlying sediment in the SkyI record are highlighted by a lighter gray. The thick gray bands in the PBr2 and SkyII records indicate the deposit of the Mt. Burney eruption 4250 yr BP.
Table 2. Mean water table and hydraulic conductivity in 1, 2 and
3 m depth at the three sites.
Site Mean water level kH[m s−1] kH[m s−1] kH[m s−1]
[cm below surface] 1 m 2 m∗ 3 m∗
PBr2 9±3 3.5×10⁻⁶ 1×10⁻⁶ 3×10⁻⁸
SkyI 12±3 1.5×10⁻⁶ 1.5×10⁻⁸ 1.5×10⁻⁸
SkyII 15±2 2.5×10⁻⁶ 3.5×10⁻⁸ 1×10⁻⁸
∗In SkyI 2 m and 3 m Piezometer tubes were installed at the final depth of 1.80 m.
3.3 Spectroscopic characterization of organic matter quality and C/N ratios as indicator for peat decom-position
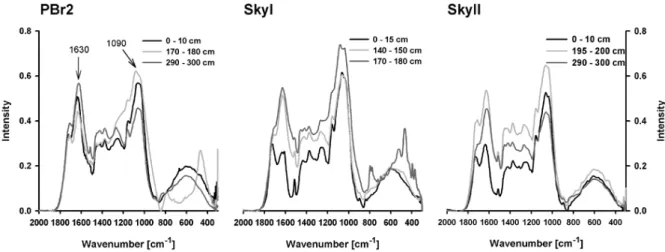
Comparing XRD and FTIR-spectra, we found an interfer-ence mainly of feldspar in the ash layer and in the deep-est peat sample of the SkyI site (FTIR-spectra see Fig. 3). Feldspar bands in FTIR-spectra are found at 400–800 nm−1 and in the Polysaccharide region, thus FTIR results were not interpreted as humification index in case of any our meth-ods indicated influence by ash derived minerals. All ratios (1720/1090, 1630/1090, 1510/1090 and 1420/1090) gener-ally increased with depth, which meant a relative decrease of polysaccharides and a relative increase of aromatic, car-boxylic, amid and phenolic moieties (see Table 1). As an example, the 1630/1090 ratio was correlated (Pearson) with depth with anr of 0.508 (PBr2) to 0.762 (SkyI) at the 0.01 level of significance (data not shown). Highest humification indices were observed at the PBr2 site. As the four FTIR-ratios given in Table 3 highly correlated with each other (r >0.83,p <0.01), only the 1630/1090 profile is shown in Fig. 4. Ratios of C/N of the solid phase inversely correlated with calculated FTIR-ratios at a 0.01 level of significance
using all data (N =60; see Table 3). Correlation coeffi-cients ranged from−0.310 (PBr2, not significant) to−0.660 (SkyII,p <0.01), reaching−0.777 (SkyI,p <0.01) using data of the individual sites only (not shown) and distinct de-viations from the inverse relationship were obvious e.g. at the SkyII site below 125 cm and at the PBr2 site below 175 cm (Fig. 4). Compared to FTIR humification indices, C/N ratios were not correlated with depth, except of the record of SkyI. In the PBr2 profile, the humification index was high, along with narrow C/N ratios (∼40) in the top 50 cm, while the in-dex declined to 0.7–0.9 and C/N increased below to >80. From 100 cm downward, this trend reversed and above the volcanic ash layer in 175 cm depth, the humification index peaked again (∼1.3) along with narrow C/N (50–55). In pro-files of the SkyI and SkyII sites, the humification index was quite similar in the upper meter, but generally lower than in the PBr2 profile, and high C/N ratios occurred at the upper-most sample upper-mostly consisting of fresh plant material. Be-neath, in the SkyI record the index sharply increased and C/N decreased to a plateau. In the SkyII peat, the humifi-cation index was lowest compared to the other sites, gener-ally increasing with depth, but peaks seemed to be positioned near ash layers (Fig. 4). Ratios of C/N were mostly inversely related to the humification index down to a depth of 150 cm. Below, C/N ratios decreased only slightly with depth, in spite of consistently increasing humification.
3.4 Dissolved organic carbon (DOC)
Table 3. Correlation coefficients after Pearson (r), withN as number of sample. Asterisks indicate different levels of significance. Only significant correlations are shown.
FTIR 1720/1090 FTIR 1630/1090 FTIR 1510/1090 FTIR 1420/1090
FTIR 1720/1090 r – N
FTIR 1630/1090 r 0.937b –
N 77
FTIR 1510/1090 r 0.834b 0.933b –
N 77 77
FTIR 1420/1090 r 0.921b 0.972b 0.974b –
N 77 77 77
DOC [mg l−1] r 0.505b 0.452a
N 29 29
Peat N [%] r 0.571b 0.625b 0.549b 0.540b
N 60 60 60 60
Peat C [%] r 0.715b 0.655b 0.566b 0.653b
N 60 60 60 60
δ13C [‰] r −0.311a −0.303a −0.357b −0.325a
N 60 60 60 60
Peat C/N r −0.446b −0.546b −0.490b −0.469b
N 60 60 60 60
aCorrelation is significant on a level of 0.05 (2-tailed).bCorrelation is significant on a level of 0.01 (2 tailed).
Fig. 3. FTIR-spectra of peat samples from the three bogs in different depths. Chosen samples represent upper, less decomposed peat
(0–10 cm), deeper, highly decomposed peat and samples influenced by ash layer or underlying sediment (Pbr2 170–180 cm and SkyI 170– 180 cm).
PBr2 site, concentrations were lowest, increased little with depth up to a concentration of 64 mg l−1and followed more
the pattern of C/N. In contrast, at the Sky sites, DOC concen-trations followed the trend of the FTIR humification index. Concentrations of DOC at the SkyI site peaked at 160 cm near the peat base at 148 mg l−1. The SkyII bog showed highest concentrations and the greatest gradient of all sites and peaked at 245 cm depth at 258 mg l−1. This peak coin-cided with a volcanic ash layer and a high degree of humifi-cation. Below this ash layer DOC concentrations decreased
again. Values of C/N of the DOC were generally lower than C/N in the solid phase (Fig. 4).
3.5 Carbon and nitrogen Isotope signatures
T. Broder et al.: Peat decomposition records in three pristine ombrotrophic bogs 1485
Fig. 4. C/N ratios of solid peat and DOM, FTIR derived humification indices (ratios of absorption at wavenumbers 1630/1090), DOC
concentrations,δ13C andδ15N of solid peat and DOM at the sites PBr2 (top), SkyI (middle), and SkyII (bottom). Grey bands denote ash layers. Open symbols in profiles of humification indices indicate samples possibly influenced by ash deposits and need to be interpreted with caution.
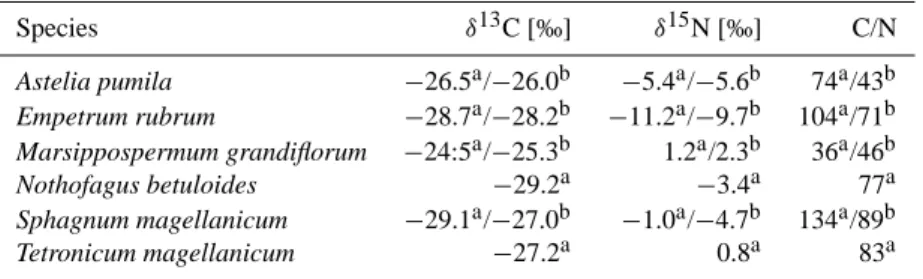
correlations are thus not presented. Especially in uppermost samples and near ash layers (PBr2, SkyII) contrasting trends occurred. At the SkyI site,δ13C values increased to a max-imum of−25.7 ‰ at 75 cm and decreased again below, fol-lowing the C/N pattern. At the SkyII site, signatures on av-erage decreased with depth and only partly followed the C/N pattern. In the PBr2 record, there was no trend inδ13C values over depth and theδ13C pattern partly followed C/N ratios, partly the humification index. Isotope signatures of vegeta-tion samples varied between−24.5 ‰ and−29.2 ‰ for car-bon and between−11.2 ‰ to 1.2 ‰ for nitrogen (Table 4). The δ15N signatures in the peat solid phase fluctuated be-tween−3 ‰ and +3 ‰ over depth and could not be related to any decomposition index.
Values ofδ13C in the DOC fraction ranged from−28.1 to−24.4 ‰. Values at the PBr2 site were again less neg-ative (∼−26.7 ‰) compared to the other two bogs (SkyI ∼−27.3 ‰ and SkyII∼−27.1 ‰). Highest13C content co-incided with presence of an ash layer at 175 cm (PBr2) or 250 cm (SkyII), strongest13C depletion was observed in the
upper profile at the Sky bogs. Values ofδ13C for DOC were similar or more negative than for the solid peat at the SkyI and the SkyII site. Contrarily, at the PBr2 site,δ13C of DOC were either similar to or less negative compared to solid peat carbon.
DON was consistently and increasingly enriched in15N with depth by 2 to 15 ‰ compared to solid phase nitro-gen. Values ofδ15N in DON were inversely correlated with solid phaseδ15N at the PBr2 site (p <0.05), and positively correlated with the FTIR derived humification index for the lumped dataset and for the PBr2 site (p <0.01 andp <0.05, respectively).
4 Discussion
4.1 Peat decomposition
Table 4. Carbon and nitrogen isotope signatures and C/N of different plants of the SkyI site in comparison to values evaluated by
Kleinebecker et al. (2009) at bogs in southern Patagonia.
Species δ13C [‰] δ15N [‰] C/N
Astelia pumila −26.5a/−26.0b −5.4a/−5.6b 74a/43b
Empetrum rubrum −28.7a/−28.2b −11.2a/−9.7b 104a/71b
Marsippospermum grandiflorum −24:5a/−25.3b 1.2a/2.3b 36a/46b
Nothofagus betuloides −29.2a −3.4a 77a
Sphagnum magellanicum −29.1a/−27.0b −1.0a/−4.7b 134a/89b
Tetronicum magellanicum −27.2a 0.8a 83a
athis study (standard error for repeated measurements ofδ15N:<0.5‰ andδ13C:<0.25‰)bmean values from Kleinebecker et al. (2009); C/N was calculated by mean total carbon and nitrogen content.
a generally increasing humification index with depth at all three sites. This pattern had previously been reported for northern temperate peatlands (Beer et al., 2008; Cocozza et al., 2003). We also expected the C/N ratio as an indicator of peat mass loss during decomposition (Kuhry and Vitt, 1996) to be inversely related to humification, i.e. lower C/N val-ues with an increasing humification index. Indeed these two parameters were negatively correlated at our sites (C/N to 1630/1090; r=0.546, see Table 3). However, in contrast to the FTIR-ratios, C/N ratios were not significantly corre-lated with depth, and deviations of the two decomposition parameters occurred as reported in the study of Borgmark and Schoning (2006). Ratios of C/N mainly ranged from 40 to 100, which is comparable to previously reported val-ues for bog vegetation and peat (e.g. Hornibrook et al., 2000; Biester et al., 2003; Malmer and Holm, 1984). Lowest hu-mification indices of the three investigated bogs occurred at the Sphagnum dominated SkyII bog, probably as Sphagnum yields refractory litter of high polyphenol content and high C/N ratios (Bragazza et al., 2007). In both Sky bogs a steep increase of humification (∼0.5 to 0.8) and decrease in C/N was detected down to depths of 20–40 cm, as decomposition is typically fast in the unsaturated zone (Clymo, 1984; Kuhry and Vitt, 1996). This was less obvious in the PBr2 profile, where high humification indices and low C/N ratio values occurred in the upper 50 cm, suggesting increased decom-position and less peat accumulation in the last hundreds of years. Humification indices from FTIR measurements in the peat of the PBr2 site (0.7 to 1.4) exceeded values observed at the other sites, but were still lower compared to values re-ported by Beer et al. (2008) for the Canadian Mer Bleue Bog (1.00 to 1.73 from 50 to 330 cm depth).
Changes in the humification index are typically inter-preted to represent changes in decomposition processes in the acrotelm and therefore changes in environmental conditions, i.e. different climate and resulting differences in decomposi-tion and peat accumuladecomposi-tion (Borgmark and Schoning, 2006; Kuhry and Vitt, 1996; McCulloch and Davies, 2001).
In the SkyI bog two different phases of decomposition oc-curred based on both the humification index and C/N ratio.
In the upper peat profile from 30–100 cm the humification index was low, around 0.7, and C/N high, between 60 and 100. This suggests rapid peat growth under wet conditions (Borgmark and Schoning, 2006; Kuhry and Vitt, 1996). Be-low 100 cm peat decomposition was more advanced, which may indicate that the bog was drier during this time period and the peat exposed to aerobic decay for longer periods of time (Borgmark and Schoning, 2006). On the other hand the deeper peat may also have originated from a minerotrophic fen, as described in Kilian et al. (2003) for the center of the bog.
In contrast, at the PBr2 site peat was more decomposed in the upper 75 cm and below 150 cm, i.e. C/N ratios were low and humification index high. For the uppermost peat and minding current peat forming vegetation containing sedges and rushes with lower C/N, this could be due to more easily decomposable litter. The obvious differences in vegetation were explained by less precipitation and higher nutrient sup-ply through sea spray input at the site (Kleinebecker et al., 2007, 2008). The increase in decomposition could also be caused by temporarily drier conditions at the site (Borgmark and Schoning, 2006), as would be supported byδ13C results (see below). Peat was particularly strongly decomposed near the ash layer at 175 cm. Between 75 and 150 cm depth peat had apparently accumulated more rapidly, as we infer from high C/N ratios and a low humification index. Biester et al. (2003) reported similar C/N ratios for the PBr2 site and found the same pattern of decomposition. In this study, the authors attributed changes in C/N ratios primarily to changes in bog wetness and associated changes in decomposition, but also hypothesized a stimulating effect of ash deposition on peat decomposition.
T. Broder et al.: Peat decomposition records in three pristine ombrotrophic bogs 1487
Unfortunately, as no plant macrofossil records exist for the sites, effects of shifts in vegetation and thus litter input as possible causes cannot be ruled out.
4.2 Decomposition and isotopic signatures of solid peat
Carbon isotope ratios in the solid phase varied only in a narrow range of 2 ‰ around−26.5 ‰, despite larger rela-tive differences of decomposition degree with depth. Dif-ferences between the investigated sites were small. Values and variation ofδ13C fell into the range found in our vegeta-tion and reported for Sphagnum and other vegetavegeta-tion (Horni-brook et al., 2000; Rice and Giles, 1996; Price et al., 1997; Kleinebecker et al., 2009). With few exceptions peat was generally depleted in13C with depth. Asδ13C values were mostly low in more decomposed peat and decomposition processes should result in δ13C enrichment in the residual peat (Nadelhoffer and Fry, 1988; Novak et al., 1999), the δ13C record was thus not the result of decomposition (see also Jones et al., 2010). It probably reflects other factors, such as changes in the vegetation (Hornibrook et al., 2000), moisture (Novak et al., 2010; Loisel et al., 2010) or temper-ature (Jedrysek and Skrzypek, 2005; Skrzypek et al., 2007) during peat formation. Drier or warmer conditions, for ex-ample, lead to a more negative carbon isotope signature in bulk peat stemming from moss litter according to the latter studies. Dry conditions would also result in faster decompo-sition, i.e. lower C/N ratios and high humification indices in the peat record (Borgmark and Schoning, 2006). Thus, com-paringδ13C data and decomposition indices, dry phases may be postulated for the upper meter and below 150 cm at the PBr2 site, below 100 cm at the SkyI site and below 200 cm at the SkyII site.
Values ofδ13C in peat can, however, also be affected by plant uptake of recycled carbon from methane, an effect that is highly variable (Price et al., 1997; Raghoebarsing et al., 2005), but may especially occur under warmer and wetter conditions (Jones et al., 2010). Furthermore, lowδ13C val-ues, as observed at the bottom part of the SkyI profile, could also be due to a minerotrophic origin of the peatland, as low δ13C in bulk peat were also observed in a minerotrophic site (Knorr et al., 2008) or in phases of minerotrophy (Jones et al., 2010). To infer climatic signals from peat profiles with-out reservations is thus difficult and should not be based on one index of decomposition or isotope records only.
Values ofδ15N in the solid phase ranged from−3 to +3 ‰, as also observed by Novak et al. (1999), but were neither re-lated to decomposition degree nor to N contents. Greatest changes occurred in the upper 5–10 cm, which is probably due to the comparably wide range ofδ15N of the vegetation (Table 4) (Kleinebecker et al., 2009). Deeper into the peat δ15N values were rather constant around 0 ‰. This is not sur-prising, as atmospheric N was probably the primary N source (Jones et al., 2010). It has to be noted, though, that data on N fixation activity and its contribution to total N inputs in
peat-lands are scarce (e.g. Kravchenko and Doroshenko, 2003). Only fewδ15N values have been reported so far for the in-vestigated depths and the use ofδ15N measurements to trace decomposition in solid peat is so far not well constrained.
4.3 Volcanic ash layers and their impact on decomposition
Kilian et al. (2003) investigated ash layers at the PBr2 and SkyI sites. The most prominent ash layer in these bogs orig-inated from an eruption of Mt. Burney dated to 4254±120 cal. yr BP in Kilian et al. (2003). We identified this layer due to its thickness in 175 cm depth at the PBr2 and 265 cm in the SkyII record. All other volcanic eruptions, which could be recorded in our peat cores led to less ash deposition, were dispersed by root growth after deposition, and could not be easily distinguished. Therefore, we could use the Mt. Bur-ney ash layer to compare peat accumulation for the latter two sites. In the SkyI record, no such prominent ash layer oc-curred as expected from the Mt. Burney eruption.
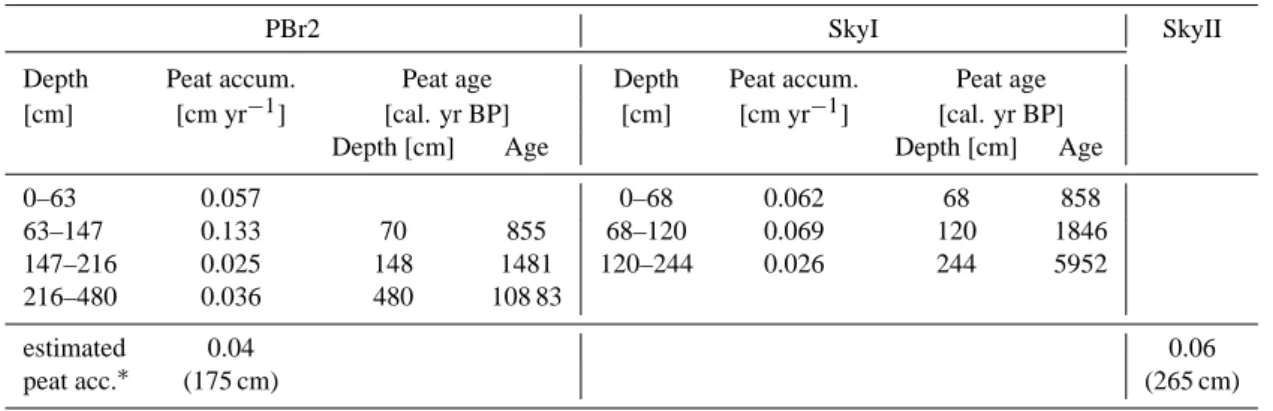
Biester et al. (2003) reported peat accumulation rates for the PBr2 and SkyI bog (Table 5). The rates are in agreement with our interpretations because the accumulation rates at a site were low when we found more decomposed peat. The authors reported very low peat accumulation just above the Mt. Burney ash layer in their PBr2 profile (147– 216 cm), where the peat was most strongly decomposed in this study. Phases of the higher accumulation rates coincided with phases of lower peat decomposition. No accumulation rates are available for the SkyII bog, but comparing the depth of the 4250yr BP tephra layer, it occurred at 265 cm depth, ∼90 cm deeper than in the PBr2 bog. This indicates a greater overall accumulation of peat over the last 4000 yr, which is in accordance with the lower degree of decomposition in the SkyII bog. Using the Mt. Burney ash layer as a reference the SkyII bog on average accumulated about 0.06 cm yr−1 and the PBr2 bog 0.04 cm yr−1from that time on (Table 1).
Table 5. Peat accumulation rates for the PBr2 and SkyI bogs from Biester et al. (2003) and peat ages from Kilian et al. (2003) since the
beginning of ombrotrophic peat growth. Mean estimated peat accumulation rates determined in this study for PBr2 and SkyII are given at the table bottom.
PBr2 SkyI SkyII
Depth Peat accum. Peat age Depth Peat accum. Peat age [cm] [cm yr−1] [cal. yr BP] [cm] [cm yr−1] [cal. yr BP]
Depth [cm] Age Depth [cm] Age
0–63 0.057 0–68 0.062 68 858
63–147 0.133 70 855 68–120 0.069 120 1846 147–216 0.025 148 1481 120–244 0.026 244 5952 216–480 0.036 480 108 83
estimated 0.04 0.06
peat acc.∗ (175 cm) (265 cm)
∗Calculated by the depth of the Mt. Burney eruption ash deposit (values given in brackets) divided by time (4250 yr BP according to Kilian et al., 2003).
from decomposing plant material after volcanic ash deposi-tion. After deposition, alkali loss is a typical phenomenon due to glass alteration of the tephra (Kilian et al., 2003 and references therein). An input of electron acceptors, such as sulfate, could further lead to alkalinity production during re-duction under anaerobic conditions (McLaughlin and Web-ster, 2010), resulting in higher pH and a faster decomposi-tion.
McCulloch and Davies (2001) investigated a bog nearby the PBr2 site at Puerto del Hambre and interpreted phases of highly humified peat as a result of drier climatic conditions. Climatic changes should have affected all three sites in a sim-ilar manner, and indeed decomposition indices and carbon stable isotope signatures support dryer or warmer conditions and intense decomposition above the Mount Burney ash de-posit at the SkyII and PBr2 sites. Although these interpre-tations may be plausible it seems unlikely that paleoclimatic variations are the sole explanation of the decomposition pat-terns because the three sites’ records are not very similar. In our profiles, interpretation of both the decomposition in-dices andδ13C signals in the upper 75 cm of the PBr2 site would suggest drier conditions, whereas the opposite con-clusion must be drawn from the SkyII site (Fig. 4). Thus, climate induced signals at the sites may be masked by local variations in decomposition and influence of ash layers. Most obvious, diminished peat accumulation in the upper profile due to strong decomposition and drier conditions at the PBr2 site was not observed at the other sites. Decomposition in-dices and stable isotope records seemed to reflect changes in rather local, site-specific factors.
4.4 Decomposition versus DOC concentrations and DOM isotopic signatures
In spite of differences in peat decomposition degree, DOC concentrations were very similar in the upper meter of all three sites. Deeper into the peat larger differences occurred. DOC concentrations observed at the PBr2 site agreed with
reported DOC concentration ranges of 20 to 60 mg l−1 for northern peatlands (Blodau, 2002). At the Sky sites con-centrations increased with depth by a factor of 3 (SkyI) and 5 (SkyII) and reached >250 mg l−1. DOC concentrations
>200 mg l−1 have rarely been reported (e.g. in Clymo and
Bryant, 2008).
A negative relation of DOM concentrations with the de-gree of peat decomposition has been reported (Kalbitz and Geyer, 2002; Biester et al., 2006). Generally, concentrations at the PBr2 site, with the highest humification index, were also low. Concentrations positively correlated with C/N ra-tios (r=0.712, p <0.05), as described in the study of Bi-ester et al. (2006) before for this site. Highest DOC con-centrations occurred at the SkyII site, with lowest humifi-cation index. In both Sky sites, however, concentrations correlated positively with the FTIR derived humification in-dex (1630/1090 ratio,r=0.839,p <0.01 for the SkyII site; r=0.839, p <0.05 for the SkyI site), which is in conflict with the mentioned earlier work.
A redistribution of DOM could explain this discrepancy, but seems unlikely based on the low hydraulic conductivi-ties and the low diffusion coefficient of DOM in the deeper peat (Beer et al., 2008; Biester et al., 2006; Cornel et al., 1986). Hydraulic conductivities ranged from 10−8 to 10−6m s−1and were low compared to other peat bogs, where often 10−6m s−1 to 10−5m s−1 were found (Baird et al., 2008; Chason and Siegel, 1986). Elevated DOM concen-trations occurred near ash layers, in the deeper peat poten-tially formed under minerotrophic conditions, and in zones of intense decomposition at the Sky sites, but not at the PBr2 bog. The factors that control DOC concentration are thus dif-ficult to identify from our data and the relationship between DOM concentrations and decomposition indices of solid peat seems to be poorly constrained.
T. Broder et al.: Peat decomposition records in three pristine ombrotrophic bogs 1489
ratio in the DOM were correlated (p <0.05) at the PBr2 and SkyI sites but not at the SkyII site. Clymo and Bryant (2008) found DOM to be consistently enriched in13C compared to the solid peat. In our data, in the Sky bogs DOM was de-pleted in13C, but approached values of the solid phase with depth. In the more decomposed peat of the PBr2 bog, DOM became enriched in 13C with depth compared to the solid phase. Thus, there was a relative enrichment of13C in DOM with depth, indicating preferential loss of12C during micro-bial modification. This was further supported by low C/N and increasing enrichment of15N in DOM. The latter indi-cates a repeated microbial recycling of N in DOM, which would be in line with a strong N deficiency at the sites and an enrichment of15N due to higher humification (Dijkstra et al., 2008). In contrast, Kalbitz and Geyer (2002) found low δ15N values in highly humified DOM, but this may be ex-plained by a varying contribution of DON supply from either the solid phase or organic matter mineralization.
5 Conclusions
The study demonstrated both similarities and differences in peat decomposition records of the investigated peatlands. The deep peat was most strongly decomposed at all sites as indicated by the FTIR humification index, but small variations over depth reflected frequent changes in control-ling conditions over time. As the individual decomposition records of the sites differed in spite of their proximity, an in-terpretation of the data with respect to bog wetness and its impact on decomposition seems to be limited by local, site specific factors. Advanced decomposition within the depth profiles seemed to be related to ash deposits and possibly also to the effects of sea spray input, resulting in concomitant changes in vegetation litter chemistry, nutrient contents or electron acceptor inputs for anaerobic respiration. Regarding decomposition indices, not all phases of increased decompo-sition and – following common interpretation ofδ13C data – not all phases of drier or warmer conditions, respectively, were reflected in all profiles. Effects of ash deposits or also phases of minerotrophy may thus have been more important for changes in decomposition indices andδ13C of the peat. Relative enrichment of 13C in DOM compared to the sur-rounding peat reflected a preferential loss of12C due to min-eralization of DOM. Enrichment of15N in DOM and
consis-tent trends with solid peat C/N ratios over depth suggested microbial recycling of N under N deficient conditions. DOM concentration did not serve as a decomposition index in a consistent way.
Acknowledgements. This study was in part supported by Deutsche
Forschungsgemeinschaft (DFG) grants to H. Biester and C. Blodau, a travel grant of the Deutsche Gesellschaft f¨ur Limnologie (DGL) to K. H. Knorr. Stable isotope measurements were conducted at the BayCEER Laboratory of Isotope-Biogeochemistry, headed by Gerhard Gebauer. The assistance of Silke Hammer, Martina Rohr,
Karin S¨ollner, Heidi Zier, Yvonne Hermanns and Ina Reisen is greatly acknowledged.
Edited by: R. Conant
References
Aselmann, I. and Crutzen, P. J.: Global distribution of natural fresh-water wetlands and rice-paddies, their net primary productivity, seasonality and possible methane emissions, J. Atmos. Chem., 8, 307–358, 1989.
Baird, A. J., Eades, P. A., and Surridge, B. W. J.: The hydraulic structure of a raised bog and its implications for ecohydrologi-cal modelling of bog development, Ecohydrology, 1, 289–298, doi:10.1002/eco.33, 2008.
Beer, J. and Blodau, C.: Transport and thermodynam-ics constrain belowground carbon turnover in a north-ern peatland, Geochim. Cosmochim. Acta, 71, 2989–3002, doi:10.1016/j.gca.2007.03.010, 2007.
Beer, J., Lee, K., Whiticar, M., and Blodau, C.: Geochemical con-trols on anaerobic organic matter decomposition in a northern peatland, Limnol. Oceanogr., 53, 1393–1407, 2008.
Biester, H., Martinez-Cortizas, A., Birkenstock, S., and Kilian, R.: Effect of peat decomposition and mass loss on historic mercury records in peat bogs from patagonia, Environ. Sci. Technol., 37, 32–39, doi:10.1021/es025657u, 2003.
Biester, H., Keppler, F., Putschew, A., Martinez-Cortizas, A., and Petri, M.: Halogen retention, organohalogens, and the role of organic matter decomposition on halogen enrichment in two chilean peat bogs, Environ. Sci. Technol., 38, 1984–1991, doi:10.1021/es0348492, 2004.
Biester, H., Selimovic, D., Hemmerich, S., and Petri, M.: Halo-gens in pore water of peat bogs – the role of peat decompo-sition and dissolved organic matter, Biogeosciences, 3, 53–64, doi:10.5194/bg-3-53-2006, 2006.
Blodau, C.: Carbon cycling in peatlands – a review of processes and controls, Environ. Rev., 10, 111–134, doi:0.1139/A02-004, 2002.
Borgmark, A. and Schoning, K.: A comparative study of peat proxies from two eastern central swedish bogs and their rela-tion to meteorological data, J. Quaternary Sci., 21, 109–114, doi:10.1002/jqs.959, 2006.
Bragazza, L., Siffi, C., Iacumin, P., and Gerdol, R.: Mass loss and nutrient release during litter decay in peatland: The role of mi-crobial adaptability to litter chemistry, Soil Biol. Biochem., 39, 257–267, doi:10.1016/j.soilbio.2006.07.014, 2007.
Bridgham, S. D., Pastor, J., Updegraff, K., Malterer, T. J., Johnson, K., Harth, C., and Chen, J. Q.: Ecosystem control over tempera-ture and energy flux in northern peatlands, Ecol. Appl., 9, 1345– 1358, 1999.
Chason, D. B. and Siegel, D. I.: Hydraulic conductivity and re-lated physical properties of peat, lost river peatland, northern Minnesota, Soil Sci., 142, 91–99, 1986.
Clymo, R. S.: The limits to peat bog growth, Philos. T. Roy. Soc. B, 303, 605–654, 1984.
Cocozza, C., D’Orazio, V., Miano, T. M., and Shotyk, W.: Char-acterization of solid and aqueous phases of a peat bog profile using molecular fluorescence spectroscopy, ESR and FT-IR, and comparison with physical properties, Org. Geochem., 34, 49–60, 2003.
Cornel, P. K., Summers, R. S., and Roberts, P. V.: Diffusion of humic-acid in dilute aqueous solution, J. Colloid Interface Sci., 110, 149–164, 1986.
Damman, A. W. H.: Regulation of nitrogen removal and retention in
sphagnum bogs and other peatlands, Oikos, 51, 291–305, 1988.
Dijkstra, P., LaViolette, C. M., Coyle, J. S., Doucett, R. R., Schwartz, E., Hart, S. C., and Hungate, B. A.: 15N enrich-ment as an integrator of the effects of C and N on microbial metabolism and ecosystem function, Ecol. Lett., 11, 389–397, doi:10.1111/j.1461-0248.2008.01154.x, 2008.
Fetter, C. W.: Applied hydrogeology, 4 ed., Prentice Hall, Upper Saddle River, NJ, 598 pp., 2001.
Fraser, C. J. D., Roulet, N. T., and Lafleur, M.: Groundwater flow patterns in a large peatland, J. Hydrol., 246, 142–154, 2001. Freeman, C., Ostle, N., and Kang, H.: An enzymic “latch” on a
global carbon store – a shortage of oxygen locks up carbon in peatlands by restraining a single enzyme, Nature, 409, 149–149, 2001.
Frolking, S., Roulet, N. T., Moore, T. R., Richard, P. J. H., Lavoie, M., and Muller, S. D.: Modeling northern peatland decomposi-tion and peat accumuladecomposi-tion, Ecosystems, 4, 479–498, 2001. Godoy, R., Paulino, L., Oyarz´un, C., and Boeckx, P.:
Atmo-spheric N deposition in central and southern Chile: An overview, Gayana. Bot´anica, 60, 47–53, 2003.
Heusser, C. J., Heusser, L. E., Lowell, T. V., Moreira, A., and Mor-eira, S.: Deglacial palaeoclimate at puerto del hambre, subantarc-tic Patagonia, Chile, J. Quaternary Sci., 15, 101–114, 2000. Hogg, E. H.: Decay potential of hummock and hollow sphagnum
peats at different depths in a swedish raised bog, Oikos, 66, 269– 278, 1993.
Holmgren, A. and Norden, B.: Characterization of peat samples by diffuse reflectance FT-IR spectroscopy, Appl. Spectrosc., 42, 255–262, 1988.
Hornibrook, E. R. C., Longstaffe, F. J., Fyfe, W. S., and Bloom, Y.: Carbon-isotope ratios and carbon, nitrogen and sulfur abun-dances in flora and soil organic matter from a temperate-zone bog and marsh, Geochem. J., 34, 237–245, 2000.
Hotes, S., Grootjans, A. P., Takahashi, H., Ekschmitt, K., and Poschlod, P.: Resilience and alternative equilibria in a mire plant community after experimental disturbance by volcanic ash, Oikos, 119, 952–963, doi:10.1111/j.1600-0706.2009.18094.x, 2010.
IFM-GEOMAR, SFB 574, Leibnitz Institut f¨ur Meereswis-senschaften an der Universit¨at Kiel, https://sfb574.ifm-geomar. de/gmt-maps, last access: February 2011.
Jedrysek, M. O. and Skrzypek, G.: Hydrogen, carbon and sulphur isotope ratios in peat: The role of diagenessis and water regimes in reconstruction of past climates, Environ. Chem. Lett., 2, 179– 183, doi:10.1007/s10311-004-0093-4, 2005.
Jones, M. C., Peteet, D. M., and Sambrotto, R.: Late-glacial and holoceneδ15N andδ13C variation from a kenai peninsula, alaska peatland, Paleogeogr. Paleoclimatol. Paleoecol., 293, 132–143, doi:10.1016/j.palaeo.2010.05.007, 2010.
Kalbitz, K. and Geyer, S.: Different effects of peat degradation on dissolved organic carbon and nitrogen, Org. Geochem., 33, 319– 326, 2002.
Kalbitz, K., Geyer, W., and Geyer, S.: Spectroscopic properties of dissolved humic substances – a reflection of land use history in a fen area, Biogeochemistry, 47, 219–238, 1999.
Kalbitz, K., Geyer, S., and Gehre, M.: Land use impacts on the isotopic signature (13C,14C,15N) of water-soluble fulvic acids in a german fen area, Soil Sci., 165, 728–736, 2000.
Kilian, R., Hohner, M., Biester, H., Wallrabe-Adams, H. J., and Stern, C. R.: Holocene peat and lake sediment tephra record from the southernmost chilean andes (53–55◦S), Rev. Geol. Chile, 30, 23–37, 2003.
Kleinebecker, T., Holzel, N., and Vogel, A.: Gradients of continen-tality and moisture in south patagonian ombrotrophic peatland vegetation, Folia Geobot., 42, 363–382, 2007.
Kleinebecker, T., Holzel, N., and Vogel, A.: South patagonian om-brotrophic bog vegetation reflects biogeochemical gradients at the landscape level, J. Veg. Sci., 19, 151–160, doi:10.3170/2008-8-18370, 2008.
Kleinebecker, T., Schmidt, S. R., Fritz, C., Smolders, A. J. P., and H¨olzel, N.: Prediction ofδ13C andδ15N in plant tissues with near-infrared reflectance spectroscopy, New Phytol., 184, 732– 739, doi:10.1111/j.1469-8137.2009.02995.x, 2009.
Knorr, K.-H., Glaser, B., and Blodau, C.: Fluxes and 13C iso-topic composition of dissolved carbon and pathways of methano-genesis in a fen soil exposed to experimental drought, Biogeo-sciences, 5, 1457–1473, doi:10.5194/bg-5-1457-2008, 2008. Kravchenko, I. K. and Doroshenko, E. V.: Nitrogen-fixing activity
in peat soils from a raised bog, Microbiology, 72, 98–102, 2003. Kuhry, P. and Vitt, D. H.: Fossil carbon/nitrogen ratios as a measure
of peat decomposition, Ecology, 77, 271–275, 1996.
Laiho, R.: Decomposition in peatlands: Reconciling seemingly contrasting results on the impacts of low-ered water levels, Soil Biol. Biochem., 38, 2011–2024, doi:10.1016/j.soilbio.2006.02.017, 2006.
Loisel, J., Garneau, M., and H´elie, J. F.: Sphagnumδ13C val-ues as indicators of palaeohydrological changes in a peat bog, Holocene, 20, 285–291, 2010.
Malmer, N. and Holm, E.: Variation in the C/N-quotient of peat in relation to decomposition rate and age determination with210Pb, Oikos, 43, 171–182, 1984.
Marel, H. W. v. d. and Beutelspacher, H.: Atlas of infrared spec-troscopy of clay minerals and their admixtures, Elsevier Scien-tific Publishing Company, Amsterdam, 396 pp., 1976.
Markgraf, V.: Paleoenvironments and paleoclimates in tierra del fuego and southernmost patagonia, South America, Paleogeogr. Paleoclimatol. Paleoecol., 102, 53–68, 1993.
McCulloch, R. D. and Davies, S. J.: Late-glacial and holocene palaeoenvironmental change in the central strait of magellan, southern patagonia, Paleogeogr. Paleoclimatol. Paleoecol., 173, 143–173, 2001.
McLaughlin, J. W. and Webster, K. L.: Alkalinity and acidity cy-cling and fluxes in an intermediate fen peatland in northern On-tario, Biogeochemistry, 99, 143–155, 2010.
T. Broder et al.: Peat decomposition records in three pristine ombrotrophic bogs 1491
Niemeyer, J., Chen, Y., and Bollag, J. M.: Characterization of humic acids, composts, and peat by diffuse reflectance fourier-transform infrared-spectroscopy, Soil Sci. Soc. Am. J., 56, 135– 140, 1992.
Norden, B., Fyfe, C. A., and McKinnon, M. S.:13C CP/MAS NMR study of peat in the solid state, International Peat Journal, 1, 153– 164, 1986.
Novak, M., Buzek, F., and Adamova, M.: Vertical trends in δ13C,δ15N andδ34S ratios in bulk sphagnum peat, Soil Biol. Biochem., 31, 1343–1346, 1999.
Novak, M., Zemanova, L., Buzek, F., Jackova, I., Adamova, M., Komarek, A., Vile, M. A., Kelman Wieder, R., and Stepanova, M.: The effect of a reciprocal peat transplant between two con-trasting Central European sites on C cycling and C isotope ratios, Biogeosciences, 7, 921–932, doi:10.5194/bg-7-921-2010, 2010. Pancost, R. D., Baas, M., van Geel, B., and Damste, J. S. S.: Response of an ombrotrophic bog to a regional climate event revealed by macrofossil, molecular and carbon isotopic data, Holocene, 13, 921–932, doi:10.1191/0959683603hl674rp, 2003. Price, G. D., McKenzie, J. E., Pilcher, J. R., and Hoper, S. T.: Carbon-isotope variation in sphagnum form hummock-hollow complexes: Implications for holocene climate reconstruction, Holocene, 7, 229–233, 1997.
Raghoebarsing, A. A., Smolders, A. J. P., Schmid, M. C., Rijp-stra, W. I. C., Wolters-Arts, M., Derksen, J., Jetten, M. S. M., Schouten, S., Damste, J. S. S., Lamers, L. P. M., Roelofs, J. G. M., den Camp, H., and Strous, M.: Methanotrophic sym-bionts provide carbon for photosynthesis in peat bogs, Nature, 436, 1153–1156, doi:10.1038/nature03802, 2005.
Rice, S. K. and Giles, L.: The influence of water content and leaf anatomy on carbon isotope discrimination and photosynthesis in
sphagnum, Plant Cell Environ., 19, 118–124, 1996.
Schneider, C., Glaser, M., Kilian, R., Santana, A., Butorovic, N., and Casassa, G.: Weather observations across the southern andes at 53◦S, Phys. Geogr., 24, 97–119, 2003.
Segers, R. and Kengen, S. W. M.: Methane production as a function of anaerobic carbon mineralization: A process model, Soil Biol. Biochem., 30, 1107–1117, 1998.
Senesi, N., Miano, T. M., Provenzano, M. R., and Brunetti, G.: Spectroscopic and compositional comparative characterization of IHSS reference and standard fulvic and humic acids of var-ious origin, Sci. Total Environ., 81–82, 143–156, 1989. Skrzypek, G., Kaluzny, A., Wojtun, B., and Jedrysek, M. O.:
The carbon stable isotopic composition of mosses: A record of temperature variation, Org. Geochem., 38, 1770–1781, doi:10.1016/j.orggeochem.2007.05.002, 2007.