www.hydrol-earth-syst-sci.net/20/27/2016/ doi:10.5194/hess-20-27-2016
© Author(s) 2016. CC Attribution 3.0 License.
Impact of two different types of El Niño events on runoff over the
conterminous United States
T. Tang1, W. Li1, and G. Sun2
1Earth and Ocean Sciences, Nicholas School of Environment, Duke University, Durham, NC 27708, USA
2Eastern Forest Environmental Threat Assessment Center, Southern Research Station, United States Department of
Agriculture, Forest Service, Raleigh, NC 27606, USA Correspondence to:W. Li ([email protected])
Received: 28 June 2015 – Published in Hydrol. Earth Syst. Sci. Discuss.: 4 September 2015 Accepted: 15 December 2015 – Published: 15 January 2016
Abstract. The responses of river runoff to shifts of large-scale climatic patterns are of increasing concerns to water re-source planners and managers for long-term climate change adaptation. El Niño, as one of the most dominant modes of climate variability, is closely linked to hydrologic extremes such as floods and droughts that cause great loss of lives and properties. However, the different impacts of the two types of El Niño, i.e., central Pacific (CP-) and eastern Pacific (EP-)El Niño, on runoff across the conterminous US (CONUS) are not well understood. This study characterizes the impacts of the CP- and EP-El Niño on seasonal and annual runoff using observed streamflow data from 658 reference gaging stations and the NCAR-CCSM4 model. We found that sur-face runoff responds similarly to the two types of El Niño events in southeastern, central, southern, and western coastal regions, but differently in northeast (NE), Pacific northwest (PNW) and west north central (WNC) climatic zones. Specif-ically, EP-El Niño events tend to bring above-average runoff in NE, WNC, and PNW throughout the year while CP-El Niño events cause below-than normal runoff in the three re-gions. Similar findings were also found by analyzing NCAR-CCSM4 model outputs that captured both the CP- and EP-El Niño events, representing the best data set among CMIP5 models. The CCSM4 model simulates lower runoff values during CP-El Niño years than those in EP-El Niño over all of the three climatic regions (NE, PNW, and WNC) during 1950–1999. In the future (2050–2099), for both types of El Niño years, runoff is projected to increase over the NE and PNW regions, mainly due to increased precipitation (P ). In contrast, the increase of future evapotranspiration (ET) ex-ceeds that of future P, leading to a projected decrease in
runoff over the WNC region. In addition, model analysis in-dicates that all of the three regions (NE, PNW, and WNC) are projected to have lower runoff in CP-El Niño years than in EP-El Niño years. Our study suggests that the US water re-sources may be distributed more unevenly in space and time with more frequent and intense flood and drought events. The findings from this study have important implications to water resource management at regional scales. Information gener-ated from this study may help water resource planners to an-ticipate the influence of two different types of El Niño events on droughts and floods across the CONUS.
1 Introduction
of the two types of El Niño on regional hydroclimate are different (Li et al., 2011; Mo, 2010; Yu and Zou, 2013; Yu et al., 2012). For example, the conventional EP-El Niño events caused a northeast-to-southwest, positive anomaly to negative anomaly shift in winter temperature across the US whereas the CP-El Niño events led to a northwest-to-southeast shift pattern (Yu et al., 2012); Mo (2010) reported that the El Niño Southern Oscillation (ENSO) influence on winterP over the southwest US is strengthening, while the impact on P over the Ohio Valley is weakening in recent decades due to the occurrence of the CP-El Niño events. The different impacts of the two types of El Niño are not limited to the US only, but worldwide. Li et al. (2011) concluded that below-normal rainfall is found year round in northern, central, and eastern Amazon during EP-El Niño years while negative rainfall anomalies are observed in most of the Ama-zon during the austral summer wet season during CP-El Niño years. Kumar et al. (2006) suggested that CP-El Niño tends to produce a drought condition in India due to atmo-spheric subsidence. During the late 20th century, the EP-El Niño has become less common while the CP-El Niño has be-come more frequent (Ashok et al., 2007; Kao and Yu, 2009; Kug et al., 2009; Mo, 2010; Yeh et al., 2009). Some recent studies also suggest that the intensity of CP-El Niño events is increasing and the frequency of CP-El Niño will continue to increase in the 21st century (Kim and Yu, 2012; Lee and McPhaden, 2010). Since ENSO is the dominant mode of cli-mate variability (Van Oldenborgh et al., 2005; Yeh et al., 2009) and El Nino events have crucial implications to the terrestrial hydrological cycles, it is important to examine the different responses of runoff to the two types of El Niño events at regional and continental scales.
The regional distributions of runoff are largely controlled by the balances ofP and ET. Runoff not only is an indicator of water availability, but also plays a key role in the global biogeochemical cycle, transporting large amount of particu-lates and dissolved minerals as well as nutrients from land to the ocean (Boyer et al., 2006). It is well-known that cli-mate change has great impacts on runoff and water resources worldwide (Dai et al., 2009; Déry and Wood, 2005; Gerten et al., 2008; Lettenmaier et al., 1994; Petrone et al., 2010; Piao et al., 2010; Xu et al., 2010). These climate-induced changes can, sometimes, result in diverse impacts and risks on re-gional hydrology and water resources (Field et al., 2014). In fact, shifts in runoff patterns have been observed in many re-gions (Barnett et al., 2005). For example, earlier snowmelt events are observed due to increasing temperature in win-ter, which will cause a shift in runoff regime from spring to late winter and thus, a runoff decrease in summer (Burn and Elnur, 2002). During the past half century, as the growing population and increasing demand for freshwater, the avail-ability of freshwater is of great concern to water resource managers and policy-makers in a changing climate (Gleick, 2003; Milliman et al., 2008; Oki and Kanae, 2006; Vörös-marty et al., 2000; Xu et al., 2010). A better understanding
-120 -110 -100 -90 -80 -70 25
30 35 40 45 50
658 runoff stations Water resource region boundary
1
2
3 4
5 7
6 8 9 10
11
12 13 14
15 16 17
18
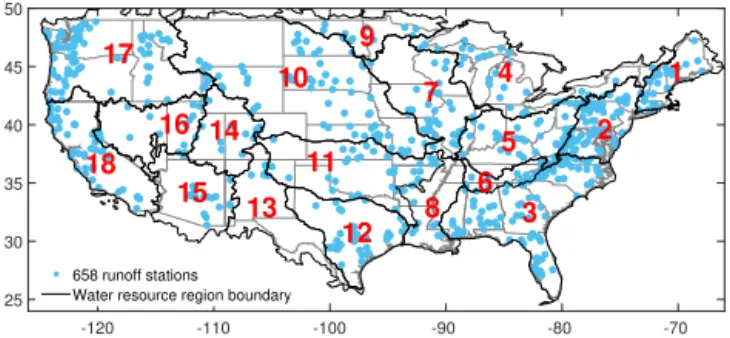
Figure 1.In all, 658 gaging stations (blue dots) and the 18 water
resource regions defined by USGS over the CONUS.
on the response of runoff to the large-scale climatic patterns, especially to the climatic extremes becomes increasingly im-portant.
Several attempts have been made to investigate the impact of El Niño on runoff over the US (Dracup and Kahya, 1994; Guetter and Georgakakos, 1996; Kahya and Dracup, 1993; Piechota et al., 1997; Twine et al., 2005; Zorn and Waylen, 1997). While these studies are informative, they either focus on only one single river basin or do not categorize the El Niño events into two types. To our best knowledge, the different impacts of two types of El Niño on runoff over the CONUS have not been carefully examined.
The overall goal of this study is to characterize the differ-ent impacts of the two types of El Niño evdiffer-ents on regional runoff over the CONUS. We used both measured stream-flow data and long-term CMIP5 modeling output to exam-ine the spatial patterns of hydrologic response to the two different El Niño events. Section 2 describes the data and methods used in this study. In Sect. 3, we present the main results to contrast the different impacts of the two types of El Niño on runoff. Discussions and conclusions are given in Sects. 4 and 5, respectively.
2 Data and methodology 2.1 Data
ET anomalies during the two types of El Niño years are also examined; we use NOAA’s precipitation reconstruction over land (PREC/L) data (Chen et al., 2002) (available at http:// www.esrl.noaa.gov/psd/data/gridded/data.precl.html), which is mainly based on rain gauge observations. ERA-Interim ET data (Uppala et al., 2008), obtained from the European Center for Medium-Range Weather Forecasts (ECMWF), is also employed (available at http://apps.ecmwf.int/datasets/). Compared with ERA-40 (Uppala et al., 2005), ERA-Interim has many improvements, particularly in the hydrologic cycle variables (Uppala et al., 2008). To improve the significance and robustness of the results from observations, the state-of-the-art global climate models (GCMs) participating in the Coupled Model Intercomparison Project Phase 5 (CMIP5) (Taylor et al., 2012) are employed. Eight models, including NCAR-CCSM4, CNRM-CM5, GISS-E2H, GFDL-CM2.1, GFDL-ESM-2G, GFDL-ESM-2M, MPI-ESM-LR and Nor-ESM1-M, are selected based on the studies of Mo (2010) and Kim and Yu (2012), because these model output are considered the best ones to capture both two types of El Niño in intensity and frequency. All of these models are atmospheric-ocean coupled climate models and widely used in climate community. These model outputs are down-loaded from ESGF website (https://pcmdi9.llnl.gov/projects/ esgf-llnl/), including both historical and RCP4.5 output. All of the grid data are re-gridded into the resolution of 0.5◦×0.5◦.
2.2 Methods
A composite method is employed in this study to high-light the common features of runoff, P, and ET during the EP- and CP-El Niño events. The life cycle of El Niño is based on the definition of Trenberth (1997), start-ing from June-July-August (JJA) to September-October-November (SON), December-January-February (DJF) and March-April-May (MAM) in the following year. The ob-served historical El Niño years are referred to the last column (consensus) of Table 1 in Yu et al. (2012). There are four CP-El Niño events (1991–1992, 1994–1995, 2002–2003, 2004– 2005) and two EP-El Niño events (1997–1998, 2006–2007) during the study period. The Monte Carlo technique is used to test whether the runoff anomalies are significantly differ-ent from its climatology (Mo, 2010; Wilks, 2011).
For CMIP5 models, EP- and CP-El Niño events are de-fined using SST anomalies (SSTA) over the Niño 3 (150– 90◦W, 5◦N–5◦S) and Niño 4 (160◦E–150◦W, 5◦N–5◦S)
regions, respectively, following Yeh et al. (2009). Specifi-cally, if the 3-month-running mean of SSTA over Niño 3 re-gions is larger than 0.5◦for at least 5 consecutive months and also larger than that of the Niño 4 region, this year is defined as an EP-El Niño year. Conversely, if the SSTA over Niño 4 region is higher than 0.5◦and larger than that of Niño 3
region, the year will be defined as CP-El Niño year.
25 30 35 40 45
50 (a) CP
-120 -110 -100 -90 -80 -70 25
30 35 40 45
50 (b) EP
Runoff anomaly (mm)
-180 -144 -108 -72 -36 0 36 72 108 144 180
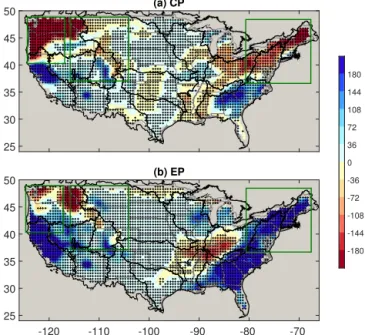
Figure 2.Composite of annual runoff anomaly (unit: mm) for the
two types of El Niño during the period of 1990–2009(a)in CP-El Niño years and(b)in EP-El Niño years.+indicates results at 0.05 significance level based on a Monte Carlo test. Three climate re-gions (NE, PNW, and WNC, based on the climate zones of NOAA; Karl and Koss, 1984) and 18 WRRs are plotted using blue rectan-gles and dark black lines, respectively.
3 Results
3.1 Annual runoff composite
Figure 2 shows the composite of annual runoff anomaly dur-ing CP- and EP-El Niño years. In the CONUS, more gagdur-ing stations show negative anomalies during CP-El Niño years whereas more stations show positive anomalies during EP-El Niño years. Specifically, during CP-El Niño years (Fig. 2a), significant below-average runoff was observed in the whole northern US, with extremely dry conditions of up to −180 mm yr−1, which is roughly −31 % in NE
re-gion and−11 % in Pacific northwest (PNW) region. Above-average runoff is mainly found in the southern US, with the wettest conditions of about 180 mm yr−1in the Gulf of
Mex-ico. During EP-El Niño years (Fig. 2b), positive anomalies are scattered throughout coastal regions, such as NE, south-eastern (SE), west, PNW, and western portion of the west north central (WNC) while negative anomalies are mainly observed in inland areas, especially in central and upper mid-west regions. In addition, comparing Fig. 2a with Fig. 2b, we found that the responses of runoff to the two types of El Niño are similar in the SE, western, and central areas, but different in NE, PNW, and western portions of WNC, which are en-closed by dark blue rectangles in Fig. 2. We will focus on the three climate regions (Karl and Koss, 1984) that have differ-ent response signals during CP- and EP-El Niño years.
NE PNW WNC
mm
-144 -72 0 72 144
(a)
Water resource region
1 2 3 4 5 6 7 8 9 10 11 12 13 14 15 16 17 18
mm
-144 -72 0 72
144 (b)
CP-El Nino
EP-El Nino
Figure 3.Domain-averaged annual runoff anomalies (unit: mm) for
(a)NE, PNW, and WNC climate regions;(b)the 18 WRRs, during CP- and EP-El Niño years.
et al., 1987), the responses of domain-averaged runoff to CP- and EP-El Niño events are calculated separately in the 18 WRRs, along with the domain-averaged runoff anomalies at the NE, PNW, and WNC climate zones (Fig. 3). During CP (EP)-El Niño years, negative (positive) runoff anomalies are observed in all of the three climatic regions (Fig. 3a). Specifically, for the NE region (37–49◦N, 65–80◦W), the
runoff anomalies are −47 and 94 mm yr−1during CP- and
EP-El Niño years, respectively. For the PNW (40–49◦N,
116–125◦W) and WNC (37–49◦N, 104–116◦W) regions,
they are−148 and 148 mm yr−1, and−61 and 54 mm yr−1,
respectively, during CP- and EP-El Niño years. Among the three regions, PNW has the greatest runoff anomaly values, indicating its relatively high sensitivity of annual mean discharges to El Niño events. Figure 3b illustrates the runoff variations for the 18 WRRs during CP- and EP-El Niño years. Among the 18 WRRs, eight regions have the similar responses to the two types of El Niño, i.e., WRR 3, 12, and 18 are characterized by positive anomalies, while WRR 4, 7, 9, 10, and 11, are featured with negative anoma-lies. There are 10 WRRs producing different responses to the two types of El Niño, with six regions showing dry condi-tions in CP-El Niño and wet condicondi-tions in EP-El Niño and four regions showing the opposite response. During CP-El Niño years, 11 out of 18 WRRs (61 %) display a negative runoff anomaly compared to 9 WRRs (50 %) during EP-El Niño years. All of the WRRs in the NE, PNW, and WNC areas show dry condition in CP-El Niño years and wet con-dition in EP-El Niño years, including region 1, 2, 5, 14, 16, and 17. These analyses further reveal that CP-El Niño events tend to bring drier conditions than EP-El Niño events over the CONUS, in agreement with our composite results ac-cording to the NOAA climate zones (Fig. 2). It is also found that WRR regions 8, 13, and 15 have positive runoff anoma-lies during CP-El Niño years and negative anomaanoma-lies in EP-El Niño years; the different results may need further study
considering the relative scarcity of the gage stations in these WRR regions.
3.2 Seasonal composite
El Niño usually develops in boreal summer and fall, peaks in winter, and decays in spring (Trenberth, 1997). In order to further examine the different impacts of the two types of El Niño on runoff at seasonal scales, seasonal composite analy-ses are also performed (Fig. 4), focusing on the three climatic zones first, followed by the 18 WRRs.
3.2.1 NOAA climate regions
During CP-El Niño years, significant negative runoff anoma-lies are found in all of the NE, PNW, and WNC climate regions throughout the year (Fig. 4, left panels). The driest condition occurs in the PNW, NE, and parts of Ohio Val-ley, with anomalies of up to−45 mm. The negative anoma-lies in other regions are relatively small, except for the WNC area in JJA. The dry condition is most pronounced in bo-real spring (MAM). On the other hand, significant positive anomalies are mainly observed in SE in JJA. The wetter than normal conditions extend both northeastward and westward and peak in DJF and MAM. This is possibly due to high pre-cipitation in boreal winter and spring brought by CP-El Niño (Larkin and Harrison, 2005b; Mo, 2010).
During EP-El Niño events (Fig. 4, right panels), NE, PNW, and WNC regions are characterized by positive runoff anomalies throughout the year, although NE and PNW show some exceptions (negative runoff anomalies) in DJF. The above than normal runoff can also be observed in other cli-mate regions such as in the SE during DJF and MAM, and the west coast during DJF. The large negative anomalies are mainly restricted in the upper midwest, central, and southern US in JJA, SON, and MAM.
In summary, seasonal composite results are consistent with annual composite analyses, especially for the NE, PNW, and WNC regions, despite their peak runoff values in different seasons.
3.2.2 WRRs
Figure 4.Seasonal composite of runoff anomaly (unit: mm) for the two types of El Niño on(a)JJA,(b)SON,(c)DJF, and(d)MAM in CP-El Niño years during the period of 1990-2009;(e–h)the same as(a–d), but for EP-El Niño years.+indicates results at 0.05 significance level based on a Monte Carlo test.
-45 0 45
(a) JJA CP El Nino
EP El Nino
-45 0 45 90
(b) SON
-36 0 36 72
(c) DJF
Water resource region
1 2 3 4 5 6 7 8 9 10 11 12 13 14 15 16 17 18 45
0 45
(d) MAM
Figure 5.Seasonal domain-averaged runoff anomalies (unit: mm)
for the 18 WRRs at(a)JJA,(b)SON,(c)DJF, and(d)MAM during CP- and EP-El Niño years.
mirror the evolution of both CP- or EP-El Niño intensities at seasonal timescales. For instance, WRR 2 has relative low runoff anomalies in boreal summer (JJA) and fall (SON) dur-ing EP-El Niño. However, the runoff anomalies are higher in winter (DJF) and peak in spring (MAM), which is con-sistent with the life cycle of EP-El Niño events. In conclu-sion, similar to the three climate regions (NE, PNW, and WNC), the 18 WRRs show the similar responses on seasonal scales as those on annual scales throughout El Niño years, despite some exceptions. For example, WRR 1, in the NE climate zone, shows negative runoff anomalies during CP-El Niño years and positive anomalies during EP-El Niño years for three seasons – JJA, SON, and MAM, but in DJF, WRR 1 shows a negative runoff anomaly. This is also the same case for WRR 5, 14, 16, and 17, although exceptions occur in dif-ferent seasons.
3.3 Modeled runoff composite 3.3.1 Historical
Table 1.Pattern correlations of runoff between the selected models and CP-/EP-El Niño years.
CP EP
NCAR-CCSM4 0.42 0.28 NASA-GISS-E2H 0.42 0.18 CNRM-CM5 0.34 −0.06 GFDL-CM2.1 0.50 −0.015 GFDL-ESM-2G 0.16 0.09 GFDL-ESM-2M 0.28 0.11 MPI-ESM-LR −0.21 −0.34 Nor-ESM1-M −0.07 −0.008
CMIP5 model output, which includes more El Niño events. The El Niño years for each model were determined by the methods described in Sect. 2.2. Previous studies suggested that different identification methods may lead to slight dif-ferences in the number of El Niño years (Yu and Kim, 2013; Yu et al., 2012). Nonetheless, such differences in El Niño fre-quency do not affect the main results (not shown), especially when more cases are included. Pattern correlations are used to evaluate the simulation of runoff for the eight CMIP5 mod-els, which reasonably capture the two types of El Niño (Kim and Yu, 2012; Mo, 2010). All of the eight model outputs have a pattern correlation greater than 0.8 in simulating the long-term mean monthly runoff. In simulating the response of runoff to the two types of El Niño, the NCAR-CCSM4 model is identified as the best model with the highest pat-tern correlation (Table 1 and Fig. 6). The main features of El Niño impacts on runoff are clearly reproduced. For exam-ple, during CP-El Niño years (Fig. 6a), the dry conditions in NE, Ohio Valley, WNC, and PNW, and wet conditions in SE, west, and southwest (SW) are simulated quite well. For EP-El Niño (Fig. 6b), the runoff anomalies are mainly char-acterized by wet conditions except for the Ohio Valley and some parts of PNW, consistent with observations (Fig. 2). The model results further enhanced the robustness of com-posite results from observations, despite some slight differ-ences (Figs. 2 and 6). In summary, both observational results and model simulations reveal that the responses of runoff to the two types of El Niño are similar in SE, SW, and western coastal areas, but different in NE, PNW, and WNC regions.
3.3.2 Future
Figure 7 shows the composite of annual runoff anomaly during CP- and EP-El Niño years over 2050–2099 by us-ing RCP4.5 output of NCAR-CCSM4 model. Consistent with conclusions based on historical runs, dominant dry (wet) conditions could also be observed during CP- (EP) El Niño years in the three climate zones (NE, PNW, and WNC) in the future. It is also found that both the intensity and the area of dry anomalies are increased during CP-El Niño years. The dry area extends from Ohio–Mississippi Valley to the
(a) CP
25 30 35 40 45 50
(b) EP
-120 -110 -100 -90 -80 -70
25 30 35 40 45 50
-180 -144 -108 -72 -36 0 36 72 108 144 180
Figure 6.Same as Fig. 2, but using NCAR-CCSM4 model
histori-cal output (unit: mm).+indicates results at 0.05 significance level based on a Monte Carlo test.
(a) CP
25 30 35 40 45 50
(b) EP
-120 -110 -100 -90 -80 -70
25 30 35 40 45 50
-180 -144 -108 -72 -36 0 36 72 108 144 180
Figure 7.Same as Fig. 2, but using NCAR-CCSM4 model RCP4.5
output (unit: mm).+ indicates results at 0.05 significance level based on a Monte Carlo test.
whole southeastern US. This result is likely due to decreased
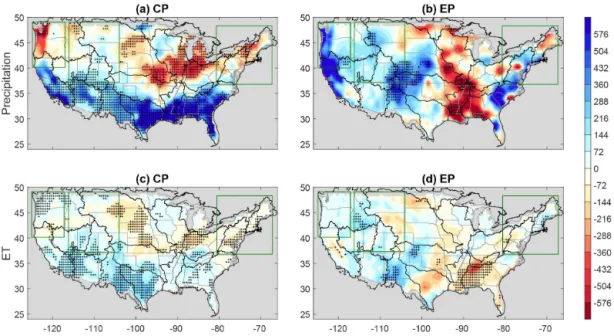
Figure 8.Same as Fig. 2, but forP (a, b)and ET(c, d)during CP- and EP-El Niño events (unit: mm).+indicates results at 0.05 significance level based on a Monte Carlo test.
Table 2.Mean annual Runoff,P, and ET over the three climate regions during two different types of El Niño years based on the
NCAR-CCSM4 model historical and future simulations (unit: mm).
Historical (1950–1999) RCP45 (2050–2099)
Northeast Runoff P ET Runoff P ET
CP-El Niño 418 1099 681 457 1185 728 EP-El Niño 494 1184 690 566 1251 685 Climatology mean 459 1135 676 505 1215 710
Pacific northwest
CP-El Niño 562 1050 488 626 1160 534 EP-El Niño 630 1149 519 665 1181 516 Climatology mean 611 1099 488 634 1144 510
West north central
CP-El Niño 161 655 494 147 711 564 EP-El Niño 168 705 537 163 733 570 Climatology mean 166 664 498 158 691 533
3.4 Water balance 3.4.1 Observations
In order to further understand the response of runoff to El Niño in light of water balance, the composites of P and ET are also performed (Fig. 8). For a watershed, runoff is mainly controlled by P and ET (i.e., runoff=P−ET) in the long term (Brubaker et al., 1993). It is shown that, over the CONUS, the runoff anomaly pattern largely follows P
anomaly pattern, with pattern correlations of 0.66 and 0.36 in both CP- and EP-El Niño years. For the three climate regions (NE, PNW, and WNC), theP anomalies are all negative
dur-ing CP-El Niño years, but all positive durdur-ing EP-El Niño years. The differentP anomalies during the two types of El Niño years largely explain the different runoff responses in the three climate regions.
3.4.2 Model output
WNC) is studied by comparing NCAR-CCSM4 model his-torical and RCP 4.5 output (Table 2).
For the NE region, the mean annual runoff in CP-El Niño years is about 76 mm lower than that in EP-CP-El Niño years in the current climate (1950–1999) mainly be-cause of a lowerP (1099 vs. 1184 mm) and nearly same ET (Table 2). In the future (2050–2099), runoff,P, and ET are projected to increase during both types of El Niño years in this region. However, runoff in CP-El Niño years is about 109 mm lower than that of future EP-El Niño years. The lower runoff is a combined effect of a lowerP (66 mm), and a higher ET (43 mm) presumably due to an increase of PET as a result of global warming. Similar results are also found in the PNW region: lower runoff during CP-El Niño years than that in EP-El Niño years, an increased future runoff for both CP- and EP-El Niño events associated with increasing futureP.
In the WNC region, similar to the NE and PNW regions, runoff is about 7 mm lower in CP-El Niño years than that in EP-El Niño years because P is 50 mm lower and ET is 43 mm lower in the current climate (Table 2). However, when the climate warms in the future, different from the NE and PNW climate zones, surface runoff will decrease by 14 and 5 mm during CP- and EP-El Niño years, respectively. Ta-ble 2 indicates that the net increases of ET during the CP-and EP-El Niño years, i.e., 70 CP-and 33 mm, are higher than the increases ofP (i.e., 56 and 28 mm, respectively), lead-ing to decreased future runoff durlead-ing El Niño events over the region. Such increases ofP and ET in the future are possi-bly due to global warming. The average temperature during the two types of El Niño years increases by∼2◦in the 21st
century (RCP4.5), compared with the 20th century. A higher temperature usually leads to a higher PET (Dai et al., 2010; Lu et al., 2009). When future ET enhancement is greater than the increasedP, such as in the WNC region during El Niño years, surface runoff will decrease.
In summary, runoff value during CP-El Niño years is lower than that during EP-El Niño years, indicating a drier condi-tion in all three climate regions during both current and future climate. In the future when climate warms, CCSM4 model suggests that surface runoff will increase in the NE and PNW regions during the two types of El Niño, largely due to an in-crease of futureP; however, over the WNC, runoff is likely to decrease because the increase of ET is much higher than
P increase for both El Niño events. Our analyses reveal that changes in ET due to global warming would play a more im-portant role in altering surface discharge in some regions. 4 Discussions
This study reveals a more arid condition in CP-El Niño years in terms surface runoff and water balances (Fig. 2), which is mainly caused by the P anomalies (Fig. 8). Over the CONUS, the three climate regions (PNW, WNC, and NE) are characterized by strong, different signals during the two different types of El Niño. The Ohio Valley is another area
in-fluenced significantly by El Niño events, but shows dry con-dition during both CP- and EP-El Niño years (Figs. 2 and 4). Our results are in good agreement with previous results such as Weng et al. (2007, 2009), as well as Yu and Zou (2013). Yu and Zou (2013) reported a drier condition across the US in CP-El Niño years, likely due to a southward shift of the jet streams and associated winter storm activities during CP-El Niño years. Kim and Alexander (2015) also found a drier condition in PNW during CP-El Niño years by analyzing ENSO’s impact on moisture transport. They concluded that during CP-El Niño, a southward shift of the cyclonic circu-lation over the north Pacific, which extends toward Califor-nia, induces moisture transport into the SW region instead of PNW.
Besides large-scale circulation and associated moisture transport, other factors such as land cover/use change, to-pography, vegetation, and soil profile could also modify sur-face runoff by influencingP, ET, and soil water storage ei-ther directly or indirectly during different El Niño events. For example, Franczyk and Chang (2009) investigated the com-bined effects of climate change and land use change on the runoff of the Rock Creek basin in Oregon (part of PNW) by using both hydrological models and global climate models. They suggested that the temperature andP are projected to increase by 1.2◦and 2 % by 2040s, respectively, which will
lead to a 2.7 % increase in mean annual runoff. The annual runoff will increase by about 5 % under projected climate change combined with land use change.
It is projected that the frequency of extreme El Niño events will increase due to greenhouse warming (Cai et al., 2015), which could significantly impact global weather patterns, ecosystems, agriculture, drought, floods, and other extreme events (Aronson et al., 2000; Cai et al., 2014; Vos et al., 1999). Yeh et al. (2009) showed that climate change will in-crease the frequency of the CP-El Niño compared to the EP-El Niño by using CMIP3 climate models. Kim and Yu (2012) reported that the intensity of CP-El Niño increases steadily from the pre-industrial to the historical and the RCP4.5 sim-ulations in the CMIP5 climate models. As the CP-El Niño will occur more frequently, our runoff results shown here suggest that the drought will be intensified in the future. This finding delivers informative socio-economic implica-tions and will benefit our management and policy-decision of water resources to reduce the damage of flood and drought in the future.
needs further validation when longer observational data are available. Second, our results only characterized the impact of El Niño on natural runoff without considering local fac-tors especially land use and land cover change (LULC). For those gages with LULC, El Niño also plays a role in the vari-ability of runoff. However, the relative contributions of cli-mate change and human activities such as LULC need fur-ther study, possibly by using modeling studies, which is the next step in our research.
5 Conclusions
The different impacts of CP- and EP-El Niño events on sur-face runoff over the CONUS were studied using 658 gag-ing stations and NCAR-CCSM4 model output. It is shown that surface runoff responds similarly to the two types of El Niño events in southeastern, central, southern, and west-ern coastal regions, but differently in NE, PNW, and WNC states. In general, the CP-El Niño events are likely to cause drier conditions with lower runoff whereas the EP-El Niño events tend to result in wetter than normal conditions over the CONUS. This can also be seen from the runoff responses at the 18 WRRs. Such runoff anomalies are largely following the variation ofP during El Niño years. The NCAR-CCSM4 model outputs further support the conclusions derived from observations, i.e., a drier condition over the CONUS dur-ing CP-El Niño years than EP-El Niño. It is also projected that future runoff tends to decrease over the WNC region, but to increase over the NW and PNE regions during both types of El Niño events as a result of the changes in the balances between P and ET. We conclude that surface wa-ter resources may be distributed more unevenly in space and time in the future El Niño years. Such information is useful to develop plans in anticipating hydrologic extremes under climate change.
Acknowledgements. We would like to thank USGS for providing runoff data, NOAA for providing land precipitation data, and ECMWF for providing ERA ET data, as well as ESGF portal for providing CMIP5 global climate model output. We also thank the two anonymous reviewers and M. Budde, as well as R. Tilburg for their helpful comments on earlier version of this manuscript. This study is supported by the National Science Foundation grant AGS-1147608, and US Department of Agriculture grant 2014-67003-22068.
Edited by: L. Samaniego
References
Aronson, R. B., Precht, W. F., Macintyre, I. G., and Murdoch, T. J.: Ecosystems: Coral bleach-out in Belize, Nature, 405, 36–36, doi:10.1038/35011132, 2000.
Ashok, K., Behera, S. K., Rao, S. A., Weng, H., and Ya-magata, T.: El Niño Modoki and its possible teleconnec-tion, J. Geophys Res.-Oceans (1978–2012), 112, C11007, doi:10.1029/2006JC003798, 2007.
Barnett, T. P., Adam, J. C., and Lettenmaier, D. P.: Potential impacts of a warming climate on water availability in snow-dominated regions, Nature, 438, 303–309, doi:10.1038/nature04141, 2005. Boyer, E. W., Howarth, R. W., Galloway, J. N., Dentener, F. J.,
Green, P. A., and Vörösmarty, C. J.: Riverine nitrogen export from the continents to the coastsm, Global Biogeochem. Cy., 20, GB1S91, doi:10.1029/2005GB002537, 2006.
Brown, D. P. and Comrie, A. C.: A winter precipitation “dipole” in the western United States associated with multi-decadal ENSO variability, Geophys. Res. Lett., 31, L09203, doi:10.1029/2003GL018726, 2004.
Brubaker, K. L., Entekhabi, D., and Eagleson, P.: Estimation of continental precipitation recycling, J. Climate, 6, 1077–1089, doi:10.1175/1520-0442(1993)006<1077:EOCPR>2.0.CO;2, 1993.
Burn, D. H. and Elnur, M. A. H.: Detection of hydrologic trends and variability, J. Hydrol., 255, 107–122, doi:10.1016/S0022-1694(01)00514-5, 2002.
Cai, W., Van Rensch, P., Cowan, T., and Sullivan, A.: Asym-metry in ENSO teleconnection with regional rainfall, its mul-tidecadal variability, and impact, J. Climate, 23, 4944–4955. doi:10.1175/2010JCLI3501.1, 2010.
Cai, W., Borlace, S., Lengaigne, M., Van Rensch, P., Collins, M., Vecchi, G., Timmermann, A., Santoso, A., McPhaden, M. J., Wu, L., England, M. H., Wang, G., Guilyardi, E., and Jin, F. : Increasing frequency of extreme El Niño events due to greenhouse warming, Nature Climate Change, 4, 111–116, doi:10.1038/nclimate2100, 2014.
Cai, W., Santoso, A., Wang, G., Yeh, S.-W., An, S.-I., Cobb, K. M., Collins, M., Guilyardi, E., Jin, F., Kug, J. S., Lengaigne, M., McPhaden, M. J., Takahashi, K., Timmermann, A., Vecchi, G., Watanabe, M., and Wu, L.: ENSO and greenhouse warming, Na-ture Climate Change, doi:10.1038/nclimate2743, 2015. Chen, M., Xie, P., Janowiak, J. E., and Arkin, P. A.: Global land
precipitation: A 50-yr monthly analysis based on gauge ob-servations, J. Hydrometeorol., 3, 249–266, doi:10.1175/1525-7541(2002)003<0249:GLPAYM>2.0.CO;2, 2002.
Dai, A., Qian, T., Trenberth, K. E., and Milliman, J. D.: Changes in continental freshwater discharge from 1948 to 2004, J. Climate, 22, 2773–2792, doi:10.1175/2008JCLI2592.1, 2009.
Dai, Z., Trettin, C. C., Li, C., Amatya, D. M., Sun, G., and Li, H.: Sensitivity of Stream flow and Water Table Depth to Po-tential Climatic Variability in a Coastal Forested Watershed, J. Am. Water Resour. As., 46, 1036–1048, doi:10.1111/j.1752-1688.2010.00474.x, 2010.
Déry, S. J. and Wood, E.: Decreasing river discharge in northern Canada, Geophys. Res. Lett., 32, L10401, doi:10.1029/2005GL022845, 2005.
Dong, B., Sutton, R. T., and Scaife, A. A.: Multidecadal modula-tion of El Nino–Southern Oscillamodula-tion (ENSO) variance by At-lantic Ocean sea surface temperatures, Geophys. Res. Lett., 33, L08705, doi:10.1029/2006GL025766, 2006.
Falcone, J. A., Carlisle, D. M., Wolock, D. M., and Meador, M. R.: GAGES: a stream gage database for evaluating natural and altered flow conditions in the conterminous United States, Ecol-ogy, 91, 621–621, doi:10.1890/09-0889.1, 2010.
Field, C., Barros, V., Dokken, D., Mach, K., Mastrandrea, M., Bilir, T., Chatterjee, M., Ebi, K., Estrada, Y. O., Genova, R. C., Girma, B., Kissel, E. S., Levy, A. N., MacCracken, S., Mastrandrea, P. R., and White, L. L.: IPCC, 2014: Climate Change 2014: Im-pacts, Adaptation, and Vulnerability. Part A: Global and Sectoral Aspects. Contribution of Working Group II to the Fifth Assess-ment Report of the IntergovernAssess-mental Panel on Climate Change: Cambridge University Press, Cambridge, UK and New York, NY, USA, 2014.
Franczyk, J. and Chang, H.: The effects of climate change and ur-banization on the runoff of the Rock Creek basin in the Portland metropolitan area, Oregon, USA, Hydrol. Process., 23, 805–815. doi:10.1002/hyp.7176, 2009.
Gerten, D., Rost, S., von Bloh, W., and Lucht, W.: Causes of change in 20th century global river discharge, Geophys. Res. Lett., 35, L20405, doi:10.1029/2008GL035258, 2008.
Gleick, P. H.: Global freshwater resources: soft-path so-lutions for the 21st century, Science, 302, 1524–1528, doi:10.1126/science.1089967, 2003.
Guetter, A. K. and Georgakakos, K. P.: Are the El Niño and La Niña predictors of the Iowa River seasonal flow?, J. Appl. Meteorol., 35, 690–705, doi:10.1175/1520-0450(1996)035<0690:ATENAL>2.0.CO;2, 1996.
Kahya, E. and Dracup, J. A.: US streamflow patterns in relation to the El Niño/Southern Oscillation, Water Resour. Res., 29, 2491– 2503, doi:10.1029/93WR00744, 1993.
Kao, H.-Y. and Yu, J.-Y.: Contrasting eastern-Pacific and central-Pacific types of ENSO, J. Climate, 22, 615–632, doi:10.1175/2008JCLI2309.1, 2009.
Karl, T. and Koss, W. J.: Regional and National Monthly, Seasonal, and Annual Temperature Weighted by Area, 1895–1983, Na-tional Climatic Data Center, Asheville, NC, USA, 1984. Kim, H.-M. and Alexander, M. A.: ENSO’s Modulation of Water
Vapor Transport over the Pacific North America Region, J. Cli-mate, 28, 3846–3856, doi:10.1175/JCLI-D-14-00725.1, 2015. Kim, S. T. and Yu, J. Y.: The two types of ENSO in CMIP5 models,
Geophys. Res. Lett., 39, L11704, doi:10.1029/2012GL052006, 2012.
Kug, J.-S., Jin, F.-F., and An, S.-I.: Two types of El Niño events: cold tongue El Niño and warm pool El Niño, J. Climate, 22, 1499–1515. doi:10.1175/2008JCLI2624.1, 2009.
Kumar, K. K., Rajagopalan, B., Hoerling, M., Bates, G., and Cane, M.: Unraveling the mystery of Indian monsoon failure during El Nino, Science, 314, 115–119, doi:10.1126/science.1131152, 2006.
Larkin, N. K. and Harrison, D.: Global seasonal temperature and precipitation anomalies during El Niño autumn and winter, Geophys. Res. Lett., 32, L16705, doi:10.1029/2005GL022860, 2005a.
Larkin, N. K. and Harrison, D.: On the definition of El Niño and as-sociated seasonal average US weather anomalies, Geophys. Res. Lett., 32, L13705, doi:10.1029/2005GL022738, 2005b. Lee, T. and McPhaden, M. J.: Increasing intensity of El Niño in
the central-equatorial Pacific, Geophys. Res. Lett., 37, L14603, doi:10.1029/2010GL044007, 2010.
Lettenmaier, D. P., Wood, E. F., and Wallis, J. R.: Hydro-climatological trends in the continental United States, 1948–88, J. Climate, 7, 586–607, doi:10.1175/1520-0442(1994)007<0586:HCTITC>2.0.CO;2, 1994.
Li, W., Zhang, P., Ye, J., Li, L., and Baker, P. A.: Impact of two different types of El Niño events on the Amazon cli-mate and ecosystem productivity, J. Plant Ecol-UK, 4, 91–99, doi:10.1093/jpe/rtq039, 2011.
Lu, J., Sun, G., McNulty, S. G., and Comerford, N. B. Sensitivity of pine flatwoods hydrology to climate change and forest manage-ment in Florida, USA, Wetlands, 29, 826–836, doi:10.1672/07-162.1, 2009.
Milliman, J., Farnsworth, K., Jones, P., Xu, K., and Smith, L.: Cli-matic and anthropogenic factors affecting river discharge to the global ocean, 1951–2000, Global Planet. Change, 62, 187–194, doi:10.1016/j.gloplacha.2008.03.001, 2008.
Mo, K. C.: Interdecadal modulation of the impact of ENSO on pre-cipitation and temperature over the United States, J. Climate, 23, 3639–3656, doi:10.1175/2010JCLI3553.1, 2010.
Oki, T. and Kanae, S.: Global hydrological cycles and world water resources, Science, 313, 1068–1072, doi:10.1126/science.1128845, 2006.
Petrone, K. C., Hughes, J. D., Van Niel, T. G., and Silberstein, R. P.: Streamflow decline in southwestern Australia, 1950–2008, Geo-phys. Res. Lett., 37, L11401, doi:10.1029/2010GL043102, 2010. Piao, S., Ciais, P., Huang, Y., Shen, Z., Peng, S., Li, J., Zhou, L., Liu, H., Ma, Y., Ding, Y., Friedlingstein, P., Liu, C., Tan, K., Yu, Y., Zhang, T., and Fang, J.: The impacts of climate change on water resources and agriculture in China, Nature, 467, 43–51, doi:10.1038/nature09364, 2010.
Piechota, T. C., Dracup, J. A., and Fovell, R. G.: West-ern US streamflow and atmospheric circulation pattWest-erns dur-ing El Niño-Southern Oscillation, J. Hydrol., 201, 249–271, doi:10.1016/S0022-1694(97)00043-7, 1997.
Seaber, P. R., Kapinos, F. P., and Knapp, G. L.: Hydrologic unit maps: US Government Printing Office, Washington, DC, USA, 20401, 1987.
Taylor, K. E., Stouffer, R. J., and Meehl, G. A.: An overview of CMIP5 and the experiment design, B. Am. Meteorol. Soc., 93, 485–498, doi:10.1175/BAMS-D-11-00094.1, 2012.
Trenberth, K. E.: The definition of El Nino, B. Am. Meteorol. Soc., 78, 2771–2777, doi:10.1175/1520-0477(1997)078<2771:TDOENO>2.0.CO;2, 1997.
Twine, T. E., Kucharik, C. J., and Foley, J. A. Effects of El Nino-Southern Oscillation on the climate, water balance, and stream-flow of the Mississippi River basin, J. Climate, 18, 4840–4861, doi:10.1175/JCLI3566.1, 2005.
Uppala, S., Dee, D., Kobayashi, S., Berrisford, P., and Simmons, A.: Towards a climate data assimilation system: status update of ERA-Interim, ECMWF newsletter, 115, 12–18, 2008.
K. E., Untch, A., Vasiljevic, D., Viterbo, P., and Woollen, J.: The ERA-40 re-analysis, Q. J. Roy. Meteor. Soc., 131, 2961–3012, doi:10.1256/qj.04.176, 2005.
van Oldenborgh, G. J., Philip, S. Y., and Collins, M: El Niño in a changing climate: a multi-model study, Ocean Sci., 1, 81–95, doi:10.5194/os-1-81-2005, 2005.
Vörösmarty, C. J., Green, P., Salisbury, J., and Lammers, R. B.: Global water resources: vulnerability from climate change and population growth, Science, 289, 284–288, doi:10.1126/science.289.5477.284, 2000.
Vos, R., Velasco, M., and Labastida, E.: Economic and social ef-fects of “El Niño” in Ecuador, 1997-8, ISS Working Paper Se-ries/General Series, 292, 1–55, 1999.
Weng, H., Ashok, K., Behera, S. K., Rao, S. A., and Yamagata, T. Impacts of recent El Niño Modoki on dry/wet conditions in the Pacific rim during boreal summer, Clim. Dynam., 29, 113–129, doi:10.1007/s00382-007-0234-0, 2007.
Weng, H., Behera, S. K., and Yamagata, T.: Anomalous winter climate conditions in the Pacific rim during recent El Niño Modoki and El Niño events, Clim. Dynam., 32, 663–674, doi:10.1007/s00382-008-0394-6, 2009.
Wilks, D. S.: Statistical methods in the atmospheric sciences, 3rd ed., Vol. 100, Academic press, Waltham, MA, USA, 2011.
Xu, K., Milliman, J. D., and Xu, H. Temporal trend of precipitation and runoff in major Chinese Rivers since 1951, Global Planet. Change, 73, 219–232, doi:10.1016/j.gloplacha.2010.07.002, 2010.
Yeh, S.-W., Kug, J.-S., Dewitte, B., Kwon, M.-H., Kirtman, B. P., and Jin, F.-F.: El Niño in a changing climate, Nature, 461, 511– 514, doi:10.1038/nature08316, 2009.
Yu, J. Y. and Kim, S. T.: Identifying the types of major El Niño events since 1870, Int. J. Climatol., 33, 2105–2112, doi:10.1002/joc.3575, 2013.
Yu, J.-Y. and Zou, Y.: The enhanced drying effect of Central-Pacific El Niño on US winter, Environ. Res. Lett., 8, 014019, doi:10.1088/1748-9326/8/1/014019, 2013.
Yu, J. Y., Zou, Y., Kim, S. T., and Lee, T.: The changing impact of El Niño on US winter temperatures, Geophys. Res. Lett., 39, L15702, doi:10.1029/2012GL052483, 2012.