HESSD
9, 5779–5808, 2012Assessing water footprint at river
basin level
Z. Zeng et al.
Title Page
Abstract Introduction
Conclusions References
Tables Figures
◭ ◮
◭ ◮
Back Close
Full Screen / Esc
Printer-friendly Version Interactive Discussion
Discussion
P
a
per
|
Dis
cussion
P
a
per
|
Discussion
P
a
per
|
Discussio
n
P
a
per
|
Hydrol. Earth Syst. Sci. Discuss., 9, 5779–5808, 2012 www.hydrol-earth-syst-sci-discuss.net/9/5779/2012/ doi:10.5194/hessd-9-5779-2012
© Author(s) 2012. CC Attribution 3.0 License.
Hydrology and Earth System Sciences Discussions
This discussion paper is/has been under review for the journal Hydrology and Earth System Sciences (HESS). Please refer to the corresponding final paper in HESS if available.
Assessing water footprint at river basin
level: a case study for the Heihe River
Basin in northwest China
Z. Zeng1, J. Liu1,2, P. H. Koeneman3, E. Zarate4, and A. Y. Hoekstra3,4
1
School of Nature Conservation, Beijing Forestry University, Beijing, 100083, China
2
Ecosystems Services and Management, International Institute for Applied Systems Analysis, Schlossplatz 1, 2361, Laxenburg, Austria
3
Department of Water Engineering and Management, University of Twente, Enschede, The Netherlands
4
Water Footprint Network, Enschede, The Netherlands
Received: 30 March 2012 – Accepted: 3 April 2012 – Published: 3 May 2012 Correspondence to: J. Liu (water21water@yahoo.com)
HESSD
9, 5779–5808, 2012Assessing water footprint at river
basin level
Z. Zeng et al.
Title Page
Abstract Introduction
Conclusions References
Tables Figures
◭ ◮
◭ ◮
Back Close
Full Screen / Esc
Printer-friendly Version Interactive Discussion
Discussion
P
a
per
|
Dis
cussion
P
a
per
|
Discussion
P
a
per
|
Discussio
n
P
a
per
|
Abstract
Increasing water scarcity places considerable importance on the quantification of water footprint (WF) at different levels. Despite progress made previously, there are still very few WF studies focusing on specific river basins, especially for those in arid and semi-arid regions. The aim of this study is to quantify WF within the Heihe River Basin (HRB), 5
a basin located in the arid and semi-arid northwest of China. The findings show that the WF was 1768 million m3yr−1in the HRB over 2004–2006. Agricultural production was
the largest water consumer, accounting for 96 % of the WF (92 % for crop production and 4 % for livestock production). The remaining 4 % was for the industrial and domestic sectors. The “blue” component of WF was 811 million m3yr−1. This indicates a blue
10
water proportion of 46 %, which is much higher than the world average and China’s average, which is mainly due to the aridness of the HRB and a high dependence on irrigation for crop production. However, even in such a river basin, blue WF was still smaller than green WF, indicating the importance of green water. We find that blue WF exceeded blue water availability during eight months per year and also on an annual 15
basis. This indicates that WF of human activities was achieved at a cost of violating environmental flows of natural freshwater ecosystems, and such a WF pattern is not sustainable. Considering the large WF of crop production, optimizing the crop planting pattern is often a key to achieving more sustainable water use in arid and semi-arid regions.
20
1 Introduction
As one of the most essential natural resources, water is greatly threatened by human activities (Oki and Kanae, 2006; Postel et al., 1996; V ¨or ¨osmarty et al., 2000, 2010). There are still more than 800 million lacking a safe supply of freshwater (Ban Ki-moon, 2012) and 2 billion people lacking basic water sanitation (Falconer et al., 2012). Wa-25
HESSD
9, 5779–5808, 2012Assessing water footprint at river
basin level
Z. Zeng et al.
Title Page
Abstract Introduction
Conclusions References
Tables Figures
◭ ◮
◭ ◮
Back Close
Full Screen / Esc
Printer-friendly Version Interactive Discussion
Discussion
P
a
per
|
Dis
cussion
P
a
per
|
Discussion
P
a
per
|
Discussio
n
P
a
per
|
et al., 2003). Especially in arid and semi-arid regions, nearly all river basins have se-rious water problems, such as rivers drying up, pollution or groundwater table decline (Jos ´e et al., 2010; V ¨or ¨osmarty et al., 2010). It is necessary to find new approaches and tools of integrated water resources management (Adeel, 2004) to help maintain a bal-ance between human resource use and ecosystem protection (Dudgeon et al., 2006; 5
V ¨or ¨osmarty et al., 2010). New paradigms and approaches, e.g. water footprint (WF) and green and blue water, have been emerging in scientific communities to promote efficient, equitable and sustainable water uses, and these paradigms are believed to break new ground for water resources planning and management (Falkenmark, 2003; Falkenmark and Rockstr ¨om, 2006; Hoekstra and Chapagain, 2007; Liu and Savenije, 10
2008).
WF is an indicator of water use introduced by Hoekstra (2003). It shows water con-sumption by source and polluted volumes by type of pollution. Water footprint assess-ment is an analytical tool that can describe the relationship between human activities and water scarcity, and give an innovative way for integrated water resources man-15
agement (Hoekstra et al., 2011). Earlier water footprint studies generally focus on five levels: process, product, sector, administrative unit, and global. At the process level, Chapagain et al. (2006) calculated the WF of cotton production for different processes. At the product level, Mekonnen and Hoekstra (2011) estimated the green, blue and grey WF of 126 crops all over the world for the period 1996–2005 with a high spatial 20
resolution. The WF of pasta and pizza (Aldaya and Hoekstra, 2009), coffee and tea (Chapagain and Hoekstra, 2007) have been analyzed. At the sector level, Aldaya et al. (2010) calculated the WF of domestic, industrial and agricultural sectors in Spain and found that the inefficient allocation of water resources and mismanagement in the agricultural sector lead to water scarcity in Spain. At the national level, the WF of China 25
HESSD
9, 5779–5808, 2012Assessing water footprint at river
basin level
Z. Zeng et al.
Title Page
Abstract Introduction
Conclusions References
Tables Figures
◭ ◮
◭ ◮
Back Close
Full Screen / Esc
Printer-friendly Version Interactive Discussion
Discussion
P
a
per
|
Dis
cussion
P
a
per
|
Discussion
P
a
per
|
Discussio
n
P
a
per
|
water footprint of goods and services consumed by humans on the earth has been quantified by Hoekstra and Chapagain (2007) and Hoekstra and Mekonnen (2012).
Although the body of literature on WF has been increasing fast, there are still very few studies focusing on specific river basins (UNEP, 2011), especially for those located in arid and semi-arid regions. We chose the Heihe River Basin (HRB) in inland north-5
west of China as a case area, and conducted a WF assessment by considering the agricultural (i.e. crop production and livestock production), industrial and domestic sec-tors. We assess the annual green and blue WF and compare the blue WF (WFblue) with blue water availability (WAblue) at a monthly level to pinpoint the most serious
wa-ter scarce months. Located in northwest China, the Heihe River originates in the Qilian 10
Mountains in Qinghai Province, flows through several counties in Gansu Province and Inner Mongolia, and terminates in oases in Mongolia (Fig. 1). The precipitation ranges from 480 mm in the upstream part of the basin to even less than 20 mm downstream. The extensive use of water in the upper and middle parts of the basin has led to a de-crease in water resources downstream, causing salinization and desertification (Chen 15
et al., 2005). Previous research often pays attention to irrigation in this river basin (Zhao et al., 2005; Ji et al., 2006; Chen et al., 2005), but a comprehensive WF assessment considering multiple sectors and multiple types of water (e.g. green and blue water) has never been done before. Such an assessment is a key to better understanding the entire picture of water consumption at the river basin level, and identifying ways to 20
improve water management.
2 Method
2.1 Scope of WF accounting
In order to assess WF within the HRB, we need to know the WF of crop production (WFc), WF of livestock production (WFl), WF of the industrial sector (WFi), and WF 25
HESSD
9, 5779–5808, 2012Assessing water footprint at river
basin level
Z. Zeng et al.
Title Page
Abstract Introduction
Conclusions References
Tables Figures
◭ ◮
◭ ◮
Back Close
Full Screen / Esc
Printer-friendly Version Interactive Discussion
Discussion
P
a
per
|
Dis
cussion
P
a
per
|
Discussion
P
a
per
|
Discussio
n
P
a
per
|
water and groundwater), and green water (soil water) (Liu and Savenije, 2008). Both the green and blue components of WF are assessed. The blue and green WF (WFblueand
WFgreen) accounting and sustainability assessment are mainly based on the standard
methods proposed in the Water Footprint Assessment Manual (Hoekstra et al., 2011). We do not include the volume of water that is used to assimilate water pollution, or grey 5
WF. In this article, we only estimate WF within China’s territory due to the lack of data in Mongolia. In addition, the area of the HRB located in Mongolia is mainly desert, while crop and livestock production and other human activities are marginal. Neglecting this area will not lead to large errors for the WF of the entire river basin. We assess WF in the HRB over 2004–2006 and use the annual and monthly results for the presentation 10
of results.
2.2 Crop production and livestock production in the HRB
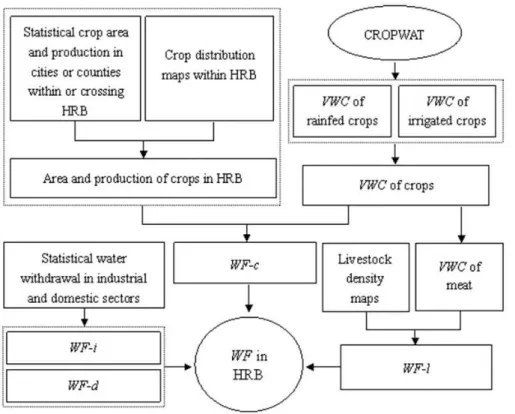
Since many data are not available at a river basin level, we combine statistical data for administrative boundaries (e.g. a county or a city) with spatially explicit datasets to obtain the information at the river basin level. The steps to calculate the WF within the 15
HRB are depicted in Fig. 2.
There are 15 Chinese cities or counties within or across the HRB. The statistics provide accurate information of harvested area and production of crops in these cities or counties during 2004–2006, but statistical information at river basin is not available. For these administrative regions, we need to calculate how much area is located within 20
the HRB. With the 5 arc-minute crop distribution maps from the MIRCA2000 database from the University of Frankfurt (Portmann et al., 2010), we can calculate the shares of crop area (both rainfed and irrigated) of one specific crop in one city or county within and outside the HRB. Combining these shares with statistical harvested area of a city or county, the crop area of all administrative regions within the HRB can be 25
HESSD
9, 5779–5808, 2012Assessing water footprint at river
basin level
Z. Zeng et al.
Title Page
Abstract Introduction
Conclusions References
Tables Figures
◭ ◮
◭ ◮
Back Close
Full Screen / Esc
Printer-friendly Version Interactive Discussion
Discussion
P
a
per
|
Dis
cussion
P
a
per
|
Discussion
P
a
per
|
Discussio
n
P
a
per
|
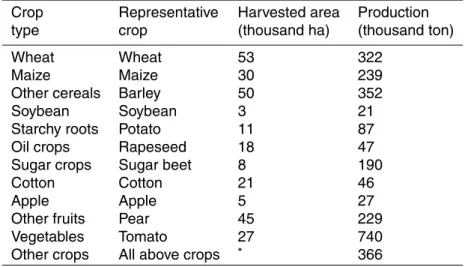
A total of 12 types of crops or crop groups were selected. Each type has its own rep-resentative crop (Table 1). These include cereal crops (wheat, maize and other cereal crops), soybean, oil crops (rapeseed), sugar crops (sugar beet), cotton, fruits (apple and other fruits), vegetables (tomato) and other crops. According to our estimate, the first 11 types of crops account for 86 % of the total crop production, while the other 5
crops account for 14 % within the HRB.
The meat production is calculated by multiplying the number of an animal type by its average meat production of the animal types. Beef, sheep/goat, pork and poultry are four main animal categories in the HRB and we only consider these livestock in our calculation. The density of animals per animal category (number km−2) is obtained
10
from the Animal Production and Health division of FAO (2011). This dataset provides spatially explicit information on animal densities in 2005 with a spatial resolution of 3 arc-minutes. The total number of an animal in the HRB can be estimated by summing up the animal number of all grid cells within the basin.
2.3 WF of crop production (WFc)
15
WFcis calculated by multiplying virtual water content (VWC) of each crop with its
pro-duction and then summing up all crops. VWC is defined as the amount of water (m3) that is needed to produce a product per unit of crop (ton) during the crop growing pe-riod. The green and blue components of VWC are calculated as the ratio of effective rainfall (ER, m3ha−1) or irrigation (I, m3ha−1) to the crop yield (Y, t ha−1). The VWC of
20
crops is the sum of green VWC (VWCgreen) and blue VWC (VWCblue).
VWCgreen=
ER
Y (1)
VWCblue=
I
Y (2)
VWC=VWCgreen+VWCblue (3)
HESSD
9, 5779–5808, 2012Assessing water footprint at river
basin level
Z. Zeng et al.
Title Page
Abstract Introduction
Conclusions References
Tables Figures
◭ ◮
◭ ◮
Back Close
Full Screen / Esc
Printer-friendly Version Interactive Discussion
Discussion
P
a
per
|
Dis
cussion
P
a
per
|
Discussion
P
a
per
|
Discussio
n
P
a
per
|
The CROPWAT model (FAO, 2010a; Allen et al., 1998) is used to estimate ER andI of crops. Both the rainfed and irrigated conditions are taken into account. “Irrigation schedule option” is used to calculate ER andI by simulating soil water balance with a daily time step (Hoekstra et al., 2011). We do not estimate the green and blue water incorporated into the crops because in general they account for very small (e.g. 0.1 % 5
of the evaporated water, up to 1 % at most) (Hoekstra et al., 2011).
The CROPWAT model needs climate, crop and soil parameters to model evapotran-spiration and crop irrigation requirement. Climate data include temperature, precipita-tion, humidity, sunshine, radiation and wind speed. The climate data are obtained from the New LocClim database (FAO, 2005), which provides monthly climate data on 30-yr 10
average (1961–1990). We select three climate stations located in the HRB (see Fig. 1). Crop parameters such as crop coefficients, rooting depths, lengths of each crop devel-opment stage, the planting and harvest dates are based on Allen et al. (1998) and Chapagain and Hoekstra (2004). Soil parameters include values of available soil wa-ter content, maximum infiltration rate, maximum rooting depth, and initial soil moisture 15
depletion. Available soil water content for the HRB are retrieved from global maps from Food and Agriculture Organization of the United Nations (FAO) (FAO, 2010b). The maximum infiltration rate depends on the soil types, which are predominantly sandy and loamy in the HRB (Qi and Cai, 2007). Because no information was available for maximum rooting depth and initial soil moisture content at the start of the growing 20
season, default values in CROPWAT were taken (FAO, 2010a).
2.4 WF of livestock production (WFl)
WFlis calculated by multiplying VWC of a type of livestock meat with its production and
then summing up all types of livestock types. VWC of meat is defined as the amount of water (m3) that is needed to produce per unit of meat (ton).
25
HESSD
9, 5779–5808, 2012Assessing water footprint at river
basin level
Z. Zeng et al.
Title Page
Abstract Introduction
Conclusions References
Tables Figures
◭ ◮
◭ ◮
Back Close
Full Screen / Esc
Printer-friendly Version Interactive Discussion
Discussion
P
a
per
|
Dis
cussion
P
a
per
|
Discussion
P
a
per
|
Discussio
n
P
a
per
|
grass, rough forage and maize. In the HRB, maize needs both precipitation and irriga-tion, while the other crops mainly use precipitation (Zhang, 2003). The percentage of blue and green water in maize is estimated with the CROPWAT model. Drinking and processing water is dominantly “blue”. We assume that feed crops are all produced within the HRB based on common practice in the HRB. The feed water requirement 5
(FWR, m3kg−1) for an animal can be calculated by multiplying feed conversion e
ffi -ciency (FCE) for a specific crop (FCEf, kg dry mass of feed kg−
1
of output) by the VWC of the feed crops (VWCf, m3kg−1):
FWR=
Nf
X
f=1
FCEf×VWCf (4)
Together with the drinking water requirement (DWR, m3t−1) and processing water
re-10
quirement (PWR, m3t−1) this leads to the VWC of animal meat (VWC, m3t−1):
VWC=FWR+DWR+PWR (5)
Feed requirement of animals, FCE, DWR and PWR are retrieved from Zhang (2003). In order to calculate the monthly WF of livestock production, we assume DWR and PWR are equally distributed in each month throughout the year. The monthly FWR 15
and its green/blue components are estimated based on monthly water requirements of crops, which are calculated by the CROPWAT model.
2.5 WF of industrial and domestic sectors (WFi and WFd)
The WF of industrial and domestic sectors is estimated by multiplying water withdrawal with a water consumption ratio (WCR) for each sector. According to the Ministry of Wa-20
HESSD
9, 5779–5808, 2012Assessing water footprint at river
basin level
Z. Zeng et al.
Title Page
Abstract Introduction
Conclusions References
Tables Figures
◭ ◮
◭ ◮
Back Close
Full Screen / Esc
Printer-friendly Version Interactive Discussion
Discussion
P
a
per
|
Dis
cussion
P
a
per
|
Discussion
P
a
per
|
Discussio
n
P
a
per
|
2.6 WF sustainability assessment
The WF sustainability is assessed by comparing WFblue with blue water availability
(WAblue) at a river basin level. When WFblue exceeds WAblue, there is reason for
sus-tainability concern (Hoekstra et al., 2012).
According to Hoekstra et al. (2011), WAblue is estimated as below:
5
WAblue=BWR−EFR (6)
where BWR means blue water resources or the total amount of surface and ground-water flows, and EFR is environmental flow requirements.
The annual and monthly blue water resources in the HRB is obtained from Zang et al. (2012), who simulate surface and groundwater flows under the natural conditions 10
with a Soil and Water Assessment Tool (SWAT) (Arnold et al., 1994). It is often assumed that EFR accounts for a certain share of the blue water resources. We use a share of 80 % as suggested by Hoekstra et al. (2011, 2012).
3 Results
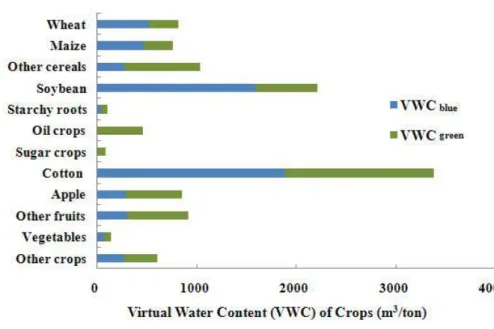
3.1 VWC of crops 15
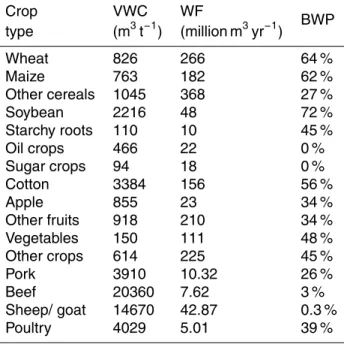
Among all crops studied, cotton has the largest VWC of 3384 m3t−1(Fig. 3). Soybean
also has high VWC of 2216 m3t−1. Cereal crops in general have VWC values ranging
from 763 to 1045 m3t−1. The blue water proportion (BWP) is defined as the ratio of
VWCblue to VWC (Liu et al., 2009). Soybean has the highest BWP value of 70 %,
fol-lowed by wheat and maize with BWP values between 62 % and 64 % (Table 2). Sugar 20
HESSD
9, 5779–5808, 2012Assessing water footprint at river
basin level
Z. Zeng et al.
Title Page
Abstract Introduction
Conclusions References
Tables Figures
◭ ◮
◭ ◮
Back Close
Full Screen / Esc
Printer-friendly Version Interactive Discussion
Discussion
P
a
per
|
Dis
cussion
P
a
per
|
Discussion
P
a
per
|
Discussio
n
P
a
per
|
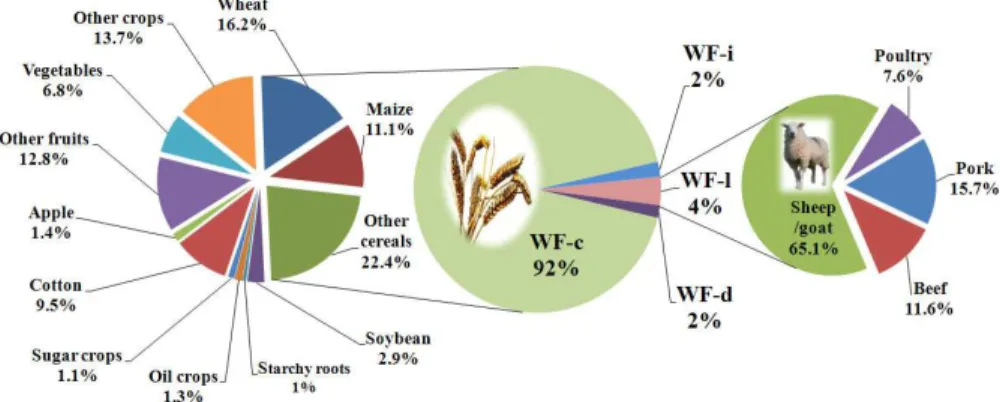
3.2 WF of crop production (WFc)
The average annual WFcwas 1638 million m 3
yr−1in the HRB during 2004–2006. About
45 % (742 million m3) of WFcwas due to the use of blue water, while the remaining 55 % (896 million m3) was from the use of green water (Fig. 4). Cereal crops accounted for almost half of the WFc. In particular, wheat and maize combined accounted for 27 % of
5
WFc. Wheat and maize comprised a large share (30 %) of cropland area. Cereal crops accounted for about 51 % of blue WFcand 49 % of green WFc. In particular, wheat and
maize comprised 38 % and 19 % of blue and green WFc, respectively. Not only in the
HRB, but also for the whole China, wheat and maize are the major grain crops and account for a larger share of consumptive water use in cropland (Liu et al., 2007; Yang, 10
1999).
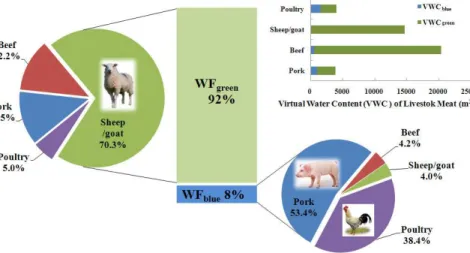
3.3 VWC of animal products
Beef has the largest VWC of almost 20 000 m3t−1, followed by sheep and goat
(Ta-ble 2). As expected, animal meats have much higher VWC than crops. The high VWC of meat is largely due to the large feed consumption that requires a high amount of 15
water.
Compared to crops, meat has a relatively low BWP, which is ranged from less than 1 % to 40 % (Table 2). All the four types of livestock have much higher VWCgreen than
VWCblue compared to crops. Among the four types of meat, sheep/goat meats have the lowest BWP of 0.3 %. Sheep and goat are dominantly raised in pasture land and 20
they eat grasses in rainfed grassland without much addition to feeds such as maize. In contrast, poultry has a relative high BWP of 40 %. Chicken are raised in farmers’ backyards or in chicken factories, and they rely much on feed stuff. Hence, the BWP of chicken is significantly influenced by these feeds. The VWC of meats and its green and blue components are closely related to the type of feeds and animal management 25
HESSD
9, 5779–5808, 2012Assessing water footprint at river
basin level
Z. Zeng et al.
Title Page
Abstract Introduction
Conclusions References
Tables Figures
◭ ◮
◭ ◮
Back Close
Full Screen / Esc
Printer-friendly Version Interactive Discussion
Discussion
P
a
per
|
Dis
cussion
P
a
per
|
Discussion
P
a
per
|
Discussio
n
P
a
per
|
3.4 WF of livestock production (WFl)
The average annual WFl was 65.82 million m 3
yr−1 in the HRB during 2004–2006.
About 92 % of WFl(60.71 million m 3
) was green, and only 8% (5.1 million m3) was blue (Fig. 5). Sheep and goat accounted for over 70 % of green WFl. This is due to the large amount of meat production of sheep and goat. When checking at blue WFl, pork and
5
poultry combined accounted for about 92 %, while sheep and goat only accounted for about 4 %. The low BWP of sheep and goat meats largely explains the low share of blue WFlof sheep and goat.
3.5 WF in the HRB
The average annual WF was 1768 million m3yr−1 in the HRB during 2004–2006
10
(Fig. 6). Almost 92 % was from crop production. Livestock production accounted for 4 %. The annual WF of industrial and domestic sectors in the HRB was 34 million m3yr−1 and 30 million m3yr−1, respectively. WF
i and WFd combined were
equivalent to WFl. Agricultural production (crop and livestock production) was the main human activity within the HRB, and it accounted for 96 % of WF in the HRB. For WFc,
15
cereal crops were the largest water user; while for WFl, sheep and goat were the
biggest water user.
In the HRB, 54 % (956 million m3yr−1) of WF was green, while 46 %
(811 million m3yr−1) was blue (Fig. 7). About 94 % of WF
green within the HRB was
re-lated to crop production, while cereal crops contributed the largest share. WFl only 20
represented 6 % of WFgreen. Among WFblue, crop production accounted for 91 %,
do-mestic and industrial sectors each contributed about 4 %, while livestock production only accounted for less than 1 %. Livestock production only accounted for a marginal share of WFblue because livestock in the HRB is mainly raised in pasture under rainfed
conditions. Crop production, especially cereal crop production, was the main green and 25
HESSD
9, 5779–5808, 2012Assessing water footprint at river
basin level
Z. Zeng et al.
Title Page
Abstract Introduction
Conclusions References
Tables Figures
◭ ◮
◭ ◮
Back Close
Full Screen / Esc
Printer-friendly Version Interactive Discussion
Discussion
P
a
per
|
Dis
cussion
P
a
per
|
Discussion
P
a
per
|
Discussio
n
P
a
per
|
4 Discussion
4.1 Comparison with other studies
According to our estimate, the per capita WF (green and blue) of the HRB is estimated to be 870 m3cap−1yr−1. According to Cai et al. (2012), in the Gansu province (the
ma-jority part of the HRB), the net virtual blue water export through food trade accounted 5
for 10 % of the total blue water resources in the basin and 25 % of the total blue water use. From the water resources point of view, it is not a good solution to use precious water in arid and semi-arid regions to support a large amount of food trade. Crop pat-tern adjustment is a key to better water management.
In general, the BWP of crop production in the HRB is 45 %. It is much higher than 10
the global average of 19 % reported in Liu et al. (2009) and also higher than China’s average of 32 % (Liu et al., 2009). The HRB is an inland river basin located in arid and semi-arid northwest China. Many types of crops largely rely on irrigation during their growth period. High temperature leads to high crop water requirements while low precipitation leads to a high dependency on irrigation in the HRB. The BWP of livestock 15
production estimated in this study is very close to that reported in Zhang (2003).
4.2 Sustainability analysis
In this study, we compare WFblue with blue water availability (WAblue) to indicate blue
water scarcity (BWS) on both yearly and monthly basis (Fig. 8). Blue water resources availability is high from April to September due to high precipitation in these months. 20
WFblue is also much higher from April to September than other months because crops
mainly grow during these periods. The period from October to March is too cold for crops to grow. Additionally, these months have too little precipitation to support any rainfed crops.
Hoekstra et al. (2012) provide an approach to quantify BWS. At a river basin level, 25
HESSD
9, 5779–5808, 2012Assessing water footprint at river
basin level
Z. Zeng et al.
Title Page
Abstract Introduction
Conclusions References
Tables Figures
◭ ◮
◭ ◮
Back Close
Full Screen / Esc
Printer-friendly Version Interactive Discussion
Discussion
P
a
per
|
Dis
cussion
P
a
per
|
Discussion
P
a
per
|
Discussio
n
P
a
per
|
is classified into four levels: low BWS (<100 %), moderate BWS (100–150 %), signif-icant BWS (150–200 %) and severe BWS (>200 %). In the HRB, the annual WFblue was 811 million m3yr−1 during 2004–2006, and it was greater than the WA
blue of
528 million m3yr−1. The average annual BWS value was 154 %; hence, according to
the above definitions, significant BWS occurred on an annual basis in the HRB. WFblue
5
was 31 % of the total blue water resources; hence, runoffin the HRB was significantly modified by human activities. This indicates that water consumption for human activi-ties has exceeded the sustainable level of water availability, and human WF was partly met at a cost of violating environment water flows.
When comparing the monthly WFbluewith the monthly WAblue, one can identify which 10
months are confronted with what level of water scarcity. According to our estimate, WFblue exceeded WAblue in eight months of the year (Fig. 8). The HRB faced severe
BWS in four months (April, May, June and December), significant BWS in two months (March and November), and moderate BWS in two months (February and July). Al-though high blue water resources availability occurred from April to July, WAbluecannot
15
meet human water demand, in particular for crop irrigation. From November to Jan-uary, the HRB undergoes its dry season with a small amount of water available for the industrial and domestic sectors. It is clear that the environmental flow requirements are not met during two-thirds of the year. Blue water resources cannot meet human water demand and environmental flows at the same time. This leads to unsustainable water 20
use, causing several ecological degradation in the HRB, such as the river running dry and death of riparian vegetation (Kang et al., 2007).
4.3 WF and water withdrawal
Statistics on water use often report water withdrawal. However, we argue that WF is more suitable for measuring water consumption by human beings. A large part of water 25
HESSD
9, 5779–5808, 2012Assessing water footprint at river
basin level
Z. Zeng et al.
Title Page
Abstract Introduction
Conclusions References
Tables Figures
◭ ◮
◭ ◮
Back Close
Full Screen / Esc
Printer-friendly Version Interactive Discussion
Discussion
P
a
per
|
Dis
cussion
P
a
per
|
Discussion
P
a
per
|
Discussio
n
P
a
per
|
back to downstream water bodies as return flows (Perry, 2007; Shiklomanov, 2000). Hence, water withdrawal cannot completely demonstrate human appropriation of wa-ter resources. Moreover, WF includes consumption of green wawa-ter, in addition to blue water, while the traditional statistics on water withdrawal only account for blue water. In contrast, WF can quantify what type and how much water is consumed by human 5
activities. Statistics on WF and its “color” components (green and blue) are suggested to be reported in statistics.
Taking the HRB as an example, according to our estimate, WF was 1768 million m3yr−1 in 2004–2006, among which 956 million m3yr−1 was green, and
811 million m3yr−1 was blue. At the river basin level, there is very little statistical
in-10
formation on water use, even for water withdrawal. The often used water withdrawal data of 2625 million m3yr−1 in many studies (Chen et al., 2005; Zhang, 2003) are for
the year of 1999. Apparently, this number includes a large amount of return flow that could further be used within the HRB. The WF addresses consumptive water use and its green and blue components, and shows the “real” water consumption.
15
Including green water in water accounting is important. Traditional water resources assessment and management mainly pay attention to blue water. In the past decades, several studies conclude that green water management should be emphasized in addi-tion to blue water (Savenije, 2000; Liu et al., 2009). Even in arid and semi-arid regions such as the HRB, WFgreen is still higher than the WFblue, as estimated in this article. 20
Green water plays an important role in food production. Improving green water man-agement and green water use efficiency is key to enhancing river basin water manage-ment and to guaranteeing food security. Unfortunately, this is still an area that needs to be significantly strengthened.
4.4 Shortcomings 25
HESSD
9, 5779–5808, 2012Assessing water footprint at river
basin level
Z. Zeng et al.
Title Page
Abstract Introduction
Conclusions References
Tables Figures
◭ ◮
◭ ◮
Back Close
Full Screen / Esc
Printer-friendly Version Interactive Discussion
Discussion
P
a
per
|
Dis
cussion
P
a
per
|
Discussion
P
a
per
|
Discussio
n
P
a
per
|
available maps have high spatial resolution, they may have errors at the river basin level. Second, grey WF is not included due to the lack of comprehensive data on pollu-tant discharge. Ignoring grey WF will result in a conservative estimate of WF. Third, we do not calculate WF for the HRB outside China’s boundary. However, as we have men-tioned, this will not lead to large errors due to the marginal human activities for the HRB 5
in Mongolia. Fourth, our study did not include green water sustainability assessment. Green water plays a key role in crop and livestock production, it is also very important to keep healthy natural ecosystems. Competition of green water between human activ-ities and natural ecosystems will lead to different levels of green water scarcity. There are two reasons why we did not conduct a green water sustainability analysis: the lack 10
of a standard method, and the lack of information on how much green water should be maintained for natural ecosystems. However, such analysis is an important topic and it should be further strengthened to gain in-depth insights into human’s interven-tion to green water resources. Fifth, we provide a first attempt to estimate WF for the entire the HRB, but such an assessment does not take into account the spatial diff er-15
ence of WF within the river basin. Spatial heterogeneity of climate conditions and land use/cover are very sharp in the HRB with high precipitation and glaciers upstream and low precipitation and desert downstream. There is a need to compare WF with water availability at the sub-basin levels. This is out of the scope of this paper, but it is what will be further investigated in the next step. Last but not least, there is also a need to 20
further analyze the economic and social impacts (e.g. trade, income, employment etc.) of WF to enable the WF as a more comprehensive indicator for decision makers.
Acknowledgements. This study was supported by the New Century Excellent Talents in Univer-sity (NCET-09-0222), the National Natural Science Foundation of China (91025009), Projects of International Cooperation and Exchanges NSFC (41161140353), and Fundamental Research
25
HESSD
9, 5779–5808, 2012Assessing water footprint at river
basin level
Z. Zeng et al.
Title Page
Abstract Introduction
Conclusions References
Tables Figures
◭ ◮
◭ ◮
Back Close
Full Screen / Esc
Printer-friendly Version Interactive Discussion
Discussion
P
a
per
|
Dis
cussion
P
a
per
|
Discussion
P
a
per
|
Discussio
n
P
a
per
|
References
Adeel, Z.: Focus on new water issues-perspectives at the end of the International Year of Fresh-water, Global Environmental Change Part A, 14, 1–4, 2004.
Aldaya, M. M. and Hoekstra, A. Y.: The water needed for Italians to eat pasta and pizza, Agr. Syst., 103, 351–360, 2010.
5
Aldaya, M. M., Garrido, A., Llamas, M. R., Varelo-Ortega, C., Novo, P., and Casado, R. R.: Water footprint and virtual water trade in Spain, Water policy in Spain, CRC Press, Leiden, The Netherlands, 49–59, 2010.
Allen, R. G., Pereira, L. S., Raes, D., and Smith, M.: Crop Evapotranspiration: Guidelines for computing crop water requirements. Irrigation and Drainage Paper, Food and Agriculture
10
Organization of the United Nations, Rome, Italy, 300 pp., 1998.
Arnold, J., Williams, J., Srinivasan, R., King, K., and Griggs, R.: SWAT: Soil water assessment tool, US Department of Agriculture, Agricultural Research Service, Grassland, Soil Water Research Laboratory, Temple, TX, 1994.
Ban Ki-moon: Unwise Use of Water Will Result in Persisting Hunger, Drought, Political
In-15
stability, Secretary-General Warns in Observance Message, UN, Secretary – General, available at: http://www.un.org/News/Press/docs/2012/sgsm14163.doc.htm (last access: 29 March 2012), 2012.
Bulsink, F., Hoekstra, A. Y., and Booij, M. J.: The water footprint of Indonesian provinces related to the consumption of crop products, Hydrol. Earth Syst. Sci., 14, 119–128,
20
doi:10.5194/hess-14-119-2010, 2010.
Cai, Z. H., Liu, J., and Zhao, X.: Applying input-output analysis method for calculation of water footprint and virtual water trade in Gansu Province, Acta Ecologica Sinica, submitted, 2012. Chapagain, A. K. and Hoekstra, A. Y.: Water footprints of nations, Value of Water
Re-search Report Series No. 16, UNESCO-IHE, Delft, the Netherlands, available at: http:
25
//www.waterfootprint.org/Reports/Report16Vol1.pdf (last access: 29 March 2012), 2004. Chapagain, A. K. and Hoekstra, A. Y.: The water footprint of coffee and tea consumption in the
Netherlands, Ecol. Econ., 64, 109–118, 2007.
Chapagain, A. K. and Orr, S.: UK Water Footprint: the impact of the UK’s food and fibre consumption on global water resources, WWF-UK, Godalming, UK, August, available at:
30
HESSD
9, 5779–5808, 2012Assessing water footprint at river
basin level
Z. Zeng et al.
Title Page
Abstract Introduction
Conclusions References
Tables Figures
◭ ◮
◭ ◮
Back Close
Full Screen / Esc
Printer-friendly Version Interactive Discussion
Discussion
P
a
per
|
Dis
cussion
P
a
per
|
Discussion
P
a
per
|
Discussio
n
P
a
per
|
Chapagain, A. K., Hoekstra, A. Y., Savenije, H. H. G., and Gautam, R.: The water footprint of cotton consumption: An assessment of the impact of worldwide consumption of cotton products on the water resources in the cotton producing countries, Ecol. Econ., 60, 186– 203, 2006.
Chen, Y., Zhang, D., Sun, Y., Liu, X., Wang, N., and Savenije, H. H. G.: Water demand
man-5
agement: a case study of the Heihe River Basin in China, Phys. Chem. Earth, Pt. A/B/C, 30, 408–419, 2005.
Dudgeon, D., Arthington, A. H., Gessner, M. O., Kawabata, Z. I., Knowler, D. J., L ´ev ˆeque, C., Naiman, R. J., Prieur-Richard, A. H., Soto, D., and Stiassny, M. L. J.: Freshwater biodiversity: importance, threats, status and conservation challenges, Biol. Rev., 81, 163–182, 2006.
10
Ercin, A. E., Mekonnen, M. M., and Hoekstra, A. Y.: The water footprint of France, Value of Water Research Report Series No. 56, UNESCO-IHE, Delft, the Netherlands, available at: http://www.waterfootprint.org/Reports/Report56-WaterFootprintFrance.pdf (last access: 29 March 2012), 2012.
Falconer, R. A., Norton, M. R., Fernando, H. J. S., Klai´c, Z., and McCulley, J. L.: Global Water
15
Security: Engineering the Future National Security and Human Health Implications of Cli-mate Change, in, NATO Science for Peace and Security Series C: Environmental Security, Springer Netherlands, 261–269, 2012.
Falkenmark, M.: Freshwater as shared between society and ecosystems: from divided ap-proaches to integrated challenges, Philos. T. Roy. Soc. B, 358, 2037–2049, 2003.
20
Falkenmark, M. and Rockstr ¨om, J.: The new blue and green water paradigm: Breaking new ground for water resources planning and management, J. Water Res. Pl.-ASCE, 132, 129– 132, doi:10.1061/(ASCE)0733-9496(2006)132:3(129), 2006.
FAO: New LocClim, Local Climate Estimator CD-ROM, Food and Agriculture Organization of the United Nations, Rome, Italy, available at: http://www.fao.org/nr/climpag/pub/en3 051002
25
en.asp (last access: 1 March 2012), 2005.
FAO: CROPWAT 8.0 Model, Food and Agriculture Organization of the United Nations, Rome, Italy, available at: http://www.fao.org/nr/water/infores databases cropwat.html (last access: 1 March 2012), 2010a.
FAO: Global map maximum soil moisture-at 5 arc minutes, GeoNetwork grid database,
30
HESSD
9, 5779–5808, 2012Assessing water footprint at river
basin level
Z. Zeng et al.
Title Page
Abstract Introduction
Conclusions References
Tables Figures
◭ ◮
◭ ◮
Back Close
Full Screen / Esc
Printer-friendly Version Interactive Discussion
Discussion
P
a
per
|
Dis
cussion
P
a
per
|
Discussion
P
a
per
|
Discussio
n
P
a
per
|
FAO: Animal Production and Health division, Food and Agriculture Organization of the United Nations, Rome, Italy, available at: http://www.fao.org/AG/againfo/resources/en/glw/ GLW dens.html (last access: 1 March 2012), 2011.
GSMWR: Gansu Water Resources Bulletin, Gansu Province Ministry of Water Resource, Lanzhou, China, available at: http://www.gssl.gov.cn/shuizygb/index.html (last access:
5
1 March 2012), 2006.
Hoekstra, A. Y. (Ed.): “Virtual water trade: Proceedings of the International Expert Meeting on Virtual Water Trade”, Value of Water Research Report Series No. 12, UNESCO-IHE, Delft, the Netherlands, available at: http://www.waterfootprint.org/Reports/Report12.pdf (last access: 1 March 2012), 2003.
10
Hoekstra, A. Y. and Chapagain, A. K.: Water footprints of nations: water use by people as a function of their consumption pattern, Water Resour. Manag., 21, 35–48, 2007.
Hoekstra, A. Y. and Mekonnen, M. M.: The water footprint of humanity, P. Natl. Acad. Sci., 109, 3232–3237, 2012.
Hoekstra, A. Y., Chapagain, A. K., and Aldaya, M. M.: The water footprint assessment
15
manual, Earthscan, London, UK, available at: http://www.waterfootprint.org/?page=files/ WaterFootprintAssessmentManual (last access: 1 March 2012), 2011.
Hoekstra, A. Y., Mekonnen, M. M., Chapagain, A. K., Mathews, R. E., and Richter, B. D.: Global monthly water scarcity: blue water footprints versus blue water availability, Plos ONE, 7, e32668, doi:10.1371/journal.pone.0032688, 2012.
20
Ji, X., Kang, E., Chen, R., Zhao, W., Xiao, S., and Jin, B.: Analysis of water resources supply and demand and security of water resources development in irrigation regions of the middle reaches of the Heihe River Basin, Northwest China, Agricultural Sciences in China, 5, 130– 140, 2006.
Jos ´e, A., Elena, C., and Javier, T.: Water quality and nonpoint pollution, in: Re-thinking Water
25
and Food Security, CRC Press, 251–256, 2010.
Kampman, D., Hoekstra, A. Y., and Krol, M.: The water footprint of India, Value of Water Re-search Report Series No. 32, UNESCO-IHE, Delft, the Netherlands, 2008.
Kang, E., Lu, L., and Xu, Z.: Vegetation and carbon sequestration and their relation to water resources in an inland river basin of Northwest China, J. Environ. Manage., 85, 702–710,
30
2007.
HESSD
9, 5779–5808, 2012Assessing water footprint at river
basin level
Z. Zeng et al.
Title Page
Abstract Introduction
Conclusions References
Tables Figures
◭ ◮
◭ ◮
Back Close
Full Screen / Esc
Printer-friendly Version Interactive Discussion
Discussion
P
a
per
|
Dis
cussion
P
a
per
|
Discussion
P
a
per
|
Discussio
n
P
a
per
|
Liu, J. and Savenije, H. H. G.: Food consumption patterns and their effect on water requirement in China, Hydrol. Earth Syst. Sci., 12, 887–898, doi:10.5194/hess-12-887-2008, 2008. Liu, J., Zehnder, A. J. B., and Yang, H.: Global consumptive water use for crop
produc-tion: The importance of green water and virtual water, Water Resour. Res., 45, W05428, doi:10.1029/2007WR006051, 2009.
5
Ma, J., Hoekstra, A. Y., Wang, H., Chapagain, A. K., and Wang, D.: Virtual versus real water transfers within China, Philos. T. Roy. Soc. B, 361, 835–842, 2006.
Mekonnen, M. M. and Hoekstra, A. Y.: The green, blue and grey water footprint of crops and derived crop products, Hydrol. Earth Syst. Sci., 15, 1577–1600, doi:10.5194/hess-15-1577-2011, 2011.
10
Mekonnen, M. M. and Hoekstra, A. Y.: A global assessment of the water footprint of farm animal products, Ecosystems, 15, 401–415, 2012.
Oki, T. and Kanae, S.: Global hydrological cycles and world water resources, Science, 313, 1068–1072, 2006.
Perry, C.: Efficient irrigation; inefficient communication; flawed recommendations, Irrig. Drain.,
15
56, 367–378, 2007.
Portmann, F. T., Siebert, S., and D ¨oll, P.: MIRCA2000-Global monthly irrigated and rainfed crop areas around the year 2000: A new high-resolution data set for agricultural and hydrological modelling, Global Biogeochem. Cy., 24, GB1011, doi:10.1029/2008GB003435, 2010. Postel, S. L., Daily, G. C., and Ehrlich, P. R.: Human appropriation of renewable fresh water,
20
Science, 271, 785–788, 1996.
Qi, S. and Cai, Y.: Mapping and assessment of degraded land in the HRB, arid northwestern China, Sensors, 7, 2565–2578, 2007.
RESDC: Precipitation map in China, Data Center for Resources and Environmental Sci-ences Chinese Academy of SciSci-ences, available at: http://www.resdc.cn/map/showmap.asp?
25
showmap=D7A8CCE2B5D8C0EDCAFDBEDD (last access: 1 March 2012), 2012.
Savenije, H. H. G.: Water scarcity indicators; the deception of the numbers, Phys. Chem. Earth Pt. B, 25, 199–204, 2000.
Shiklomanov, I. A.: Appraisal and assessment of world water resources, Water Int., 25, 11–32, 2000.
30
HESSD
9, 5779–5808, 2012Assessing water footprint at river
basin level
Z. Zeng et al.
Title Page
Abstract Introduction
Conclusions References
Tables Figures
◭ ◮
◭ ◮
Back Close
Full Screen / Esc
Printer-friendly Version Interactive Discussion
Discussion
P
a
per
|
Dis
cussion
P
a
per
|
Discussion
P
a
per
|
Discussio
n
P
a
per
|
Van Oel, P. R., Mekonnen, M. M., and Hoekstra, A. Y.: The external water footprint of the Netherlands: Geographically-explicit quantification and impact assessment, Ecol. Econ., 69, 82–92, 2009.
V ¨or ¨osmarty, C. J., Green, P., Salisbury, J., and Lammers, R. B.: Global water re-sources: vulnerability from climate change and population growth, Science, 289, 284–288,
5
doi:10.1126/science.289.5477.284, 2000.
V ¨or ¨osmarty, C. J., McIntyre, P., Gessner, M. O., Dudgeon, D., Prusevich, A., Green, P., Glidden, S., Bunn, S. E., Sullivan, C. A., and Liermann, C. R.: Global threats to human water security and river biodiversity, Nature, 467, 555–561, 2010.
Yang, H.: Growth in China’s grain production 1978–1997: a disaggregate analysis, World Dev.,
10
27, 2137–2154, 1999.
Yang, H., Reichert, P., Abbaspour, K. C., and Zehnder, A. J. B.: A water resources threshold and its implications for food security, Environ. Sci. Technol., 37, 3048–3054, 2003.
Zang, C. F., Liu, J., van der Velde, M., and Kraxner, F.: Assessment of spatial and temporal patterns of green and blue water flows in inland river basins in Northwest China, Hydrol.
15
Earth Syst. Sci. Discuss., 9, 3311–3338, doi:10.5194/hessd-9-3311-2012, 2012.
Zhang, D.: Virtual water trade in China with a case study for the Heihe river basin, Master thesis, UNESCO-IHE, Delft, the Netherlands, 14–82, 2003.
Zhao, C., Nan, Z., and Cheng, G.: Methods for estimating irrigation needs of spring wheat in the middle Heihe basin, China, Agr. Water Manage., 75, 54–70, 2005.
HESSD
9, 5779–5808, 2012Assessing water footprint at river
basin level
Z. Zeng et al.
Title Page
Abstract Introduction
Conclusions References
Tables Figures
◭ ◮
◭ ◮
Back Close
Full Screen / Esc
Printer-friendly Version Interactive Discussion
Discussion
P
a
per
|
Dis
cussion
P
a
per
|
Discussion
P
a
per
|
Discussio
n
P
a
per
|
Table 1.Annual harvested area and crop production within the HRB (2004–2006). Crop Representative Harvested area Production type crop (thousand ha) (thousand ton) Wheat Wheat 53 322
Maize Maize 30 239 Other cereals Barley 50 352 Soybean Soybean 3 21 Starchy roots Potato 11 87 Oil crops Rapeseed 18 47 Sugar crops Sugar beet 8 190 Cotton Cotton 21 46 Apple Apple 5 27 Other fruits Pear 45 229 Vegetables Tomato 27 740 Other crops All above crops ∗ 366
HESSD
9, 5779–5808, 2012Assessing water footprint at river
basin level
Z. Zeng et al.
Title Page
Abstract Introduction
Conclusions References
Tables Figures
◭ ◮
◭ ◮
Back Close
Full Screen / Esc
Printer-friendly Version Interactive Discussion
Discussion
P
a
per
|
Dis
cussion
P
a
per
|
Discussion
P
a
per
|
Discussio
n
P
a
per
|
Table 2.Virtual water content (VWC), water footprint (WF) and blue water proportion (BWP) of crop and livestock production within the HRB (2004–2006).
Crop VWC WF
BWP type (m3t−1) (million m3yr−1)
HESSD
9, 5779–5808, 2012Assessing water footprint at river
basin level
Z. Zeng et al.
Title Page
Abstract Introduction
Conclusions References
Tables Figures
◭ ◮
◭ ◮
Back Close
Full Screen / Esc
Printer-friendly Version Interactive Discussion
Discussion
P
a
per
|
Dis
cussion
P
a
per
|
Discussion
P
a
per
|
Discussio
n
P
a
per
|