© Author(s) 2008. This work is distributed under the Creative Commons Attribution 3.0 License.
Geosciences
A method to assess instream water quality – the role of nitrogen
entries in a North German rural lowland catchment
B. Schmalz, K. Bieger, and N. Fohrer
Dept. Hydrology and Water Resources Management, Ecology Centre, Kiel Univ., Olshausenstr. 40, D-24098 Kiel, Germany Received: 16 January 2008 – Revised: 26 March 2008 – Accepted: 28 May 2008 – Published: 20 June 2008
Abstract. The objective of this study was the detection
and assessment of nutrient entry pathways in a complex mesoscale lowland catchment. The central aim was the de-velopment of a transferable method for an efficient estima-tion of instream water quality in rural environments. The investigated Kielstau catchment with a size of approximately 50 km2is located in the North German lowlands. Land use is dominated by agriculture as well as pasture and is charac-terised by extensive artificial drainage systems. Additionally wastewater treatment plants influence the river water quality. Six measuring campaigns were carried out over the period of one year. Each time, water quality was assessed at 16 locations along a 12 km longitudinal transect of the stream to consider the influence of each tributary or inflow. The re-sults showed that the applied measuring method was useful to assess nutrient entry pathways into surface waters from dif-fuse and point sources. Some tributaries increased the main stream NO3-N concentrations especially in autumn. Using
a German classification system (LAWA, 1998), the NO3
-N results can mostly be assigned to water quality class III (heavily contaminated). Water balance and nitrate loads were modelled with the river basin scale model SWAT (Soil and Water Assessment Tool, Arnold et al., 1998). The measured and modelled discharges showed a good correlation. While nitrate load range and dynamics are well represented during the summer periods, they show a poor correlation during the winter period.
Correspondence to:B. Schmalz ([email protected])
1 Introduction
Since December 2000, the integrated protection of all wa-ter bodies has been legally regulated for all European Union member states by the European Water Framework Directive (EC, 2000). Many rivers still do not reach a good status, which is aimed at for the year 2015. Concerning the chemical water quality the sources of poor quality and their pathways have to be detected. Tributaries can have a substantial influ-ence on the nutrient balance of surface water bodies. Some tributaries can differ considerably from the main stream re-garding the analysed parameters. According to Johnes and Burt (1993), obvious changes of nutrient concentrations and loads can occur downstream of tributaries and point sources. Lowland areas are characterised by a flat topography, low hydraulic gradients and near-surface groundwater. Drainage systems like tile drainage and open ditches change the natural water balance and influence the instream water quality due to a faster nutrient transport. Hooda et al. (1997) examined six small streams in agricultural catchment areas in Scotland and found that field drains or smaller ditches, despite having rela-tively high NO3-N concentrations, contributed small overall
loadings and had either only short-range or no detectable im-pact on stream concentrations. David et al. (1997) detected high NO3-N concentrations within the range of 5 to 49 mg/l
in drainage tiles in an agricultural catchment area in Illinois. In addition they found that during high flow events and in-tense precipitation the drainage systems have a substantial contribution to the NO3-N loss from agricultural fields.
Fig. 1.Kielstau catchment (size: 50 km2), with tributaries and loca-tion of wastewater treatment plants, important farms, and sampling points.
2 Investigation area
The mesoscale investigation area “Kielstau catchment” is lo-cated in the lowland area of Schleswig-Holstein in North-ern Germany. Sandy and loamy soils are characteristic for the catchment, with peat occurring along the streams. Land use is dominated by arable land and pasture. The maximum height difference is 49 m. The precipitation is 841 mm/a (sta-tion Satrup, 1961–1990, DWD, 2008) and the mean annual temperature 8.2◦
C (station Flensburg 1961–1990, DWD, 2008). The size of the Kielstau catchment (Fig. 1) is about 50 km2. The river Kielstau has a total length of 17 km and flows through the Lake Winderatt, which is surrounded by nature protection areas with moderate grazing. There are two important tributaries from the north, the Moorau and the Hennebach. In addition various smaller tributaries as well as drainage pipes and open ditches discharge into the Kielstau. The drained fraction of agricultural area in the Kielstau catchment is estimated to be 38% (Fohrer et al., 2007).
In the Kielstau catchment, nutrient entries from various farms in form of mineral fertiliser and manure application or animal husbandry in river vicinity as well as urban areas and a total of six wastewater treatment plants play an impor-tant role for the instream water quality (Schmalz et al., 2007). One wastewater treatment plant is situated at the beginning of the Moorau (3000 population equivalents), three are located along the Hennebach (461, 447, and 240 population equiva-lents) and another two (1880 and 350 population equivaequiva-lents) are discharging directly into the Kielstau (Fig. 1).
0 2 4 6 8 10 12 14 0 1
2a 2z 2b 3a 3z 3b 4 5 6a 6z 6b 7a 7z 7b 8a 8z 8b 9a 9z 9b 10 11a 11z 11b 12 13a 13z 13b 14a 14z 14b 15
Messpunkt
NO
3
-N
[mg/l]
Zulauf Kielstau GK I GK I-II GK II GK II-III GK III
Sampling point inflow 0 2 4 6 8 10 12 14 0 1
2a 2z 2b 3a 3z 3b 4 5 6a 6z 6b 7a 7z 7b 8a 8z 8b 9a 9z 9b 10 11a 11z 11b 12 13a 13z 13b 14a 14z 14b 15
Messpunkt
NO
3
-N
[mg/l]
Zulauf Kielstau GK I GK I-II GK II GK II-III GK III
Sampling point inflow 0 2 4 6 8 10 12 14 0 1
2a 2z 2b 3a 3z 3b 4 5 6a 6z 6b 7a 7z 7b 8a 8z 8b 9a 9z 9b 10 11a 11z 11b 12 13a 13z 13b 14a 14z 14b 15
Messpunkt NO 3 -N [ m g /l ]
Zulauf Kielstau GK I GK I-II GK II GK II-III GK III
Sampling point inflow 0 2 4 6 8 10 12 14 0 1
2a 2z 2b 3a 3z 3b 4 5 6a 6z 6b 7a 7z 7b 8a 8z 8b 9a 9z 9b 10 11a 11z 11b 12 13a 13z 13b 14a 14z 14b 15
Messpunkt NO 3 -N [ m g /l ]
Zulauf Kielstau GK I GK I-II GK II GK II-III GK III
Sampling point
inflow
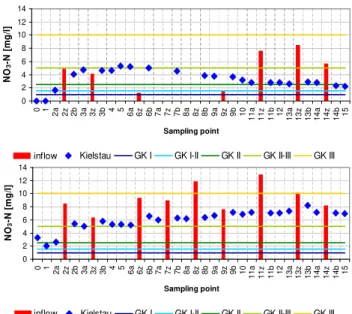
Fig. 2. Nitrate concentrations along the longitudinal river profile of the Kielstau with LAWA water quality classes (GK) at 2 dates: (above) 19 July 2006 and (below) 15 November 2006. Sampling points situated upstream (a) and downstream (b) in the Kielstau as well as directly in the tributary (z).
3 Methods
The water quality was measured at seven single points (no. 0, 1, 4, 5, 10, 12, 15) and nine tributaries (ditches no. 3, 8, 14; drainage pipes no. 7, 11, 13; tributaries no. 2, 6, 9) along the longitudinal profile of the Kielstau during six campaigns from March 2006 to January 2007 (Fig. 1). The first sample was taken from the Lake Winderatt, the next sampling point was situated 700 m downstream of the lake outflow and the last one was located at the gauge Soltfeld at the catchment outlet (no. 15). Altogether a stream section of about 12 km was considered. At the confluence of tributaries the sampling took place upstream (a) and downstream (b) in the Kielstau as well as directly in the tributary (z; abbreviations used in Fig. 2). The nitrogen fractions NH4-N, NO3-N and Ntotwere
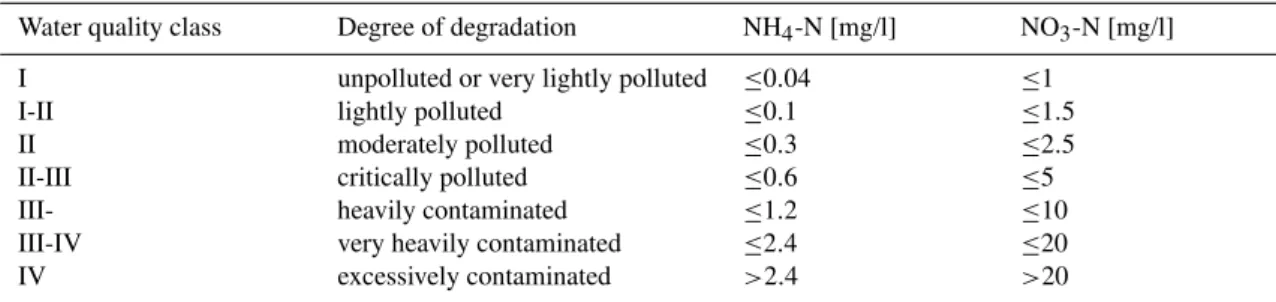
analysed in the lab according to standard methods using pho-tometry and ion chromatography. A general water quality classification was conducted using the “LAWA procedure for the chemical classification of water bodies” (LAWA, 1998). The LAWA is the German Working Group on water issues of the Federal States and the Federal Government. This system specifies water quality classes (Table 1) from I (unpolluted) to IV (excessively contaminated). Quality class II (moder-ately polluted) represents the target value for water quality until the year 2015 according to the European Water Frame-work Directive.
Table 1.Water quality classes for surface water bodies according to LAWA (1998) and their thresholds for NH4-N and NO3-N.
Water quality class Degree of degradation NH4-N [mg/l] NO3-N [mg/l]
I unpolluted or very lightly polluted ≤0.04 ≤1
I-II lightly polluted ≤0.1 ≤1.5
II moderately polluted ≤0.3 ≤2.5
II-III critically polluted ≤0.6 ≤5
III- heavily contaminated ≤1.2 ≤10
III-IV very heavily contaminated ≤2.4 ≤20
IV excessively contaminated >2.4 >20
this complex hydrological catchment. SWAT is a semi-distributed, process-oriented model for simulating water, nu-trient and pesticide transport in mesoscale catchments. The catchment area is represented by subbasins and Hydrological Response Units (HRU; hydrotopes).
The Kielstau model is based on data collected during our own measuring campaigns and data provided by German authorities and institutions (see in detail in Tavares, 2006, Bieger, 2007):
– digital elevation model 25 m×25 m (LVermA, 1995),
– soil map 1:200 000 (BGR, 1999),
– land use map 25 m×25 m (Deutsches Zentrum f¨ur Luft-und Raumfahrt DLR, 1995),
– climate data (temperature, precipitation, wind speed, humidity) 1957–2006 (Deutscher Wetterdienst DWD, 2007),
– hourly discharge data of Kielstau at gauge Soltfeld (StUa Schleswig, 2007) 1984–2006
– sewage disposal data of 6 wastewater treatment plants (Kreis Schleswig-Flensburg, 2006).
The model runs covered the time period from November 1984 until October 2006. Due to lack of a longer measured time series the NO3-N modelling was conducted only for the
period from June 2005 until October 2006. Simulations were run on a daily time step.
The catchment was divided into 8 subbasins and 117 HRUs. Wastewater treatment plants were implemented as point sources. Fertiliser inputs were taken into consideration by adjusting the management options for the land use classes. Arable land is implemented with two different crop rotations considering a) winter wheat–rape, and b) maize. Measured NO3-N concentrations (June 2005–October 2006 of
Depart-ment of Hydrology and Water Resources ManageDepart-ment of Ecology Centre at Kiel University, Tavares, 2006, Bieger, 2007) were used for estimation of the model efficiency (Nash and Sutcliffe, 1970).
4 Nitrogen concentrations and loads
4.1 Measured nitrogen concentrations along the river lon-gitudinal profile
NO3-N concentrations at the beginning of the Kielstau
down-stream of the Lake Winderatt (no. 1) were relatively low, whereas the tributary Moorau (no. 2z) showed clearly ele-vated NO3-N values at all six measuring dates (Fig. 2). The
NH4-N concentrations were also high in the Moorau and
in-creased the Kielstau concentrations at all six dates. The water quality of the Moorau is strongly influenced by a wastewater treatment plant. Additionally a poultry farm in close prox-imity to the stream affects the water quality and storm water drains from a nearby village enter the stream through a pipe. Considering the summer period, in July 2006, no further NO3-N concentration increase by tributaries was measured,
because they were carrying little or no water or exhibited low nutrient concentrations. Along the river profile NO3-N
con-centrations decreased by dilution, denitrification and plant uptake (Fig. 2). Looking at the late autumn conditions, in November 2006, Tributaries no. 3, 6 and 13 caused an in-crease of the observed NO3-N values in the Kielstau,
result-ing in a slight increase of the values along the entire river profile (Fig. 2).
In six agricultural catchment areas in Scotland also Hooda et al. (1997) observed that nitrate stream concentrations were generally larger downstream compared with upstream, re-flecting input from the farms. Seasonal variations of riverine export of nitrate from agricultural watersheds in Illinois were examined by Royer et al. (2006). They found that the major-ity of the annual NO3-N export occurred from mid-January
through June across all monitored sites and years from 1994 to 2005.
Using the LAWA classification, the NO3-N values
(Kielstau without tributaries) can be categorized in the fol-lowing water quality classes:
0.0 1.0 2.0 3.0 4.0 5.0
01/Nov/1989 01/Nov/1990 01/Nov/1991 01/Nov/1992 01/Nov/1993 01/Nov/1994 01/Nov/1995 01/Nov/1996 01/Nov/1997 01/Nov/1998
discharge [m3/s]
measured simulated
Fig. 3. Measured and modelled daily discharge at the Kielstau catchment outlet, gauge Soltfeld, during calibration period Novem-ber 1989–OctoNovem-ber 1999 (Nash-Sutcliffe index is 0.73; coefficient of correlation is 0.86).
– in July 2006: mostly II–III (range from II to III) (Fig. 2)
– in November 2006: mostly III (range from II to III) (Fig. 2).
4.2 Modelled nitrate loads
Modelling the water balance with SWAT, the measured and modelled discharges showed a good correlation with a Nash-Sutcliffe index of 0.73 during calibration period (November 1989–October 1999; Fig. 3) and 0.46 during validation pe-riod (November 1999–October 2006). The coefficient of cor-relation was 0.86 and 0.73, respectively. The model setup and the calibration were based on implementing drainage, ponds and wetlands as well as on the adjustment of Curve Number values and specific groundwater parameters (Bieger, 2007). The results can be used to assess the amounts of dis-charge in the Kielstau area which is the base for load calcu-lations.
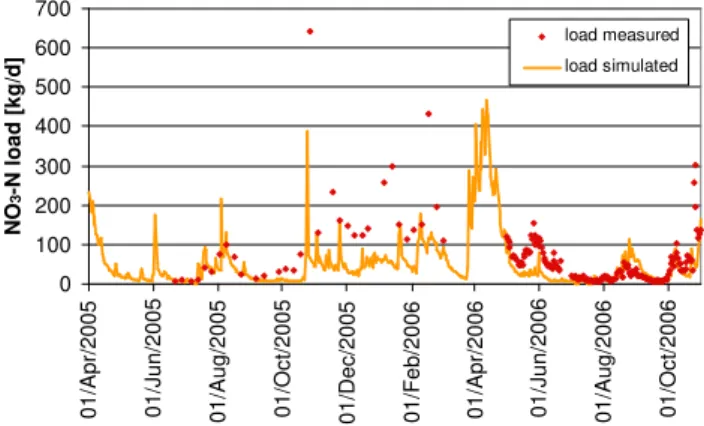
Figure 4 shows the modelled daily NO3-N loads at the
out-let of the catchment at gauge Soltfeld with the SWAT model. During the summer periods 2005 and 2006 the range as well as the general dynamic of the nitrate load were well repre-sented by the model. In contrast, the NO3-N values during
the winter period were represented poorly. This can be at-tributed to two reasons: Firstly, the discharge and, accord-ingly, the nitrate loads are underestimated by the model. Sec-ondly, the higher N concentrations in winter, caused by N mobilisation from the catchment, are not represented in the model. The Nash-Sutcliffe index for the calibration period is 0.55 and the coefficient of correlation is 0.84. Calibration was conducted by the nitrate percolation coefficient as well as by the rate factor for humus mineralization of active or-ganic nutrients. Further calibration is required to improve the model performance. The period of existing measuring data is still too short for a model validation.
0 100 200 300 400 500 600 700
01/Apr/2005 01/Jun/2005 01/Aug/2005 01/Oct/2005 01/Dec/2005 01/Feb/2006 01/Apr/2006 01/Jun/2006 01/Aug/2006 01/Oct/2006
NO
3
-N load [kg/d]
load measured
load simulated
Fig. 4.Measured and modelled daily NO3-N loads at the Kielstau catchment outlet, gauge Soltfeld, during calibration period June 2005-October 2006 (Nash-Sutcliffe index is 0.55; coefficient of cor-relation is 0.84).
5 Conclusions
Nutrient entry pathways into surface waters from diffuse and point sources were assessed by measurements and an eco-hydrological modelling. Inputs from agriculture as well as wastewater treatment plants were taken into account. We tested a measuring method to consider the totality of in-flows like larger tributaries as well as smaller ditches or drain tiles. The strategy was successful by identifying the main inflows which contribute the largest concentrations. Using the Kielstau catchment as an example for a typical lowland catchment with mainly agricultural land use and a large frac-tion of drained fields, this method is transferable to other lowland catchments with a large fraction of drained agricul-tural areas.
References
Arnold, J.-G., Srinivasan, R., Muttiah, R. S., and Williams, J. R.: Large area hydrologic modelling and assessment, Part I: Model development. Journal of the American Water Resources Associ-ation 34(l), 73–89, 1998.
BGR (Bundesanstalt f¨ur Geowissenschaften und Rohstoffe (Ed.)): Boden¨ubersichtskarte im Maßstab 1:200 000, Verbreitung der Bodengesellschaften, Hannover, 1999.
Bieger, K.: Integrierte Analyse der Wasserqualit¨at eines Fließgew¨assers im l¨andlich gepr¨agten Raum des Nord-deutschen Tieflands. Diplomarbeit im Fach Geographie,
¨
Okologie-Zentrum Christian-Albrechts-Universit¨at zu Kiel. p. 142, http://www.hydrology.uni-kiel.de/lehre/abschlussarbeiten/ 2008 kbieger kielstauqualitaet.pdf, 2007.
David, M. B., Gentry, L. E., Kovacic, D. A., and Smith, K. M.: Nitrogen balance in and export from an agricultural watershed, J. Environ. Qual., 26(4), 1038–1048, 1997.
DLR (Deutsches Zentrum f¨ur Luft- und Raumfahrt): Landsat TM5-Scene of 1995, upper left corner: RW: 3503180 HW: 6084975, spatial resolution 25 m×25 m, K¨oln, 1995.
DWD (Deutscher Wetterdienst): Climate data 1957–2006, 2007. DWD (Deutscher Wetterdienst): Means of precipitation and air
temperature of the period 1961–1990, http://www.dwd.de/de/ FundE/Klima/KLIS/daten/online/nat/index mittelwerte.htm, last access 3 Januar 2008, 2008.
EC: Directive 2000/60/EC of the European Parliament and of the Council of 23 October 2000 establishing a framework for the Community action in the field of water policy. Official Journal of the European Communities L 327/1. 2000.
Fohrer, N., Schmalz, B., Tavares, F., and Golon, J.: Ans¨atze zur Integration von landwirtschaftlichen Drainagen in die Modellierung des Landschaftswasserhaushalts von mesoskaligen Tieflandeinzugsgebieten. Hydrologie & Wasserbewirtschaftung, 51(4), 164–169, 2007.
Hooda, P. S., Moynagh, M., Svoboda, I. F., Thurlow, M., Stew-art, M., Thomson, M., and Anderson, H. A.: Streamwater nitrate concentrations in six agricultural catchments in Scotland. Sci-ence of the Total Environment, 201, 63–78, 1997.
Johnes, P. J. and Burt, T. P.: Nitrate in Surface Waters. In: Ni-trate: Processes, Patterns and Management, edited by: Burt, T. P., Heathwaite, A. L., and Trudgill, S. T., John Wiley & Sons Ltd., Chichester. 269–317, 1993.
Kreis Schleswig-Flensburg: Kl¨aranlagen-Einleiterdaten, FD Wasserwirtschaft, Schleswig, 2006.
LAWA (L¨anderarbeitsgemeinschaft Wasser): Beurteilung der Wasserbeschaffenheit von Fließgew¨assern in der Bundesrepublik Deutschland – Chemische Gew¨asserg¨uteklassifikation, Kultur-buchverlag Berlin, 1998.
LVermA (Landesvermessungsamt Schleswig-Holstein): Digitales Gel¨andemodell f¨ur Schleswig-Holstein. Quelle: TK 25. Git-terweite 25 m×25 m und TK 50 Gitterweite 50 m×50 m, Kiel, 1995.
Nash, J. E. and Sutcliffe, J. V.: River flow forecasting through con-ceptual models part I - A discussion of principles, J. Hydrol., 10(3), 282–290, 1970.
Royer, T. V., David, M. B., and Gentry, L. E.: Timing of riverine export of nitrate and phosphorus from agricultural watersheds in Illinois: Implications for reducing nutrient loading to the Missis-sippi River, Environ. Sci. Technol. 40, 4126–4131, 2006. Schmalz, B., Tavares, F., and Fohrer, N.: Assessment of nutrient
en-try pathways and dominating hydrological processes in lowland catchments, Adv. Geosci., 11, 107–112, 2007,
http://www.adv-geosci.net/11/107/2007/.
StUa Schleswig (Staatliches Umweltamt Schleswig): Hourly dis-charge data 1984–2006, 2007.