www.atmos-chem-phys.org/acp/3/211/
Chemistry
and Physics
Experimental investigation of homogeneous freezing of sulphuric
acid particles in the aerosol chamber AIDA
O. M¨ohler1, O. Stetzer1, S. Schaefers1, C. Linke1, M. Schnaiter1, R. Tiede1, H. Saathoff1, M. Kr¨amer2, A. Mangold2, P. Budz3, P. Zink3, J. Schreiner3, K. Mauersberger3, W. Haag4, B. K¨archer4, and U. Schurath1
1Forschungszentrum Karlsruhe (FZK), Institute of Meteorology and Climate Research (IMK-AAF), Karlsruhe, Germany 2Forschungszentrum J¨ulich (FZJ), Institut f¨ur Chemie und Dynamik der Geosph¨are (ICG-1), J¨ulich, Germany
3Max-Planck-Institut f¨ur Kernphysik (MPIK), Abteilung Atmosph¨arenphysik, Heidelberg, Germany
4Deutsches Zentrum f¨ur Luft- und Raumfahrt (DLR), Institut f¨ur Physik der Atmosph¨are (IPA), Oberpfaffenhofen, Germany Received: 27 August 2002 – Published in Atmos. Chem. Phys. Discuss.: 7 October 2002
Revised: 16 December 2002 – Accepted: 14 January 2003 – Published: 20 February 2003
Abstract. The homogeneous freezing of supercooled H2SO4/H2O solution droplets was investigated in the aerosol chamber AIDA (Aerosol Interactions and Dynamics in the Atmosphere) of Forschungszentrum Karlsruhe. 24 freezing experiments were performed at temperatures between 189 and 235 K with aerosol particles in the diameter range 0.05 to 1µm. Individual experiments started at homogeneous temperatures and ice saturation ratios between 0.9 and 0.95. Cloud cooling rates up to−2.8 K min−1were simulated dy-namically in the chamber by expansion cooling using a me-chanical pump. Depending on the cooling rate and starting temperature, freezing threshold relative humidities were ex-ceeded after expansion time periods between about 1 and 10 min. The onset of ice formation was measured with three independent methods showing good agreement among each other. Ice saturation ratios measured at the onset of ice for-mation increased from about 1.4 at 231 K to about 1.75 at 189 K. The experimental data set including thermodynamic parameters as well as physical and chemical aerosol analysis provides a good basis for microphysical model applications.
1 Introduction
Homogeneous freezing of supercooled liquid aerosols is thought to be one of the key steps in the formation of cir-rus clouds in the upper troposphere (Heymsfield and Milo-shevich, 1993; Jensen et al., 1998) and of polar strato-spheric clouds (PSCs) in the lower stratosphere (Jensen et al., 1991; Peter, 1997; Tabazadeh et al., 1997b; Carslaw et al., 1998a). Homogeneous freezing nucleation in atmospheric micrometer-sized aerosol droplets occurs at temperatures
be-Correspondence to:O. M¨ohler (Ottmar.Moehler@imk.fzk.de)
tween 235 and 185 K only if critical ice supersaturations of 40 to 70% are exceeded. High ice supersaturations are in-duced locally by orographic waves (Carslaw et al., 1998b; Jensen et al., 1998; Field et al., 2001), but are also mea-sured quite frequently in wide-spread regions with different updraft velocities in the upper troposphere (Jensen et al., 1999; Gierens et al., 2000; Jensen et al., 2001). Numer-ous previNumer-ous studies showed the importance of homogeneNumer-ous freezing of sulphuric acid aerosols for cirrus cloud forma-tion (Tabazadeh et al., 1997a; Jensen et al., 1998) and in-vestigated climatically relevant cirrus properties like optical thickness (Jensen et al., 1994) or ice crystal number con-centration, size and shape (Lawson et al., 1998). Modellers made first attempts to relate occurrence and properties of cirrus clouds to thermodynamic and microphysical forma-tion mechanisms (Jensen and Toon, 1994; K¨archer, 2002; K¨archer and Lohmann, 2002). More recently, a global cli-mate model was improved to interactively simulate cirrus cloud formation by homogeneous freezing (Lohmann and K¨archer, 2002).
of NAT particles in the polar stratosphere (Schreiner et al., 1999; Voigt et al., 2000).
Homogeneous ice nucleation in aqueous particles was in-vestigated in numerous laboratory studies, see Martin (2000) and references therein. In more recent laboratory studies of sulphuric acid solutions, the freezing was initiated by fast cooling of relatively large solution droplets deposited on a hydrophobic surface (Koop et al., 1998) or suspended in air passing a temperature controlled flow tube at high flow speed (Bertram et al., 1996; Prenni et al., 2001). The strong super-cooling below the solution/ice coexistence temperature re-quired for ice nucleation was achieved at almost constant solute concentration during the cooling period. In contrast, Chen et al. (2000) investigated homogeneous freezing of su-percooled sulphuric acid aerosol particles at well controlled ice supersaturated conditions in a continuous flow diffusion chamber. The freezing onset was directly related to the tem-perature and relative humidity with respect to ice. Ther-modynamic equilibrium composition of the aerosol particles was maintained by fast water vapour diffusion between the gas and condensed phases.
Recently, Koop et al. (2000) found that the ice nucleation rate in solutions of different chemical composition and solute concentration was almost the same for solutions of the same water activity at a given temperature. This work provides an activity-based parameterisation for treating homogeneous freezing in atmospheric models. To apply this parameterisa-tion, the water activity of individual aerosol particles has to be known. In thermodynamic equilibrium, the water activ-ity is directly related to the ambient temperature and relative humidity. However, the particle composition and therefore the water activity may also depend on kinetic effects, espe-cially at high cooling rates in atmospheric waves or convec-tive systems. Furthermore, the number and size of ice crys-tals in a cirrus cloud were shown to critically depend on the cooling rate during cirrus formation (K¨archer and Lohmann, 2002). Because complete sets of thermodynamic and aerosol data can hardly be obtained at high time resolution and pre-cision during field studies, it is difficult to use field results for constraining numerical calculations with respect to ice nucleation mechanisms.
In this work, we present results of experiments on ho-mogeneous ice nucleation in submicrometer-sized super-cooled sulphuric acid aerosol droplets conducted at the AIDA aerosol chamber facility of Forschungszentrum Karls-ruhe. Aerosol size distributions, temperatures, pressures, rel-ative humidities and cooling rates during 24 individual ex-pansion cooling experiments are typical for the upper tropo-sphere and lower stratotropo-sphere. Number densities exceeded typical atmospheric conditions which, however, does not af-fect the applicability of the present study to atmospheric con-ditions. The instrumentation of the AIDA chamber provides comprehensive data on thermodynamic quantities, detailed information about the physical and chemical aerosol proper-ties, as well as a sensitive detection of onset time of
freez-ing and growfreez-ing ice crystals with three independent meth-ods. This paper concentrates on describing the experimental methods and discussing results. A companion paper (Haag et al., 2003) shows results obtained by comparing the ex-perimental data with microphysical simulations of the ice initiation and the initial ice particle growth phase using the APSC (Advanced Particle Simulation Code) developed at Deutsches Zentrum f¨ur Luft- und Raumfahrt (DLR).
2 Ice nucleation experiments
2.1 AIDA aerosol and cloud chamber facility
Ice nucleation experiments were performed at the AIDA aerosol chamber facility of Forschungszentrum Karlsruhe (Nink et al., 2000; M¨ohler et al., 2001). Figure 1 shows a schematic cross section together with major technical com-ponents and scientific instrumentation used for ice nucleation experiments. The cylindrical aerosol vessel positioned in-side a large isolating containment is made of 2 cm thick alu-minium walls and has a height of 7 m, a diameter of 4 m, and a volume of 84 m3. The aerosol vessel can be evacuated to a final pressure of about 0.01 hPa by two large mechanical pumps that can be operated at different pumping speeds. The interior of the containment, and thus the aluminium vessel, can be cooled to any temperature between ambient tempera-ture and 183 K by circulating air through heat exchangers lo-cated at the bottom of the containment. Either a compressed cooling liquid (R404A) or liquid nitrogen is evaporated in the heat exchangers to achieve and maintain constant and homo-geneous temperatures≥233 K or≥183 K, respectively.
As will be described in Sects. 2.3 and 2.5, ice supersatu-rated conditions are established in the aerosol vessel by ex-pansion cooling with a mechanical pump. The impact of the aluminium walls on the gas temperature and on the wa-ter vapour concentration during expansions will also be dis-cussed in these sections.
Expansion Volume
Fig. 1.Schematic view of the AIDA experimental facility showing major technical components and instrumentation used for ice activation experiments. The circles on the dotted line indicate the positions of four thermocouples fixed to a vertical wire which were used to determine the mean gas temperature,Tg
off the vessel axis, cf. Fig. 1. The response times of these thermocouples to temperature changes during the expansions amounted to about 3 s at 1000 hPa, 5 s at 800 hPa, and 10 s at 180 hPa. Due to the hot spots mentioned above,Tgwas up to 0.8 K higher than the mean wall temperatureTw under con-ditions of constant pressure. To further homogenise the gas temperature in the vessel, a mixing ventilator was run 1 m above the vessel floor. This reduced the inhomogeneity to less than±0.1 K at constant pressure and to less than±0.3 K during expansions with the highest pumping speed of about 400 m3h−1.
2.2 Preparation of experiments
All ice nucleation (IN) experiments are started at almost ice saturated conditions inside the aerosol chamber. Ice satura-tion is achieved by (1) cooling the walls to 273 K, (2) evac-uating the vessel to 0.01 hPa, (3) flushing twice by adding about 5 hPa synthetic air and pumping below 0.01 hPa, (4) adding about 3 hPa water vapour into the vessel by evaporat-ing about 210 ml deionised water, (5) fillevaporat-ing to atmospheric pressure with dry synthetic air, and (6) slowly cooling the chamber at a rate between−2 and−4 K h−1to the starting temperature of the experiment. A water vapour pressure of 3 hPa corresponds to a frost point temperatureTf of about 265 K. As soon as the wall temperature drops belowTf, the excess water vapour is deposited on the vessel walls
form-ing a thin ice coatform-ing. The ice layer thickness is about 2µm assuming uniform water deposition to the surface of about 110 m2. A series of IN experiments at different temperatures was performed after each ice coating cycle.
Before each individual IN experiment at ice-coated wall conditions, the aerosol vessel is pumped off to a total pres-sure slightly above the ice saturation prespres-sure at the given temperature and flushed several times with about 5 hPa syn-thetic air to reduce the background concentration of aerosol particles below 5 cm−3. Pumping below the ice saturation pressure would cause rapid evaporation of the ice coating on the chamber walls. The evacuated chamber is refilled with dry synthetic air to the starting pressure. After refilling is completed as mentioned above, the ice coating establishes a relative humidity RHi with respect to ice between 90 and 95% within about 30 min becauseTg is slightly higher than
Twdue to heat sources in the chamber (e.g. heated sampling tubes for water measurements).
2.3 Method of expansion cooling
230 232 234 236 238 240
T
em
p
er
at
u
re
(K
)
0 5 10 15 20
Time (min) 800
850 900 950 1 000
P
re
ss
u
re
(h
P
a)
Mean Wall Temperature Tw
Mean Gas Temperature Tg
Adiabatic Temperature Profile
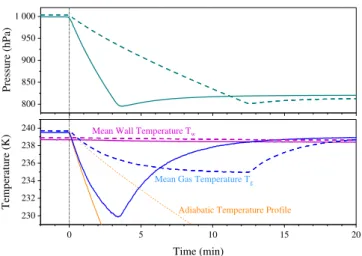
Fig. 2. Variation of pressure and mean gas temperature during pumping from about 1000 to 800 hPa at the maximum pumping speed (solid lines) and a moderate pumping speed (dashed lines). Both expansions were started at about 239.7 K. The adiabatic tem-perature profile calculated from the pressure decrease is also shown in the lower panel (thin yellow lines).
speeds. Figure 2 shows pressure and associated temperature variations at the highest pumping speed (solid lines) and at moderate pumping speeds (dashed lines). While these ex-pansions would be truly adiabatic in the atmosphere, leading to temperature variations shown by the thin yellow lines in the lower panel of Fig. 2, the cooling rates in the AIDA vessel start to deviate from those of the yellow lines. This is caused by an increasing heat flux from the 2 cm thick aluminium walls which remain at almost constant temperature during the pumping events due to their high heat capacity. After a pumping period of typically 10 to 15 min the gas temperature levels off at a dynamic equilibrium value which represents the balance between further expansion cooling and heat flux from the warmer aluminium walls into the gas. Cooling rates and the maximum temperature differences1T =Tw−Tg in-crease with increasing pumping speed. At the highest pump-ing speed (blue solid line in Fig. 2) pumppump-ing from 1000 hPa was too rapid to reach the steady-state temperature until the pump was turned off at 800 hPa. When pumping is stopped,
Tg starts to increase and approachesTw within about 10 to 15 min.
As mentioned above, vigorous mixing with the ventila-tor ensures that the gas temperature is homogeneous within ±0.3 K throughout the gas volume which is measured by four thermocouples, cf. Fig. 2. Fast temperature fluctua-tions, however, are partially damped out by the finite re-sponse times of the sensors which range between 3 and 10 s, depending on the air pressure. Therefore, larger negative ex-cursions from the mean gas temperature are likely to occur in isolated air parcels (eddies) while they are almost adia-batically cooled. These periods of almost adiabatic cooling must, however, be significantly shorter than the
character-Sulphuric Acid Reservoir
Control Valve
Gas Flow Controller
Synthetic Air Large Droplet Impacter
Conditioner
AIDA
Exhaust SMPS
CNC
Nozzle
Fig. 3.Sulphuric acid aerosol generator.
istic mixing time of the aerosol vessel, which is about one minute. This effect has to be investigated in future expan-sion studies using faster temperature sensors. A horizontal line of five temperature sensors close to the vessel wall mea-sured a thickness of the order of a few cm for the transition layer between the vertical vessel walls and the mixed part of the gas volume. The effect of transport processes across the boundary layer on the concentration and distribution of water vapour will be discussed in Sect. 2.5.
Experimental parameters of all 24 IN experiments con-ducted within this study are listed in Table 1. Three se-ries of experiments were conducted in different experimental campaigns during November 2000 (A), July 2001 (B) and November 2001 (C). Sulphuric acid aerosol was added to the vessel only once before a series of expansions of the same aerosol system. The first expansion in such a series is de-noted with ’ 1’ in the experiment number. Second and third expansions of the same aerosol systems are denoted ’ 2’ and ’ 3’, respectively.
During series A, all expansions were started at an initial pressurep0of about 180 hPa because the aerodynamic lens of the aerosol composition mass spectrometer (ACMS, see Sects. 2.4 and 3.3) could not be operated at higher pressures. The start of pumping is taken as reference timet0for all rel-ative times used in the discussion of expansion experiments. In some experiments of series A, the chamber was refilled with dry synthetic air ensuring complete evaporation of the previously formed ice crystals under ice subsaturated condi-tions. Homogeneous freezing of the residual sulphuric acid aerosol was then investigated in a second expansion.
Table 1.Parameters of individual AIDA ice activation experiments. Initial pressuresp0and temperaturesT0are measured at the reference timet0 defined by start of pumping. Further data were measured at the onset timetnuc of ice formation defined by the increase in the depolarisation signal (pnuc: pressure,Tg,nuc: mean gas temperature,Tf,nuc: frost point temperature,Snuc: ice saturation ratio,(dp/dt)nuc: pressure change,(dT /dt )nuc=γnuc: cooling rate,qg,nuc: volume mixing ratio of water vapour,qae,nuc: equivalent volume mixing ratio of aerosol water content,sae,nuc: equivalent volume mixing ratio of aerosol sulphuric acid content,wSA,nuc: aerosol sulphuric acid weight-%, Cn,nuc: aerosol number concentration,ni: maximum ice number concentration measured with PCS)
Exp.No. p0 T0 tnuc pnuc Tg,nuc Tf,nuc Snuc (dp/dt)nuc γnuc qg,nuc qae,nuc sae,nuc wSA,nuc Cn,nuc ni hPa K s hPa K K hPa min−1 K min−1 ppmv ppmv ppbv wt.% cm−3 cm−3
A1 1 182.3 194.4 270 148.1 189.4 192.6 1.73±0.12 -6.0 0.09 3.5 0.38 19.97 22.2 1511 A1 2 179.0 194.4 198 149.3 189.2 192.6 1.77±0.13 -7.2 -0.50 3.4 0.16 7.69 20.8 592 A2 1 179.4 194.9 332 138.3 189.4 192.7 1.74±0.11 -6.8 -0.39 3.8 0.16 8.26 21.9 1007 A2 2 178.3 195.1 295 142.4 190.0 193.1 1.68±0.11 -6.0 -0.51 3.9 0.05 2.92 23.4 417 A3 1 182.2 202.2 160 158.7 197.6 200.8 1.63±0.10 -6.9 -0.57 11.8 0.20 10.85 22.6 1223 108 A3 2 177.9 202.2 111 157.6 197.7 200.7 1.59±0.10 -8.4 -1.30 11.7 0.08 4.40 23.8 524 130 A4 1 180.6 204.4 211 151.9 199.5 202.8 1.65±0.10 -6.4 -0.39 16.5 0.63 31.42 21.3 2151 A5 1 176.7 212.6 127 157.0 208.2 211.1 1.48±0.09 -7.2 -0.88 52.7 0.18 10.09 23.3 1191 42 A6 1 180.2 222.9 105 163.5 218.6 221.3 1.40±0.11 -8.1 -1.06 194.4 0.32 16.57 21.8 1562 15 A6 2 178.5 222.9 573 140.7 218.4 221.0 1.41±0.11 -5.3 -0.44 217.9 0.17 8.72 21.9 693
B1 1 1001.3 208.9 190 875.2 203.3 206.5 1.61±0.10 -34.3 -1.00 5.0 0.74 35.45 20.8 8015 50 B1 2 817.0 208.6 136 724.5 203.2 206.7 1.65±0.10 -34.7 -1.19 6.2 0.79 34.76 19.4 5668 50 B1 3 178.5 208.3 118 159.1 203.8 207.1 1.61±0.10 -8.2 -1.13 29.7 0.41 19.46 20.6 749 8 B2 1 999.7 208.9 139 902.1 204.2 207.2 1.57±0.12 -35.8 -1.26 5.4 0.14 7.32 22.1 1151 60 B2 2 818.3 208.7 140 734.5 203.8 207.0 1.58±0.12 -31.2 -1.33 6.4 0.14 7.14 21.6 882 50 B2 3 177.2 208.4 163 154.7 203.6 207.0 1.62±0.10 -6.9 -0.67 30.1 0.12 5.54 20.2 84 15 B3 1 991.7 219.9 129 896.9 215.0 218.4 1.56±0.10 -37.8 -1.65 24.4 0.73 26.63 16.5 6768 30 B3 2 813.3 219.7 101 739.4 214.9 218.3 1.56±0.09 -38.7 -2.16 29.4 0.73 25.99 16.3 5134 25 B3 3 178.7 218.8 121 162.2 214.5 217.9 1.55±0.09 -9.5 -1.79 126.3 0.68 26.05 17.2 534 B4 1 1002.8 225.9 261 876.6 220.7 223.9 1.50±0.08 -24.3 -0.43 50.2 1.09 36.09 15.2 6523 8 B4 2 811.8 225.6 96 739.5 220.7 224.0 1.49±0.08 -39.7 -2.17 59.5 1.03 35.67 15.9 4853 30
C1 1 997.1 235.3 72 924.1 231.0 233.7 1.37±0.08 -53.2 -2.75 149.3 0.48 16.95 16.2 1744 40 C1 2 975.7 235.4 83 895.9 230.6 233.3 1.39±0.08 -49.9 -2.55 147.9 0.47 16.11 15.7 1325 35 C1 3 982.7 235.4 79 906.4 230.8 233.7 1.40±0.08 -51.6 -2.53 151.5 0.41 12.10 14.0 990 40
were therefore comparable to series A. All experiments in series C1 1 to C1 3 were carried out with the same sulphuric acid aerosol filling, starting each time at about atmospheric pressure, which required refilling the vessel between subse-quent expansions.
2.4 Aerosol generation and characterisation
Concentrated sulphuric acid aerosol particles are generated with an apparatus schematically shown in Fig. 3 and added to the aerosol chamber through a stainless steel tube. A 20 wt.% sulphuric acid solution is dispersed in a nozzle us-ing a flow of 10 SLM (litres per minute at std. T , p) at a backing pressure of about 2 bar. Droplets larger than about 1µm in diameter are removed by a single orifice plate
100 120 140 160 180 200
p
(h
P
a)
0 500 1 000 1 500 2 000
C
(c
m
)
n
-3
0 10 20 30
C
(
µ
m
/c
m
)
v
3
3
0 100 200 300 400 500
Time (min)
C (CNC3010)n
C (Filter)v
C (DMA)v
196 198 200 202 204 206
T
(K
)
Wall Temperature Gas Temperature
Fig. 4. Pressure, temperatures, aerosol concentrations measured during experiment A3 1. The time axis is set to zero at the end of aerosol addition to the vessel. Pumping started att =223 min, the reference time used in Table 1 and Fig. 6.
Aerosol number concentrations at the beginning of the ex-periments discussed in Sect. 2.3 ranged between about 1000 and 8000 cm−3.
After the highly concentrated sulphuric acid particles are added to the aerosol vessel, they take up water until equi-librium composition with respect to the gas temperature and relative humidity is achieved. Small sample flows of 0.3 l min−1are taken from the aerosol inside the aluminum vessel via stainless steel tubes (4 mm inner diameter) to mea-sure aerosol number concentrations and size distributions with a CNC3010 and a differential mobility analyser (DMA) connected to a second CNC3010 (Fig. 1). The DMA was modified for operation inside the cooled containment at tem-peratures between 183 K and room temtem-peratures and pres-sures between 100 hPa and atmospheric pressure. Operat-ing the DMA at the same temperature as the aerosol ves-sel avoids evaporation of sulphuric acid particles during size classification. The combination of the modified DMA and
the CNC3010 is called low temperature and pressure differ-ential mobility particle sizer (LTP-DMPS). The CNCs are operated at room temperature outside the containment, but had to be modified to sample aerosol at pressures between 100 and 1000 hPa. A short transfer time of less than 1 s into the saturator of the CNC prevents complete evaporation of particles. This was confirmed by heating the sample tube be-tween the cold box and the CNC incrementally by about 20 to 30 K above ambient temperature, which had no effect on the particle count rate. Technical details including pressure de-pendent counting efficiency measurements of the CNC3010 and calibration of the LTP-DMPS will be discussed in a sep-arate paper.
Figure 4 shows pressure, temperature, and aerosol concen-tration profiles measured during experiment A3 1. This ex-periment was selected for a detailed modelling study which is presented in a companion paper (Haag et al., 2003), and will also be discussed in more detail in this paper. Note that the time axis in Fig. 4 is plotted relative to the end of aerosol addition to the aluminium vessel at p = 178 hPa andTg = Tw = 202 K. The pressure underwent only mi-nor changes betweent = 0 and t = 223 min. Then the pressure was sharply reduced by mechanical pumping to in-duce ice nucleation. This time is used as reference timet0in Table 1 and Fig. 6. During the first 223 min of almost con-stant p, Tg, and Tw, the aerosol number concentration Cn (solid black line in the lower panel) decreased slowly from 1850 to 1600 cm−3, mainly due to sedimentational losses of larger particles (coagulation is of minor importance at these low number concentrations). The sharp decrease ofCnafter
t =223 min is almost completely due to particle removal by pumping from 183 to 115 hPa. Furthermore, the pressure de-pendent counting efficiency correction of the CNC3010 data may slightly underestimate the number concentrations at low pressures.
Ion chromatographic analysis of nylon filter samples yields total aerosol sulphuric acid mass concentrations,
Cm,SA. Assuming thermodynamic equilibrium composition of the particles, aerosol mass concentrationsCm,SA can be converted into aerosol volume concentrationsCv, which are also shown in the lower panel of Fig. 4 (solid circles, right axis) together with volume concentrations (squares) derived from size distribution measurements (see below). Clearly, the decrease in aerosol volume parallels the decrease in num-ber concentration within experimental uncertainty. There-fore, the continuousCndata set could be used to interpolate aerosol volume concentrations between the filter samples.
volume-0 500 1 000 1 500 2 000 2 500 3 000 d N /dl nd (c m ) m e -3
100 1 000
d
me(nm)
A3_1, 15 minA3_1, 76 min A3_1, 146 min A3_1, 435 min
Fig. 5. Typical number size distribution of sulphuric acid aerosol added to the AIDA chamber at the beginning of experiment A3 1. The measurements were made with the LTP-DMPS at a pressure of 180 hPa and a temperature of 202 K.
weighted size distributions shown in Fig. 5. The results, filled squares in Fig. 4, agree well with the filter data.
2.5 Water measurements and ice saturation ratio
Figure 6 shows experimental data measured during the ex-pansion cycle of experiment A3 1. Pressure and tempera-ture profiles are the same as in Fig. 4, however, the time is now plotted relative to the starting timet0 of pumping (see Sect. 2.3). The pressure was reduced at three different pump-ing speeds from 183 to 115 hPa within a time period of about 1320 s (panel a). As explained in Sect. 2.3, Tg steeply de-creases aftert0and levels off after about 5 min of pumping, which is somewhat earlier than during the expansions shown in Fig. 2 due to the lower pressure. Thereafter, the tempera-ture stepwise increases with decreasing pumping speed.
Water vapour mixing ratio (panel c in Fig. 6) is mea-sured with the fast in situ Lyman-αhygrometer (FISH) of Forschungszentrum J¨ulich (Z¨oger et al., 1999) which is, how-ever, run as an ex situ instrument during the AIDA experi-ments (Fig. 1). The FISH was calibrated against a high pre-cision frost point hygrometer (MBW DP30). Under constant
p, T-conditions in the aerosol vessel the calibrated FISH agreed well with another commercial chilled mirror hygrom-eter from General Eastern (type 1311 DR-XP) which was used to measure water vapour in the aerosol vessel. This instrument was, however, sensitive to sulphuric acid aerosol deposition on the frost point mirror, which had to be cleaned at regular intervals, and provided only limited information during dynamic expansions because its response time on changing pressure and humidity conditions is too long. The FISH instrument measures with a time resolution of 1 s pro-viding almost immediate response to changing water mixing ratios. The overall accuracy is about 6% with a detection
0·106 1·106 2·106 3·106
C o u n t R at e
0 500 1 000 1 500 2 000 2 500
Time (s) 0.05 0.10 0.15 Rd ep o l 0 2 4 6 8 B S I (a .u .) 0 10 20 V M R (p p m ) 0 1 2 Sic e 196 198 200 202 T (K ) 0 40 80 n (c m ) i -3 120 140 160 180 p (h P a) Tw Tg Sice BSI Rdepol
Ice Particle Concentration VMR H2O
Water Count Rate
Experiment A3_1 (a)
(b)
(c)
(d)
(e)
(f)
Fig. 6.Data plots of experiment A3 1. The panels show pressurep, mean gas and wall temperature, water volume mixing ratio and ice saturation ratio evaluated with total water, depolarisation ratio and back-scatter intensity, number concentration of ice particles, and water count rates of the aerosol mass spectrometer.
in the chamber.
The total water volume mixing ratio measured during ex-periment A3 1 is shown in panel c of Fig. 6. In absence of any sources of water, the mixing ratio should be constant dur-ing pumpdur-ing. However, the mixdur-ing ratio is risdur-ing after some time of pumping. This is due to the fact that the wall temper-ature and therefore the water vapour pressure above the ice coated wall is almost constant during pumping, whereas the water vapour pressure inside the vessel is decreasing with de-creasing total pressure. The resulting concentration gradient drives a water vapour flux through the boundary layer into the well mixed vessel volume. The time scale for this trans-port process is of the same order as for the heat flux described in Sect. 2.3. After the onset of ice nucleation, e.g. detected by the depolarisation increase of back-scattered laser light (panel d, cf. Sect. 3) the interstitial water vapour pressure is further reduced by uptake onto the ice particles formed in a highly supersaturated environment. This causes an increase of the concentration gradient in the wall transition region and therefore an additional increase in the total water mixing ra-tio. The ice particles continue to grow by this source of water vapour as long as the gas temperature is significantly lower than the wall temperature. The decrease of water volume mixing ratio beforeTgapproachesTw(cf. panels b and c of Fig. 6) may be due to undersampling as well as depositional losses of larger ice particles. In previous cloud chamber stud-ies this wall effect was minimised by controlled lowering of the wall temperature during pumping (DeMott et al., 1990). This technique could not be applied in our experiments be-cause the AIDA chamber has a surface area of ca. 100 m2. Controlled and homogeneous cooling of such a large area is not possible at the required rate.
As long as no ice particles are present, the ice saturation ratioSicecan be calculated from the total water mixing ratio
qtmeasured with the FISH instrument, the aerosol water con-tentqaecalculated from the filter sulphuric acid data assum-ing equilibrium composition of the sulphuric acid aerosol, the gas pressurep, and the ice saturation pressurepw,ice
Sice=
pw
pw,ice
=(qt−qae)p pw,ice
(1)
wherepwis the partial pressure of water vapour. The satura-tion vapour pressure over ice is calculated fromTgaccording to Marti and Mauersberger (1993). As discussed in the com-panion paper, the aerosol composition slightly deviates from thermodynamic equilibrium during pumping. However, the assumption of equilibrium had only a minor affect on calcu-latingSicebecause the sulphuric acid aerosol contained only a minor fraction of total water at the nucleation threshold (cf. Table 1). Panel c of Fig. 6 showsSice calculated for experi-ment A3 1. It should be noted that calculatingSicewith the above formula is only valid until ice particles are formed at the onset time for ice nucleation,tnuc. Shortly aftertnuc, the nucleated ice particles start takeing up a significant fraction
of total water in the aerosol vessel. The total water measure-ments cannot directly be corrected for the ice water content
qicebecause no direct measurements ofqice are available. A modelling approach to treat the partitioning of water between the gas and ice phases is discussed in the companion paper (Haag et al., 2003).
3 Ice particle detection
During expansion experiments the formation of ice parti-cles is detected by three independent methods: (1) back-scattered intensity and depolarisation measurements, (2) sin-gle large particle counting, and (3) chemical composition measurements with an aerosol composition mass spectrome-ter (ACMS).
3.1 Depolarisation of back-scattered laser light
To measure intensity and depolarisation of back-scattered laser light with high sensitivity and time resolution, an Argon-Ion laser beam (99% polarised light at 488 nm) is di-rected into the chamber via an optical fibre which preserves the plane of polarization (Fig. 1). The laser beam and the aperture of the detection optics at 176◦scattering angle over-lap in the middle of the chamber at a distance of 2 m from the walls, providing about 2 cm3 of scattering volume. The scattered light is split into the parallel and the perpendicu-lar components by a Glan-Taylor prism and then detected by two independent photomultipliers in the photon counting mode using an integration time of 1 s. A second optical de-tector is mounted in the forward direction at a scattering an-gle of 4◦, measuring total scattering intensity with a single photomultiplier. Panel d of Fig. 6 depicts depolarisation ra-tiosRdepoland back-scattered intensitiesBSI measured dur-ing experiment A3 1. The depolarisation ratio is defined as
Rdepol =BSI⊥/(BSI⊥+BSIk)whereBSI⊥andBSIkare
the backscattered intensities in the planes perpendicular and parallel to the polarisation plane of the incident laser beam. The total BSI is simply the sum of both channels, plotted in arbitrary units in Fig. 6.
decreasing pumping speed and increasing gas temperature bothRdepolandBSIdecrease because particles deposit to the chamber walls. (5) WithTg approachingTw after pumping is stopped, the ice particles completely evaporate atSice≤1 andRdepoldrops back to the background level.
An interesting feature of theRdepolprofile is the very sharp increase of the signal attnuc = 160s, followed by a tran-sient levelling off before the depolarisation signal starts to rise again sharply about 50 s aftertnuc. We speculate that the first sharp increase is due to spontaneous freezing of a small fraction of the supercooled liquid aerosol particles when the nucleation threshold is reached. This idea is supported by the evolution of the modelled ice particle number distributions, as discussed in Sect. 4.4 of the companion paper (Haag et al., 2003, see Fig. 8). The second rise in the depolarisation signal is due to the subsequent ice crystal growth as water vapour is replenished by evaporation from the ice-coated chamber walls.
3.2 Optical particle counter
Number concentrations and optical sizes of growing ice par-ticles are measured with an optical particle spectrometer (PCS2000, Palas) mounted below the aerosol vessel (Fig. 1). The major part of the sampling tube has the same temperature as the aerosol vessel wall to avoid ice particle evaporation during sampling. The spectrometer measures particles with diameters between about 0.5 and 20µm in 128 size bins. Be-foretnucno particles are detected in the size bins larger than about 1.5µm optical diameter, and all pulses detected above this threshold during an expansion experiment can clearly be attributed to ice particles that were grown to optical diame-ters larger than 1.5µm. However, smaller ice particles can-not be distinguished from liquid sulphuric acid droplets. The time resolution of PCS2000 measurements was 30 s during experiment series A and B and 1 s during experiment series C. These measurements are also quite sensitive for detecting the onset of ice nucleation.
The overall count rate above 1.5µm can be converted into a number concentration of ice particles,ni, larger than this size (Fig. 6, panel e). Maximumni measured during each experiment are listed in Table 1. Comparison of the last two columns reveals that the fraction of frozen aerosol particles detected with the optical particle spectrometer was extremely variable, between 0.1 (B4 1) and 25% (A3 2). The increase of the ice particle number count may be delayed due to partial evaporation of ice crystals in the slightly warmer sampling tube. Furthermore, the sampling efficiency is less than 100% for particles with mean diameters larger than about 10µm (Davies, 1968). Because the ice crystal size and habit was not measured in the present experiments the sampling effi-ciency could not be determined. Therefore the ice crystal number concentrationsnimust be considered as lower limits, in particular for experiments at higher temperatures where ice crystal growth is very rapid.
3.3 Aerosol composition mass spectrometer
The aerosol composition mass spectrometer (ACMS) of Max-Planck-Institut f¨ur Kernphysik, Heidelberg (Schreiner et al., 2002; Zink et al., 2002), was used to quantitatively measure the water and sulphuric acid contents in aerosol particles. Aerosol is sampled directly from the AIDA ves-sel through an aerodynamic lens system forming a narrow particle beam. The particle beam is directed through a cap-illary separating two cryogenically pumped vacuum cham-bers. The gas molecules, however, expand behind the lens and are efficiently pumped off in the first chamber. This re-sults in a gas phase suppression factor of about 105. In the second chamber, the aerosol beam impinges on a gold tar-get in the middle of a gold-plated sphere heated to about 370 K. The impinging particles evaporate and the volatile constituents are detected by a quadrupole mass spectrome-ter with an electron impact ionisation source. The instru-ment was calibrated for aerosol sulphuric acid and water con-tent using aerosols from a well defined laboratory calibration source (Knopf et al., 2001).
A continuous flow of a large number of small sulphuric acid solution droplets establishes steady state count rates of water and sulphuric acid mass peaks that can be converted into an aerosol molar ratio of water to sulphuric acid using the calibration results. In a previous study of supercooled liquid sulphuric acid aerosol particles in the AIDA chamber (Zink et al., 2002), the ACMS results were shown to agree with the expected thermodynamic equilibrium composition over a wide range of temperatures and total water vapour mixing ratios, which were measured with the FISH instru-ment as desribed in Sect. 2.5 above. Those measureinstru-ments were made over time periods of up to two days with only slight changes of the aerosol mass concentration. During the pumping periods of the present experiments, the aerosol mass concentration decreased by about 20% within a few minutes. Therefore, the sulphuric acid aerosol content mea-sured with the ACMS during expansion experiments is over-estimated due to memory effects of sulphuric acid inside the evaporation sphere of the ACMS.
Table 2.Comparison of ice particle detection times measured with different ice detectors (depol: depolarisation of back-scattered laser light; PCS: optical particle counter; ACMS: Aerosol composition mass spectrometer)
Exp.No. T0[K] tice[s]
Depol PCS ACMS
A1 1 194.4 270±80 306±30 A1 2 194.4 198±24 103±30 A2 1 194.9 332±2 282±30 A2 2 195.1 295±10 390±30 A3 1 202.2 160±2 167±30 206±30 A3 2 202.2 111±5 140±15 125±30 A4 1 204.4 211±10 224±30 A5 1 212.6 127±2 139±15 103±30 A6 1 222.9 105±2 98±15 116±30 A6 2 222.9 573±5 599±30
B1 1 208.9 190±10 212±30 B1 2 208.6 136±5 139±15 B1 3 208.3 118±5 157±15 B2 1 208.9 139±15 170±15 B2 2 208.7 140±15 153±15 B2 3 208.4 163±15 154±15 B3 1 219.9 129±10 136±15 B3 2 219.7 101±3 108±15 B3 3 218.8 121±3
B4 1 225.9 261±10 244±30 B4 2 225.6 96±2 105±15
C1 1 235.3 72±5 75±5 C1 2 235.4 83±3 83±3 C1 3 235.4 79±3 77±3
of frozen particles, which was discussed in the last paragraph of Sect. 3.1. For these reasons, a rough estimate of the un-certainty in measuringtnuc with the ACMS, last column in Table 2, is 30 s.
4 Ice nucleation results
4.1 Evaluation ofSnuc
The ice particle detection times obtained by depolarisation measurements (depol), optical particle counting (PCS), and fast water detection (ACMS) as described in Sect. 3 are sum-marized in Table 2. For the ACMS,ticeis defined as the time where the first water spike was detected. The depolarisation measurement turned out to be most sensitive to the formation of ice particles. Therefore, this time is taken as the freezing
onset timetnuc. Hereafter, the index ‘nuc’ refers to measure-ments attnuc. The freezing onset timetnuc is defined as the intersection between a horizontal line fitting the background signal and a tangent to the steeply rising depolaristion sig-nal (Fig. 6, panel d). The uncertainty fortnuctypically varies between±2 and±15 s. The time resolution of PCS mea-surements is limited by the integration time of 30 s during experiment series A and B. As mentioned above, PCS data were recorded at a rate of 1 Hz during series C. ACMS mea-surements are only available for experiment series A. There is good agreement between PCS, ACMS, and depolarisation measurements oftice.
Table 1 gives besides other parameters the pressurespnuc, gas temperaturesTg,nuc, and ice saturation ratiosSnuc. Un-til tnuc, the decrease in gas temperatureTnuc −T0 is about −4 to−5 K. Because the decrease in water vapour pressure during pumping fromp0 topnuc is only partially compen-sated by ice evaporating from the chamber walls, the frost point temperatureTf,nuc calculated from the measured wa-ter vapour concentration also decreases by about 1.5 to 2.0 K compared tot0. Therefore, supercooling with respect to ice saturation attnuc is only about 2 to 3 K. The corresponding ice saturation ratioSnucis plotted in Fig. 7 vs.Tg,nuc. As dis-cussed in Sect. 2.5,Snucwas calculated using the total water concentration qt,nuc corrected for the aerosol water content
qae,nuc. Equilibrium conditions where assumed to calculate
qae,nuc with the AIM thermodynamic model (Carslaw et al., 1995; Clegg et al., 1998) which is available via the world wide web (http://mae.ucdavis.edu/wexler/aim). The model input parameterspnuc, Tg,nuc, qt,nuc, and aerosol sulphuric acid concentrationsae,nucare also listed in Table 1. In all ex-periments, the aerosol water content was only a minor frac-tion ofqt,nuc. Therefore, the correction had only a small ef-fect onSnuc.
Circles in Fig. 7 show the first and second activations of series A, both started at about 180 hPa. Filled up-triangles, open up-triangles, and open down-triangles mark subsequent activations of the same aerosol in series B which were started at 1000 hPa, 800 hPa, and 180 hPa, respectively. That is, only the latter ones are started at the same pressure as experi-ments A. In experiexperi-ments A and B, freezing occurred at cool-ing rates between almost 0 and−2.2 K min−1 with aerosol number concentrations in the range of 84 to 8000 cm−3. Three subsequent activations of series C (filled diamonds) were made at almost the same thermodynamic conditions (e.g. p0, T0, γnuc) but with the aerosol concentration de-creasing from experiment to experiment due to dilution (see Sect. 2.4). In these experiments, the highest cooling rates of about−2.6 K min−1were applied.
1.0 1.2 1.4 1.6 1.8 2.0 2.2
Ice
S
at
u
rat
io
n
R
at
io
Sic
e
190 200 210 220 230 240
Temperature (K)
Exp A (180 hPa) Exp B (1000 hPa) Exp B (800 hPa) Exp B (180 hPa) Exp C (1000 hPa) J=5x10 cm s8 -3 -1
J=1x1013cm s-3 -1
Water Saturation
Fig. 7. Ice saturation ratio Snuc measured at onset of ice forma-tion, tnuc, as function of temperature Tg,nuc. The data points are grouped according to the different experiment series and to subsequent activations of experiments B (cf. Table 1). The data points are compared to the activity parameterisation by Koop et al. (2000) calculated for nucleation rates of 5·108cm−3s−1(solid line) and 1013cm−3s−1(dashed line). The liquid water saturation line (dash-dotted) was calculated using the parameterisation given by Tabazadeh et al. (1997b).
contribution is due to the uncertainty in Tnuc because (∂lnS/∂T )p =1H /(RT2)shows a square dependence on temperature (1H =enthalpy of sublimation of ice, taken from Marti and Mauersberger (1993)). For experiments A6 1 and A6 2, a somewhat larger statistical error of±10% was estimated forqnuc because the FISH had been calibrated in the range 5 to 100 ppm, and this calibration curve had to be extrapolated to determine exceptionally large mixing ra-tios of about 200 ppm in these experiments. When the air is cooled at the lowest temperatures an additional systematic in-crease is introduced due to a non-equilibrium effect which is modelled in the companion paper (Haag et al., 2003). Large supercooled liquid particles do not reach their equilibrium water activity due to the small absolute amount of water vapour available in the gas phase, and thus do not freeze at the thermodynamic threshold temperatureTg. Furthermore, as was outlined in Sect. 2.3, there may be a systematic bias in
tnucbecause of temperature fluctuations aroundTg, i.e. early freezing in air parcels (eddies) in which the local cooling rate may approach the true adiabatic cooling rate (= slopes of the dashed lines in Fig. 2) for short periods of time.
The data points of series A follow a steeper slope com-pared to series B. At least part of the steeper slope is due to the size and temperature dependent non-equilibrium effects discussed above and in the companion paper. At the high-est temperature in series A (experiments A6 1 and A6 2) the freezing onset occurred at a lower saturation ratio compared to the later experiment series B. Because the background aerosol concentration was unusually high during these
exper-iments (about 10 cm−3even after pumping off to 10 hPa and refilling with synthetic air), it cannot be totally ruled out that freezing was affected by heterogeneous nucleation. In sub-sequent experiments, particularly in series B and C, care was taken to keep the particle number density below 5 cm−3. The effect of this background aerosol was tested in several refer-ence experiments which were carried out with typical cooling rates and ice supersaturations, but without adding sulphuric acid aerosol to the vessel. It was found that the changes in depolarisation signal and ice particle number count due to the background aerosol were always too low to interfere with the detection oftnucin the presence of sulphuric acid aerosol. 4.2 Critical nucleation rates
The estimate of critical nucleation rates is based on the anal-ysis of the initial increase of the depolarisation signal during the nucleation peak. About 100 particles per cm3freeze in experiment A3 1. As proposed in Sect. 3.1, we surmise that the first short plateau in the depolarisation trace, panel d in Fig. 6, marks the time when this number of particles have frozen, while the second steep increase of the signal trace is due to changing shape of the growing particles. We can esti-mate from the depolarisation trace that the detection thresh-old corresponds to about 30 out of 100 particles being frozen, i.e. to a freezing probabilityPcrit∼0.3.
To deduce the critical nucleation rateJcritwe use the fol-lowing formula with Vp =volume of the particles which freeze
Pcrit=1−exp(−JcritVp1t ) (2)
or, in terms of the critical nucleation rate:
Jcrit= −
ln(1−Pcrit)
Vp1t
(3) Note that, strictly speaking,Jcritis only defined for particles with similarVp. An estimate ofVpis given in the compan-ion paper where it is shown that most of the particles which freeze in experiment A3 1 are approximately 1µm in diame-ter (cf. Haag et al., 2003, Fig. 8, top panel), i.e. have a volume of∼5·10−13cm3. This yieldsJcrit∼3·1011cm−3s−1.
range from about 0.02 to 0.5. The time delay1tfor the de-tection of the nucleation peak was in the range between 1 and 10 s. The upper and lower estimates of the nucleation param-eters given above yieldJcritbetween about 5·108cm−3s−1 and 1013cm−3s−1. According to the activity-based parame-terisation ofJby Koop et al. (2000), this corresponds to1aw of 0.30 and 0.32, respectively, where1awdenotes the differ-ence between the water activities of the ice nucleating par-ticles and parpar-ticles in equilibrium with ice. Assuming equi-librium conditions, the corresponding temperature dependent ice saturation ratioSice(T )is given by
Sice(T )=1+1aw
pw,0(T )
pw,ice(T )
(4) wherepw,0andpw,iceare the liquid water and ice saturation pressures. Figure 7 shows that most of the experimental data are consistent with this parameterisation, except for a few outliers above 218 K which have been discussed above, and a systematic tendency to higherSnuc at the lowest tempera-ture where diffusion limitation to large particles becomes im-portant, as discussed in more detail in the companion paper (Haag et al., 2003).
5 Conclusions
It has been shown that well-defined supersaturations with re-spect to the ice phase, characteristic of orographic waves in the upper troposphere and lower stratosphere, can be estab-lished in sulphuric acid aerosols using the method of expan-sion cooling in a large cryogenic aerosol chamber with ice-coated walls. Saturation ratios were derived from gas tem-peratures and total water concentration measured with a fast Lyman-αhygrometer (FISH) and corrected for the amount of water taken up by the sulphuric acid aerosols. The method-ology was used to determine critical supersaturations Snuc between 231 and 189 K for homogeneous ice nucleation in supercooled sulphuric acid aerosols with particles in the size range between about 0.05 and 1µm. This range is character-istic of the Junge aerosol in the lower stratosphere. Cooling rates at the time of ice nucleation varied between approxi-mately zero and−2.8 K min−1.
A recent parameterisation of the ice nucleation rateJ in solution droplets, based on experiments under different lab-oratory conditions, yieldsSnuc as function of the difference between the activity of water in the supercooled droplets and in a solution in equilibrium with ice at the same tempera-ture (Koop et al., 2000). The results of 24 measurements in the large aerosol chamber were used to test the validity of this parameterisation under close-to-atmospheric condi-tions. Most of the results agree with the parameterisation within their error limits. A tendency of the experimental re-sults to exceed the predictedSnucat lower temperatures is at-tributed to non-equilibrium effects, i.e. diffusion-limited up-take of water vapour by the larger particles during the cooling
process. This and other dynamic effects are studied quanti-tatively with a microphysical model in a companion paper (Haag et al., 2003).
Acknowledgements. Running the AIDA facility for freezing exper-iments was only possible with continuous support by all staff mem-bers, especially R. Buschbacher, E. Kranz, and G. Scheurig. We would also like to thank S. L. Clegg for giving access to the AIM model. Helpful discussions with B. P. Luo, T. Koop, P. J. DeMott, and D. C. Rogers are also acknowledged. This work contributes to the HGF (Hermann-von-Helmholtz-Gemeinschaft Deutscher Forschungszentren) project “Particles and Cirrus Clouds” (PAZI) and has been funded by BMBF (AFO2000 project POSTA, 07ATF04) and by the European Commission (FP5 project CIPA, EVK2-CT2000-00095). We also thank two anonymous reviewers for constructive interactive discussion of this work.
References
Bertram, A. K., Patterson, D. D., and Sloan, J. J.: Mechanisms and Temperatures for the freezing of sulfuric acid aerosols measured by FTIR extinction spectroscopy, J. Phys. Chem., 100, 2376– 2383, 1996.
Bunz, H., Koyro, M., and Scheurig, G.: Numerical simulation of the conditioning of volatile particles in laminar flow tube reactors, Aerosol Sci. Technol., 36, 934–940, 2002.
Carslaw, K. S., Clegg, S. L., and Brimblecombe, P.: A thermody-namic model of the system HCl−HNO3−H2SO4−H2O, in-cluding solubilities of HBr, from< 200 K to 328 K, J. Phys. Chem., 99, 11 557–11 574, 1995.
Carslaw, K. S., Peter, T., and Clegg, S. L.: Modeling the composi-tion of liquid stratospheric aerosols, Rev. Geophys., 35, 125–154, 1997.
Carslaw, K. S., Wirth, M., Tsias, A., Luo, B. P., D¨ornbrack, A., Leutbecher, M., Volkert, H., Renger, W., Bacmeister, J. T., and Peter, T.: Particle microphysics and chemistry in remotely ob-served mountain polar stratospheric clouds, J. Geophys. Res.-Atmos., 103 (D5), 5785–5796, 1998a.
Carslaw, K. S., Wirth, M., Tsias, A., Luo, B. P., D¨ornbrack, A., Leutbecher, M., Volkert, H., Renger, W., Bacmeister, J. T., Reimer, E., and Peter, T.: Increased stratospheric ozone deple-tion due to mountain-induced atmospheric waves, Nature, 391, 675–678, 1998b.
Chen, Y. L., DeMott, P. J., Kreidenweis, S. M., Rogers, D. C., and Sherman, D. E.: Ice formation by sulfate and sulfuric acid aerosol particles under upper-tropospheric conditions, J. Atmos. Sci., 57, 3752–3766, 2000.
Clegg, S. L., Brimbleconbe, P., and Wexler, A. S.: Thermodynamic model of the system H+−NH+4 −SO42−−NO−3 −H2O at tro-pospheric temperatures, J. Phys. Chem., 102, 2137–2154, 1998. Davies, C. N.: The entry of aerosols into sampling tubes and heads,
Brit. J. Appl. Phys. (J. Phys. D), 1, 921–932, 1968.
Demott, P. J. and Rogers, D. C.: Freezing nucleation rates of dilute solution droplets measured between−30◦and−40◦C in labo-ratory simulations of natural clouds, J. Atmos. Sci., 47, 1056– 1064, 1990.
Brooks, B., Hoell, C., Bandy, B., Johnson, D., and Heymsfield, A.: Ice nucleation in orographic wave clouds: Measurements made during INTACC, Q. J. Roy. Meteor. Soc., 127, 1493–1512, 2001.
Gierens, K., Schumann, U., Helten, M., Smit, H., and Wang, P. H.: Ice-supersaturated regions and subvisible cirrus in the northern midlatitude upper troposphere, J. Geophys. Res.-Atmos., 105 (D18), 22 743–22 753, 2000.
Haag, W., K¨archer, B., Schaefers, S., Stetzer, O., M¨ohler, O., Schu-rath, U., Kr¨amer, M., and Schiller, C.: Numerical simulations of homogeneous freezing processes in the aerosol chamber AIDA, Atmos. Chem. Phys., 3, 195–210, 2003.
Heymsfield, A. J. and Miloshevich, L. M.: Homogeneous Ice Nu-cleation and Supercooled Liquid Water in Orographic Wave Clouds, J. Atmos. Sci., 50, 2335–2353, 1993.
Jensen, E. J. and Toon, O. B.: Ice Nucleation in the Upper Tropo-sphere - Sensitivity to Aerosol Number Density, Temperature, and Cooling Rate, Geophys. Res. Lett., 21, 2019–2022, 1994. Jensen, E. J., Toon, O. B., and Hamill, P.: Homogeneous
Freez-ing Nucleation of Stratospheric Solution Droplets, Geophys. Res. Lett., 18, 1857–1860, 1991.
Jensen, E. J., Kinne, S., and Toon, O. B.: Tropical Cirrus Cloud Radiative Forcing – Sensitivity Studies, Geophys. Res. Lett., 21, 2023–2026, 1994.
Jensen, E. J., Toon, O. B., Tabazadeh, A., Sachse, G. W., Anderson, B. E., Chan, K. R., Twohy, C. W., Gandrud, B., Aulenbach, S. M., Heymsfield, A., Hallett, J., and Gary, B.: Ice nucleation pro-cesses in upper tropospheric wave-clouds observed during SUC-CESS, Geophys. Res. Lett., 25, 1363–1366, 1998.
Jensen, E. J., Read, W. G., Mergenthaler, J., Sandor, B. J., Pfister, L., and Tabazadeh, A.: High humidities and subvisible cirrus near the tropical tropopause, Geophys. Res. Lett., 26, 2347–2350, 1999.
Jensen, E. J., Toon, O. B., Vay, S. A., Ovarlez, J., May, R., Bui, T. P., Twohy, C. H., Gandrud, B. W., Pueschel, R. F., and Schu-mann, U.: Prevalence of ice-supersaturated regions in the upper troposphere: Implications for optically thin ice cloud formation, J. Geophys. Res.-Atmos., 106 (D15), 17 253–17 266, 2001. K¨archer, B.: Properties of subvisible cirrus clouds formed by
ho-mogeneous freezing, Atmos. Chem. Phys., 2, 161–170, 2002. K¨archer, B. and Lohmann, U.: A parameterization of cirrus cloud
formation: Homogeneous freezing of supercooled aerosols, J. Geophys. Res., 107 (D2), 101029/2001JD000470, 2002. Knopf, D., Zink, P., Schreiner, J., and Mauersberger, K.: Calibration
of an aerosol composition mass spectrometer with sulfuric acid water aerosol, Aerosol Sci. Technol., 35, 924–928, 2001. Koop, T., Ng, H. P., Molina, L. T., and Molina, M. J.: A new optical
technique to study aerosol phase transitions: The nucleation of ice from H2SO4aerosols, J. Phys. Chem. A, 102, 8924–8931, 1998.
Koop, T., Luo, B. P., Tsias, A., and Peter, T.: Water activity as the determinant for homogeneous ice nucleation in aqueous so-lutions, Nature, 406, 611–614, 2000.
Lawson, R. P., Heymsfield, A. J., Aulenbach, S. M., and Jensen, T. L.: Shapes, sizes and light scattering properties of ice crystals in cirrus and a persistent contrail during SUCCESS, Geophys. Res. Lett., 25, 1331–1334, 1998.
Lohmann, U. and K¨archer, B.: First interactive simulations
of cirrus clouds formed by homogeneous freezing in the ECHAM general circulation model, J. Geophys. Res., 107 (D10), 10.1029/2001JD000767, 2002.
Marti, J. and Mauersberger, K.: A survey and new measurements of ice vapor pressure at temperatures between 170 and 250 K, Geophys. Res. Lett., 20, 363–366, 1993.
Martin, S. T.: Phase transitions of aqueous atmospheric particles, Chem. Rev., 100, 3403–3453, 2000.
M¨ohler, O., Nink, A., Saathoff, H., Schaefers, S., Schnaiter, M., Sch¨ock, W., and Schurath, U.: The Karlsruhe aerosol cham-ber facility AIDA: technical discription and first results of ho-mogeneous and heterogeneous ice nucleation experiments, Proc. of Workshop on Ion-Aerosol-Cloud-Interactions (IACI), (Ed) Kirkby, J., CERN 2001-007, Geneva, 2001.
Nink, A., Saathoff, H., Schnaiter, M., and M¨ohler, O.: Laboratory investigation of the impact of aircraft particulate emissions on cirrus cloud formation, Proc. of European workshop on aviation, aerosols, contrails, and cirrus clouds (A2C3), (Eds) Schumann, U. and Amanatidis, G. T., EUR19428, 149–153, Seeheim, 2000. Peter, T.: Microphysics and heterogeneous chemistry of polar stratospheric clouds, Annu. Rev. Phys. Chem., 48, 785–822, 1997.
Prenni, A. J., Wise, M. E., Brooks, S. D., and Tolbert, M. A.: Ice nucleation in sulfuric acid and ammonium sulfate particles, J. Geophys. Res., 106 (D3), 3037–3044, 2001.
Solomon, S.: Stratospheric ozone depletion: A review of concepts and history, Rev. Geophys., 37, 275–316, 1999.
Tabazadeh, A., Jensen, E. J., and Toon, O. B.: A model description for cirrus cloud nucleation from homogeneous freezing of sulfate aerosols, J. Geophys. Res.-Atmos., 102 (D20), 23 845–23 850, 1997a.
Tabazadeh, A., Jensen, E. J., and Toon, O. B.: Formation and im-plications of ice particle nucleation in the stratosphere, Geophys. Res. Lett., 24, 2007–2010, 1997.
Schreiner, J., Voigt, C., Kohlmann, A., Amold, F., Mauersberger, K., and Larsen, N.: Chemical analysis of polar stratospheric cloud particles, Science, 283, 968–970, 1999.
Schreiner, J., Voigt, C., Zink, P., Kohlmann, A., Knopf, D., Weisser, C., Budz, P., and Mauersberger, K.: A mass spectrometer system for analysis of polar stratospheric aerosols, Rev. Sci. Instr., 73, 446–452, 2002.
Voigt, C., Schreiner, J., Kohlmann, A., Zink, P., Mauersberger, K., Larsen, N., Deshler, T., Kroger, C., Rosen, J., Adriani, A., Cairo, F., Di Donfrancesco, G., Viterbini, M., Ovarlez, J., Ovarlez, H., David, C., and D¨ornbrack, A.: Nitric acid trihydrate (NAT) in polar stratospheric clouds, Science, 290, 1756–1758, 2000. Zink, P., Knopf, D. A., Schreiner, J., Mauersberger, K., M¨ohler,
O., Saathoff, H., Seifert, M., Tiede, R., and Schurath, U.: Cryo-chamber simulation of stratospheric H2SO4/H2O parti-cles: composition analysis and model comparison, Geophys. Res. Lett., 29, 10.1029/2001GL013296, 2002.