HOLOS, Year 34, Vol. 03 2
THE FORMATION OF BRAZILIAN MINERALS DATABASE FOR INTEGRATED SEM-EDS
SYSTEM APPLIED TO THE GOLD ORE CHARACTERIZATION
N. P. SAMPAIO1,3, G. G. CASTRO2, G. F.MOREIRA1, F. L. SILVA1, J. J. MENDES1, A. A. CUNHA1, F. L. KRUGER4, F. G. ARAÚJO 1
1Rede Temática em Engenharia de Materiais - REDEMAT - Universidade Federal de Ouro Preto, 2Universidade Federal de Ouro Preto, 3Centro de Microscopia da Universidade Federal de Minas Gerais, 4Fundação Gorceix
neypsampaio@gmail.com 1
Received 15/02/2018 – Accepted 10/07/2018 DOI: 10.15628/holos.2018.6938
Abstract
The mineralogical characterization of the Brazilian minerals variety occurrence is one of the key steps in the design of the mineral processing route and improving the overall process efficiency. This set of information is essential in assessing the technical and economic viability of a mineral Project. Among the variety mineralogical characterization techniques, automated analyzers are gaining great prominence because they provide qualitative and quantitative data in an automated manner, with great speed and accuracy. The system, available in the NanoLab at the Laboratory of the Mining-Metallurgic Centre/REDEMAT and specifically called TIMA-MIRA, is composed of a scan control program and analysis of mineral data (TIMA - Tescan Integrated Mineral Analyzer) and a scanning electron microscope with cannon field emission of electrons associated with two energy dispersive detector characteristic X-rays (MIRA - trade name). The system uses a mineral database consisting of association images by back scattered electrons of the mineral grains, with their characteristic X-ray spectra and their
comparison with the characteristic spectra of a database. The equipment has an interface that allows you to add minerals and other materials to their underlying database, which is critical to the result accuracy because the original equipment database that is created only with data of mineral samples from other countries would not identify minerals of national origin with its characteristic major and minor elements. These limitations of the database integrated mineral analyzer TIMA-MIRA motivated the construction of a new database through a selection methodology, preparation and analysis by diffraction rays and the TIMA-MIRA system, different context samples Brazilian geological. Each mineral was determined to be analyzed in the integrated mineral analysis system by the XR diffraction analysis. Thereby, we obtained the maximum and minimum intensities values of chemical elements peaks that make up the analyzed mineral obtaining thus new identification rules for each selected species and adapted some existing rules to meet the needs presente.
HOLOS, Year 34, Vol. 03 3
1. INTRODUCTION
The techniques of mineral characterization are an important tool to improve ore processing routes. A more complete mineral explotation resources is based on a better identification of mineral phases and its distribution in an ore body.
Technique of characterization is supposed to be selected as an ore function mineralogy and physico-chemical properties of interest, as well as the scope, objectives, the availability of time and financial resources; the characteristics of the processing route also play an importaint role (Neumann et al. 2004). The mineralogical characterization encompasses the identification and quantification of minerals and gangue as well as the distribution of elements among the several phases; some chemical and physical properties can be also measured in this process (Neumann et al. 2004). Common techniques are XR difractometry, optical microscopy, scanning electron microscopy and microscaning techniques.
In addition to traditional techniques, a new array of characterization tools has currently been made available. Integrated mineral analyzers usually called automatized mineral analyzers are the last generation of them. They can provide quick, comprehensive and automatic analyses. Such systems apply techniques of electronic scanning microscopy and XR dispersive energy spectrometry and are able to gather a huge amount of information regarding mineralogical and chemical compositions, elements and particle distribution as well as the spectrum of mineral liberation (Petruk 1989, Sutherland & Gottlieb, 1991). Such systems initially were developed for the mining industry evolved to include application in geosciences, petroleum and gas industries (FEI, 2015).
Knowledge of the matter essence and microstructural distribution features of ores is essential as far as evaluating the performance of a processing route is concerned. Quantitative mineralogy usually makes use of considerably large amounts of measurements and statistical tools in order to achieve a reliable result. Important parameters in the studies are features such as pore and size particle distributions. The planar distributions of these features are translated to volumetric distributions using stereographic arguments. Polycrystalline materials can be characterized by differential and / or integral methods. Integral techniques such as the average linear intercept are faster but provide less information. Differential techniques are time consuming but this difficulty can be overcomed by automatization and using modern digital computing. Analysis of mineral liberation requires identifying and quantifying the several phases, their degree of association and size distribution. Complementary labeling techniques such as coloring of specific phase are helpful auxiliary tools in modern automatized mineralogical systems.
Thus, actual work in this field is time consuming, highly specialized and requires automatized systems. This work reports the development of a methodology applied to forming a mineral data base of Brazilian non-ferrous and ferrous minerals; this database is supposed to be integrated to a TIMA-MIRA (Tescan Integrated Mineral Analyzer) by TESCAN™.
2. MATERIALS AND METHODOLOGY
In order to accomplish the objectives of this work several samples of Brazilian minerals have been collected. They have gone through physical beneficiation – to achieve the required size distribution – and mounted in resin imbedded specimens for polished sections observation. This sort of preparation follows the requirements of the TIMA-MIRA (Tescan Integrated Mineral Analyzer) system. TIMA-MIRA employs a system for controlling the scanning process and for
HOLOS, Year 34, Vol. 03 4 analyzing the raw data (TIMA – Tescan Integrated Mineral Analyzer); the data is gathered by a FEG (Field Emission Gun) associated with two XR dispersive energy detectors (MIRA – trade name).
Selected data from TIMA have been compared to data provided by other techniques such as XR difractometry. As a result, the mineralogical database of Brazilian minerals so-called Nanolab-all has been generated with the proper protocols Nanolab-allowing its use in an automatized TIMA-MIRA system.
2.1. Features of TIMA – MIRA system
The TIMA-MIRA system has been specifically developed for the mining industry allowing faster quantitative mineralogical analysis of rocks, ores, ore concentrates, leaching residues and foundry specimens. This system includes a scanning control software and a proprietary software for analyzing the data; the hardware is an integrated SEM/FEG-EDX system marketed under the denomination MIRA, which is a scanning electron microscope with a FEG (Field Emission Gun) associated with two XR dispersive energy detectors (TESCAN 2015).
TIMA is a software based on the SEM-EDS system; here the dispersive energy spectrometers map the element characteristic XR spectrum and the scanning microscope simultaneously acquires the images from the back scattered electrons; all this under considerably high digitalization velocities. The stable signals from the back scattered electrons can be used for generating an image of each mineral particle; its identification can be performed through a BSE brightness parameter ranging from 0 (0 % BSE) to 256 (100 % BSE); calibration is made by a proper standard. Variations detected inside this gray scale allow a quick definition of borders between mineral grains to be performed. During a XR mapping the identification of a mineral grain can be promptly certified through a sole XR analysis or scanning the grain geometric center or a grain given area; even if the minerals show a close classification in this BSE gray scale.
For each mineral particle the image analysis and mineral identification start with defining the position between different mineral grains; this can be made on the basis of BSE gray scale. According to Sylvester (2012), the retroscattering coefficient (η) can be defined as the ratio between the number of electrons emitted by a given mineral (NBSE) and the total of electrons hitting the area of analysis (NIE) (and coming from the SEM), equation (1):
𝛈 = 𝐍𝐁𝐒𝐄 . 𝐍𝐈𝐄-1 (1) This is also a function of the average atomic number (Z) of the mineral (Heinrich, 1966), according to equation (2):
𝛈 = −𝟎,𝟎𝟐𝟓𝟒 + 𝟎, 𝟎𝟏𝟔 . 𝐙 (− 𝟎,𝟎𝟎𝟎𝟏𝟖𝟔 𝐙𝟐 + 𝟖, 𝟑 × 𝟏𝟎−𝟕. 𝐙𝟑) (2) Minerals containing heavier elements (e.g. zirconia) show a higher degree of electrons backscattering (higher values of η) and appear brighter on BSE images; on the other side minerals of lighter elements accordingly show themselves darker (Fandrich et al., 2007).
The device installed at CMM–REDEMAT is a SEM/FEG- EDS; its FEG (Field Emission Gun) is responsible for a coherent electron beam, smaller as far as diameter is concerned, resulting in images thousand of times brighter than tungsten probes. All these results lead to higher spatial
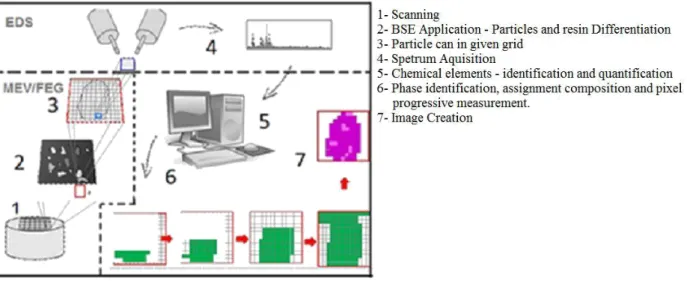
HOLOS, Year 34, Vol. 03 5 resolution and smaller noise to signal ratio (Tescan Company, 2013). After acquiring data is received from the site the procedure can then be repeated in a next field (Sylvester 2012). Figure 1 summarizes the TIMA-MIRA system sequence of operations as described before. Images from SEM BSE and EDS XR spectra can be acquired in the same time or following a sequence; this option can be made by choosing between Analysis type and Acquisition mode. The parameter Analysis type depicts the options Modal analysis, Liberation analysis and Bright Phase Search allowing the determination of qualitative features of the acquired data; the Acquisition mode parameter depicts the options High resolution mapping, point spectrometry and Line mapping; they are responsible for quantitative aspects. (TIMA 2015).
Figure 1 Sequence of steps performed in an analysis in TIMA-MIRA system. (Modified from Jaime et al2009).
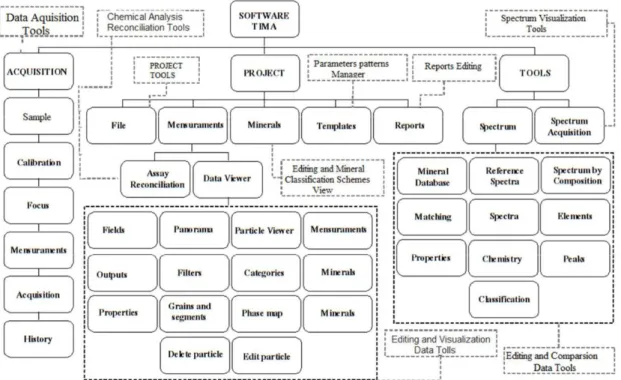
TIMA has been designed for collection, managing, processing and visual data presentation; this is accomplished through an integration with MIRA. The more complete version of MIRA is structured according to Data acquisition and Data management sections and a feature called Spectrum Tools. Figure 2 shows a simplified description of this software. Data acquisition is accomplished through Data Aquisition and follows a sequence as determined by the software: sample identification, calibration, beam adjustment, definition of measurement parameters, data acquisition. Managing, processing and presentation of data are made by Data management module. An array of data can be stored in a Project, manipulated through proper selection and edition of particles, or through alterations on mineral classification scheme.
HOLOS, Year 34, Vol. 03 6 Figure 2. Simplified structure of TIMA software represented by the main program navigation tabs.
Table 1. Available reports and their descriptions
Reports Description
Mineral Mass Mineral weight fraction
Element Mass Chemical Elements Mass Fraction
Element Deportment Distribution of chemical elements of the selected phase Elements Maps Distribution of all chemical elements
Mineral Associations Spatial relationship between mineral or mineral group on a particle
Mineral Liberation Distribution of phases, particulate or elements release categories
Mineral Locking Quantitative data on the mineral where the mineral of interest this included
Mineral Release Release of a mineral interest in fraction size
Grade recovery curve Maximum mineral recovery or element in a level of flotation Grain Size Distribution of mineral grains with particle size
Particle Size Distribution of mineral particles in size categories Particle Density Division of mineral particles into categories based on the
average density value
Phase specific surface area Surface area of the value specifies the selected material grains Particle viewer Viewing individual mineral particles
Category viewer Phase, chemical elements and particles distribution in pre-defined categories
HOLOS, Year 34, Vol. 03 7 A mineral classification scheme is a listing of minerals each one associated with its rules of classification and reference spectrum. Mineral attributes including chemical formulae, density, and chemical composition can be imported from a database found at Webmineral, portraying more than 4700 entrees. The rules of classification and mineral spectra can be composed from the acquired data. Individual reports show the results as tables, images and graphs. A body of reports is a Project Workbook (TIMA 2015).
Table 1 summarizes the kind of reports and descriptions made available. The Spectrum Tools is responsible for identification and correlation of XR spectra acquired from the Spectrum acquisition tool or from a previously acquired database. It is also possible to mount them from the semi-quantitative analysis, importing them as reference spectra, as far as the number of sampling is in excess of 1200 (TIMA 2015).
2.2. The formation of a database applicable to minerals of Brazilian provenience.
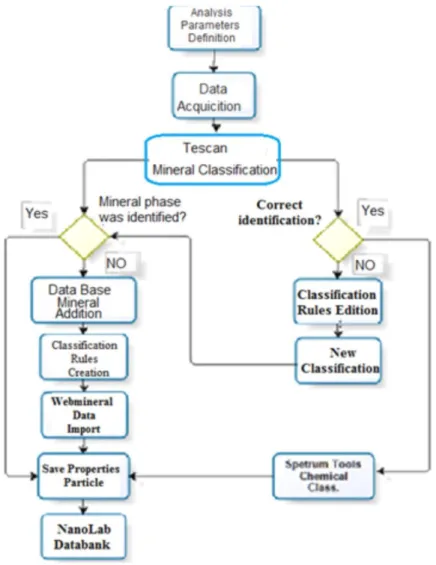
The formation of a database requires a sequence steps which are managed by a specific TIMA-MIRA module. Figure 3 flowsheet presents such sequence of steps.
HOLOS, Year 34, Vol. 03 8 The original database for this TIMA-MIRA system is the so-called Tescan_All, it has been used as a basis for developing the database for Brazilian minerals, Nanolab -all; following many additions and improvements now it is the NanoLab_all (ver. 22). This new database includes all minerals from the original database as well as completely new and/or minerals adjusted to Brazilian ore deposits, including properties, rules and spectra.
The first common step for all samples is registering the data through a Project; seven samples at most can be allocated at each time. It follows a phase evaluation taking XR difractometry as a guide; data from Webmineral site are used to validate the species and their associations. Phases not automatically identified, after carefully identifying the element peaks at each sample, have been included in Nanolab-All. Mineral properties have been imported from Webmineral site. Data for an incorrectly classified phase were adjusted after editing their rules or a new phase was inserted.
3. RESULTS AND DISCUSSION 3.1. Mineral database
The methodology presented here has been applied for identifying circa 193 species and associations; the result is a database comprising Brazilian minerals from different ore bodies.
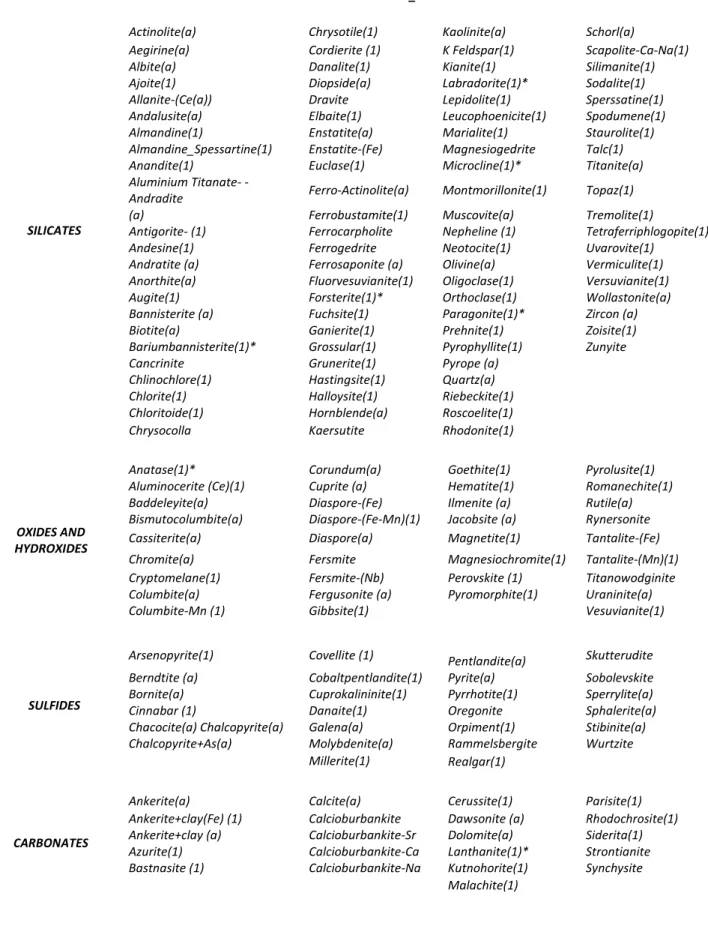
Rules of identification have been defined for 100 minerals, their properties taken from Webmineral site, as well as additional information from MEV-EDX. Afterwards they have been included in the new database. Rules for 60 minerals have been changed in order to adapt them to Brazilian ore deposits conditions. Information on 23 remaining minerals has been kept unchanged as in the original database. Even following a careful identification process some specific mineral data were not inserted in the database due to data inconsistencies. Table 3 shows a listing of minerals: those identified as (1) have been inserted; those identified as (a) had their rules modified; the others are from the original database. The species classification follows (Dana,1981).
The silicates have been selected for this work have shown a variety of responses after being analyzed in this system. Minerals of this family are tetrahedral structures of Oxygen bound in configurations of different complexity with their interstices occupied by atoms of silicon, aluminum, iron, manganese calcium, potassium and sodium (Dana, 1981). The complex structural and composition follows an isomorphic and polymorphic variety of specimens and solid solutions. No difficulties have been found to classify minerals with well defined chemical composition. Their rules have been defined by attribution of maximum and minimum peak intensities for each element. As an example, lepidolite [K (Li, Al)3(Si, Al)4O10(F, OH)2] was initially not identified. A XR spectrum was acquired at each pixel and it has have been quantified for elements peak intensity.
HOLOS, Year 34, Vol. 03 9 Table 2. Database of minerals and mineral associations developed for TIMA- MIRA and following Dana (1981)
classification: new inserted minerals: “ (1) ”; minerals with adjusted rules: “ (a) ”. NANOLAB_ALL database
SILICATES
Actinolite(a) Chrysotile(1) Kaolinite(a) Schorl(a)
Aegirine(a) Cordierite (1) K Feldspar(1) Scapolite-Ca-Na(1)
Albite(a) Danalite(1) Kianite(1) Silimanite(1)
Ajoite(1) Diopside(a) Labradorite(1)* Sodalite(1)
Allanite-(Ce(a)) Dravite Lepidolite(1) Sperssatine(1)
Andalusite(a) Elbaite(1) Leucophoenicite(1) Spodumene(1)
Almandine(1) Enstatite(a) Marialite(1) Staurolite(1)
Almandine_Spessartine(1) Enstatite-(Fe) Magnesiogedrite Talc(1)
Anandite(1) Euclase(1) Microcline(1)* Titanite(a)
Aluminium Titanate- -
Andradite Ferro-Actinolite(a) Montmorillonite(1) Topaz(1)
(a) Ferrobustamite(1) Muscovite(a) Tremolite(1)
Antigorite- (1) Ferrocarpholite Nepheline (1) Tetraferriphlogopite(1)
Andesine(1) Ferrogedrite Neotocite(1) Uvarovite(1)
Andratite (a) Ferrosaponite (a) Olivine(a) Vermiculite(1)
Anorthite(a) Fluorvesuvianite(1) Oligoclase(1) Versuvianite(1)
Augite(1) Forsterite(1)* Orthoclase(1) Wollastonite(a)
Bannisterite (a) Fuchsite(1) Paragonite(1)* Zircon (a)
Biotite(a) Ganierite(1) Prehnite(1) Zoisite(1)
Bariumbannisterite(1)* Grossular(1) Pyrophyllite(1) Zunyite
Cancrinite Grunerite(1) Pyrope (a)
Chlinochlore(1) Hastingsite(1) Quartz(a)
Chlorite(1) Halloysite(1) Riebeckite(1)
Chloritoide(1) Hornblende(a) Roscoelite(1)
Chrysocolla Kaersutite Rhodonite(1)
OXIDES AND HYDROXIDES
Anatase(1)* Corundum(a) Goethite(1) Pyrolusite(1)
Aluminocerite (Ce)(1) Cuprite (a) Hematite(1) Romanechite(1)
Baddeleyite(a) Diaspore-(Fe) Ilmenite (a) Rutile(a)
Bismutocolumbite(a) Diaspore-(Fe-Mn)(1) Jacobsite (a) Rynersonite
Cassiterite(a) Diaspore(a) Magnetite(1) Tantalite-(Fe)
Chromite(a) Fersmite Magnesiochromite(1) Tantalite-(Mn)(1)
Cryptomelane(1) Fersmite-(Nb) Perovskite (1) Titanowodginite
Columbite(a) Fergusonite (a) Pyromorphite(1) Uraninite(a)
Columbite-Mn (1) Gibbsite(1) Vesuvianite(1)
SULFIDES
Arsenopyrite(1) Covellite (1) Pentlandite(a) Skutterudite
Berndtite (a) Cobaltpentlandite(1) Pyrite(a) Sobolevskite
Bornite(a) Cuprokalininite(1) Pyrrhotite(1) Sperrylite(a)
Cinnabar (1) Danaite(1) Oregonite Sphalerite(a)
Chacocite(a) Chalcopyrite(a) Galena(a) Orpiment(1) Stibinite(a)
Chalcopyrite+As(a) Molybdenite(a) Rammelsbergite Wurtzite
Millerite(1) Realgar(1)
CARBONATES
Ankerite(a) Calcite(a) Cerussite(1) Parisite(1)
Ankerite+clay(Fe) (1) Calcioburbankite Dawsonite (a) Rhodochrosite(1)
Ankerite+clay (a) Calcioburbankite-Sr Dolomite(a) Siderita(1)
Azurite(1) Calcioburbankite-Ca Lanthanite(1)* Strontianite
Bastnasite (1) Calcioburbankite-Na Kutnohorite(1) Synchysite
HOLOS, Year 34, Vol. 03 10
PHOSPHATES
Amblygonite(1) Frondelite(1) Pyromorphite(1)
Apatite(a) Herderite(1) Pseudomalachite(1)
Beryllonite(1) Lazulite(1) Theisite(1)
Brazilianite(1) Montebrasite(1) Xenotime-(Y) (a)
Faustite (1) Monazite(a)
SULFATES
Alunite Baryte(a) Cerussite(1)
Anhydrite(1) Celestite Gypsum(1)
Antlerite(1)
HALIDES Atacamite(a) Halite(1) Adamite(1)
Fluorite(a) Sylvite(1) Cuprian Adamite(1)
NATIVE ELEMENTS
Bismuth (a) Gold (a) Sulphur(1)
Chromferide Silver (a)
TUNGSTATES MOLIBDATES BORATES
Gaudefroyite(1) Hubnerite(1)* Scheelite(1) Wolframite(1)
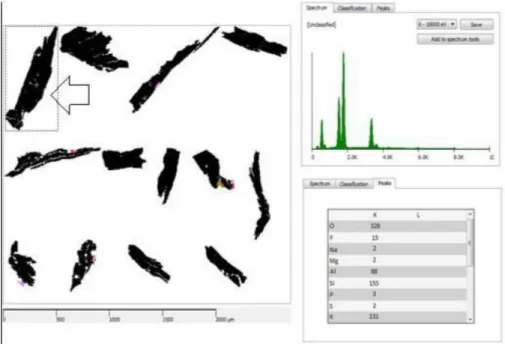
Figure 4 depicts data acquired for a sample of lepidolite, using the original TIMA-MIRA database. Sections black colored could not be identified because the original database rules of identification do not include all particularities of this specific lepidolita.
The RX spectrum (guide spectrum) as well as an array of peak intensities for chemical elements (Guide Peaks), have been attributed to a region inside the sample(see arrow). Maximum and minimum values of intensity for each element to define their rules of classification have being selected by the tool Intensity; those set of rules has been inserted with properties values from Webmineral site in the NanoLab_all database. After reclassification the particles were promptly identified using the new database; now all particles have been properly colored, Figure 5.
HOLOS, Year 34, Vol. 03 11 Figure 5. Definition of classification rules of lepidolita according to maximum and minimum element values peak
intensity (Guide Rules); importation of properties from Webmineral site (Guide of Properties and Composition). Many XR spectra have been collected considering chemical composition variations inside each particle; they have been acquired through the feature Spectrum tools and exported to the new database as shown in Figure 6. These spectra have been not used for mineral classification but they allow to compare spectra with forthcoming mineral samples and then make apparent chemical variations coming from geological processes.
The main inconsistencies registered in this work are due to polymorphic materials (same composition) such as crisotila - antigorita, cianita - andalusita - similanita, without a sizable difference of element peak intensities; those kinds of element can be not identified separately and are grouped under the same name. The same happens for solid solutions such as the forsterita-faialita series; in this case the absent individual members impairs the definition of individual element classification and they are all classified as olivina.
Figure 6. Quantification (Chemistry guide) and simulation (Guide Spectrum by Chemistry) of XR spectra of a selected particle by the Spectrum Tools.
HOLOS, Year 34, Vol. 03 12 However discontinuous solid solutions as in the series albita-anortita allow the identification of individual members; this has been performed for minerals such as anortita, labradorita, oligoclásio, andesina and albita.
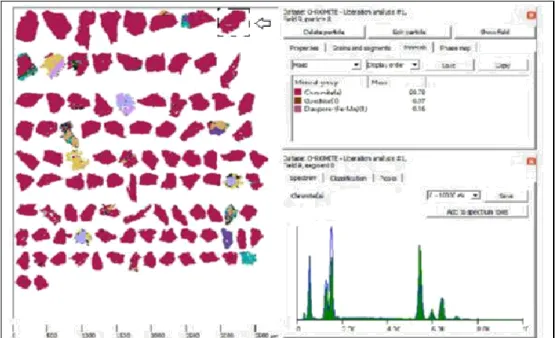
Some selected oxides are non-identified/classified phases according the original database. Chromite was previously inserted and the majority of chromite particles was correctly identified using the original database, Figure 7. In order to improve the likelihood of success XR data for chromite has been acquired from semi-quantitative analysis using the Spectrum tools.
A comparison between spectrum (green colore) acquired through the new database and spectrum (blue colore, Guide Spectrum) acquired through the old database is shown in figure 7 for a selected point inside a given particle (see cross inside the dot squared area). Mineral members of this class resemble each other both in chemical compositions as well as in element proportion; thus, there are not sizable differences as far as BSE brightness and peak intensities are concerned. As a result, the proper mineral identification required a careful establishment of specific identification rules.
Figure 7. Particle of chromite correctly identified as presented in purple.
A great deal of data has been gathered for iron oxides and hydroxides coming from different mineral bodies. The goal was to establish rules of identification based on a sound statistical basis. The rules are as follows:
A rule was based on ranges of BSE (BSE Level) brightness. Iron oxides such as Magnetite (Fe2O3. FeO), Hematite (Fe2O3) and the iron hydroxide goethite (FeO (OH)) are chemically similar with the same main elements but with quite different iron contents. Monominerals of each of them have used to detect their specific range of BSE brightness. Then the range of BSE brightness has been used to show the details of each monomineral element. However, the BSE brightness was shown to be influenced by particle size distribution and particle position inside a polymineral sample; the result was an overlap of BSE brightness ranges and as such the aforementioned iron minerals could not be properly identified.
A rule was based simultaneously on the Fe/O ratio and BSE brightness level. This new rule was established since TIMA originally does take in account chemical differences.
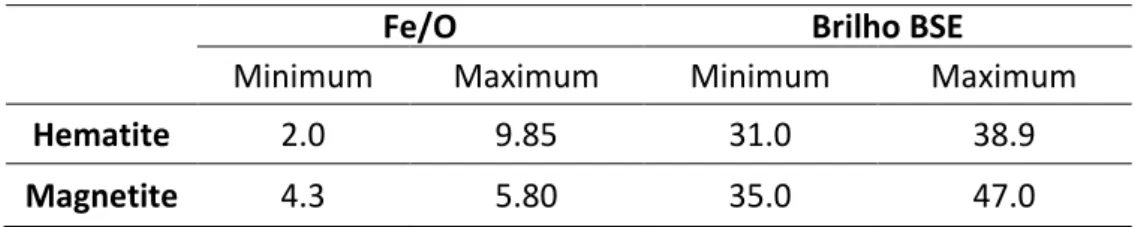
HOLOS, Year 34, Vol. 03 13 After applying this rule, the identification values are as shown in Table 3.
Table 3. Values of Fe/O ratio and BSE brightness for hematite and magnetite identification.
Fe/O Brilho BSE
Minimum Maximum Minimum Maximum
Hematite 2.0 9.85 31.0 38.9
Magnetite 4.3 5.80 35.0 47.0
Table 4 shows the identification values for an assembly of hematite/magnetite.
Table 4. Values for identification of a hematite/magnetite assembly
Fe/O BSE brightness
Minimum Maximum Minimum Maximum
Hematite/Magnetite 2 9.85 30 47
A rule based on peak intensities (Intensity) of the main sample elements. Since goethite contains specific elements such as Phosphorus (P), Barium (Ba) with important peak intensities, but not present in the oxides, a rule was built based on this feature.
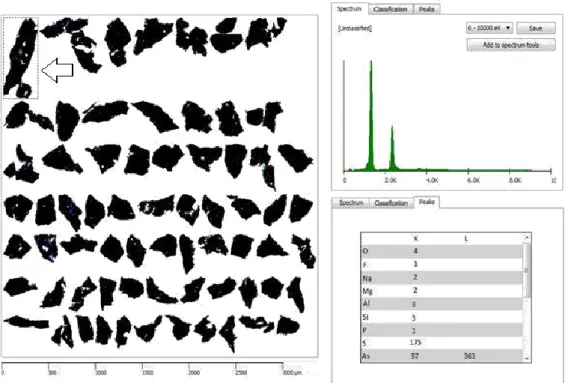
The most common sulfides have been included in the original database; their identification posed no major problems with slightly modifications on the rules of classification and EDS spectra. According to Dana (1981) minerals of this class are an association of a metal with a semimetal. They are sulfides, arsenides, antimonides, selenides e telurides. Their compositions are defined by different cations. This feature allows to identify these minerals through element peak intensities; their BSE brightness ranges are from 40 to 60 %. Even for minerals with a close chemical composition such as pyrite and pyrrotite it has been possible to establish rules of identification based on peak intensities without sizable overlapping. Given particles of realgar [AsS] were not initially identified. Figure 8 shows realgar data acquired by TIMA-MIRA using the original database.
Thus, XR spectra from some selected locations at many particles have been acquired in order to identify the element peak intensity characteristic of this mineral; also, its properties have been imported from Webmineral. Specific BSE brightness levels are fundamental to separate sulfides from other minerals and have also been incorporated in the database.
The same sort of procedure was employed in order to identify other sulfides. Carbonates are simple in their composition. However, discrepancies regarding the non-identification of carbon have been recorded. Some rules of carbonates identification overlapped rules of oxides identification. Thus, XR spectra from some selected locations in many particles have been acquired in order to identify the element peak intensity characteristic of this mineral; also, its properties have been imported from Webmineral. Specific BSE brightness levels are fundamental to separate sulfides from other minerals and they have also been incorporated in the database.
HOLOS, Year 34, Vol. 03 14 Figure 8. Particles of realgar that were not initially identified are black colored in the picture above, after the new
rules applied these particles were correctly identified and are blue colored in the picture.
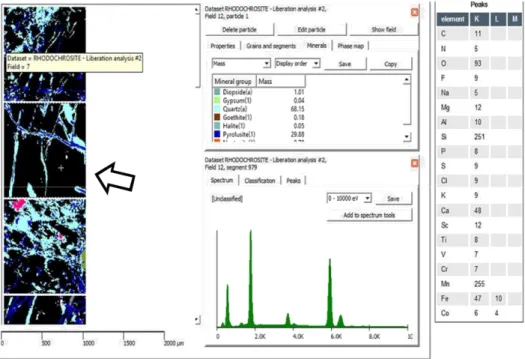
HOLOS, Year 34, Vol. 03 15 Figure 10. Particles of rhodochrosite initially not identified are shown in black; pyrolusite is in deep blue. A point
inside the particle (see cross) was selected for XR spectra acquisition through Guide Spectrum; also the peaks
intensities have been determined through Guide Peaks.
An assembly of representative data regarding peak element intensities has been gathered for rhodochrosite. However, since Carbon can be not properly identified by XR analysis an array of other elements has been included. They were Rubidium (its peak intensity is higher than in pyrolusite), Manganese and Oxygen; ranges of peak intensities have been defined for each of them. Properties from Webmineral have also been included in the database. After the new rules rhodochrosite particles were correctly identified, see Figure 11.
We couldn't find serious problems during the process of identification of phosphates, sulfates, halides identification and native elements since these classes are of well defined chemical compositions; they have been based on elements peak intensities. Small chemical composition variations such as in monazite have been dealt with additional XR spectra. However, frondelite [Mn2+Fe4(PO4)3(OH)5] was initially not identified or erroneously identified as jacobsite [Mn2+Fe23+O4], see Figure 12.
HOLOS, Year 34, Vol. 03 16 Figure 11. Correct Classification of the mineral Rhodochrosite
Jacobsite depicts a rule of identification based on Oxygen, Manganese and Iron, the same elements present in frondelita; as a result, the peak intensities show a considerable overlapping. An array of peak intensities of the chemical elements contained in frondelita was acquired allowing the definition of characteristic maximum and minimum values; these values have been inserted in the database (by the Intensity tool), along with the particle characteristic spectra. It is worth noticing that Phosphorus was included since jacobsite does not contain this element. After the new rules frondelita was correctly identified, Figure 13. In this particular case the acquired XR spectrum allows a comparison with the spectrum from the original database; the agreement is apparent, Figure 14.
Figure 12. Particles of frondelite initially not identified are in black; particles erroneously identified as jacobsite are in green.
HOLOS, Year 34, Vol. 03 17 Figure 13. Definition of new rules of frondelite identification; maximum and minimum values of peak intensities
are assigned through Guide Rules; properties from Webmineral (Guide Properties and Composition) are added. After the new rules the correctly identified particle are shown in green.
Figure 14. Quantification (Guide Chemistry) and simulation results (Guide Spectrum by Chemistry) of a given particle spectrum selected by Spectrum Tools.
HOLOS, Year 34, Vol. 03 18
3.2. Case Study
Mineral characterization of Au ores.
In this study, nine polished sections were analyzed containing portions of a sample from golden ore, originating from the south east region of the state of the Pará, Brazil, designated by the nomenclature PP-A to PP-J, all replicates of the original sample.
The sample was homogenized and quartered, supplying 9 quoted replicates. For such an analysis adopted the constant parameters of measurement in the Figure 15.
Figure 15. Bright Phase Search parameters of identification– Gold Ore
Figure 16 shows a mapping of all phases with BSE brightness within the 60 to 100% range; they have been classified following NanoLab_all database (version.22).
HOLOS, Year 34, Vol. 03 19 Table 5 shows the relative mass distribution (weight %). in the retorts of the sample from golden ore
Table 5. Relative mass distribution (weight%) of the retorts in the golden ore sample
The Table 6 presents the types and complexities of the particles associated with the gold in all retorts of the analyzed sample.
Minerals /Mass [%] PP-A PP-B PP-C PP-D PP-E
Moscovita(a) 0.00 0.00 0.00 0.05 0.15 Goethite(1) 14.12 0.00 4.97 3.44 4.25 Arsenopyrite(1) 46.32 0.00 92.63 70.94 85.53 Hematite/Magnetite(1) 0.90 0.00 0.38 0.00 0.01 Gypsum(1) 0.13 0.00 0.02 0.12 0.06 Quartz(a) 35.72 0.00 0.04 23.63 4.50 Biotite(a) 0.00 0.00 0.13 1.34 0.64 Gold(a) 2.78 0.00 1.73 0.30 4.55 The rest 0.04 0.00 0.09 0.17 0.05 Total 100.00 0.00 100.00 100.00 100.00
Minerals / Mass [%] PP-F PP-G PP-H PP-I PP-J
Moscovita(a) 0.00 0.00 2.05 0.00 0.02 Goethite(1) 8.55 2.04 2.66 1.88 5.50 Ankerite(a) 0.00 2.70 0.03 0.00 0.00 Lepidolite(1) 0.04 0.01 0.25 0.00 0.00 Arsenopyrite(1) 34.40 59.83 73.72 88.11 62.43 Cassiterite(a) 0.00 0.61 0.00 0.00 0.04 Galena(a) 0.07 0.25 0.03 0.00 0.42 Microcline(1) 0.00 0.00 0.75 0.00 0.01 Wolframite(1) 2.41 0.00 0.00 0.00 0.00 Chalcopyrite(a) 0.00 0.01 0.12 0.10 0.00 Hematite(1) 0.50 0.11 1.00 0.45 0.30 Magnetite(1) 0.32 0.00 0.05 0.14 0.00 Rutile-Anatase(a) 0.72 0.00 1.18 0.22 0.12 Wurtzite 0.00 0.00 0.00 0.10 0.00 Gypsum(1) 0.45 0.00 0.01 0.00 0.07 Pyrite(a) 43.28 23.32 0.00 7.06 0.00 Pyrrhotite(a) 0.35 0.07 0.00 0.00 0.00 Quartz(a) 4.79 7.38 5.83 0.06 18.68 Biotite(a) 0.00 0.07 2.33 0.05 0.24 Hubnerite(a) 0.18 0.00 0.00 0.00 0.00 Gold(a) 3.72 3.33 8.92 1.82 12.00 The rest 0.23 0.25 0.08 0.02 0.17 Total 100.00 100.00 100.00 100.00 100.00
HOLOS, Year 34, Vol. 03 20 Table 6. Types of the associations of the particles with the gold.
Min. groups / Mass [%] Gold Min. groups / Mass [%] Gold
PP-A - Bright phase search - particles PP-F - Bright phase search - particles
Free particles 0.00 Free particles 5.92
Binary particles 0.00 Binary particles 0.00
Complex particles 100.00 Complex particles 94.08
Total 100.00 Total 100.00
PP-B - Bright phase search - particles PP-G - Bright phase search - particles
Free particles 0.00 Free particles 0.39
Binary particles 0.00 Binary particles 0.00
Complex particles 0.00 Complex particles 99.61
Total 0.00 Total 100.00
PP-C - Bright phase search - particles PP-H - Bright phase search - particles
Free particles 0.00 Free particles 1.15
Binary particles 0.00 Binary particles 0.00
Complex particles 100.00 Complex particles 98.85
Total 100.00 Total 100.00
PP-D - Bright phase search - particles PP-I - Bright phase search - particles
Free particles 0.00 Free particles 0.00
Binary particles 0.00 Binary particles 0.00
Complex particles 100.00 Complex particles 100.00
Total 100.00 Total 100.00
PP-E - Bright phase search - particles PP-J - Bright phase search - particles
Free particles 0.00 Free particles 0.00
Binary particles 0.00 Binary particles 0.00
Complex particles 100.00 Complex particles 100.00
Total 100.00 Total 100.00
The table 7 presents the distribution of the size of grain of the golden particles in 9 retorts of the analyzed sample.
Table 7: Distribution of grain size from the gold in the retorts of the sample
Size range / Mass of Gold(a) [%] Midpoint [µm] PP-A PP-B PP-C PP-D PP-E
>0.10<2.0 µm 0.4 0.0 0.0 0.0 0.0 0.0
>2.0<40 µm 8.9 100.0 0.0 100.0 100.0 100.0
HOLOS, Year 34, Vol. 03 21
Size range / Mass of Gold(a) [%] Midpoint [µm] PP-F PP-G PP-H PP-I
>0.10<0.36 µm 0.2 0.0 0.0 0.0 0.0 >0.36<1.3 µm 0.7 0.0 0.0 0.0 0.0 >1.3<4.7 µm 2.5 4.7 1.6 5.1 1.2 >4.7<17 µm 8.9 95.3 10.9 94.9 48.1 >17<61 µm 32.3 0.0 87.5 0.0 50.8 >61<222 µm 116.6 0.0 0.0 0.0 0.0 >222<800 µm 421.0 0.0 0.0 0.0 0.0 Total 100.0 100.0 100.0 100.0
The Table 8 presents the degree of liberation of the golden particle in the retorts of the analyzed sample.
Table 8. Degree of Liberation of the golden particle Surface area of Gold(a) [%]
Mass of Gold(a) [%] PP- A PP-B PP- C PP-D PP-E PP-F PP-G PP-H PP-I
<10 % 2.8 0.0 1.7 0.1 4.6 3.5 3.3 1.8 8.8 >10<20 % 0.0 0.0 0.0 0.0 0.0 0.0 0.0 0.0 0.0 >20<30 % 0.0 0.0 0.0 0.0 0.0 0.0 0.0 0.0 0.0 >30<40 % 0.0 0.0 0.0 0.0 0.0 0.0 0.0 0.0 0.0 >40<50 % 0.0 0.0 0.0 0.0 0.0 0.0 0.0 0.0 0.0 >50<60 % 0.0 0.0 0.0 0.0 0.0 0.0 0.0 0.0 0.0 >60<70 % 0.0 0.0 0.0 0.0 0.0 0.0 0.0 0.0 0.0 >70<80 % 0.0 0.0 0.0 0.0 0.0 0.0 0.0 0.0 0.0 >80<90 % 0.0 0.0 0.0 0.0 0.0 0.0 0.0 0.0 0.0 >90<100 % 0.0 0.0 0.0 0.0 0.0 0.0 0.0 0.0 0.0 Liberated 0.0 0.0 0.0 0.0 0.0 0.2 0.0 0.0 0.1 Total 2.8 0.0 1.7 0.1 4.6 3.7 3.3 1.8 8.9 4. CONCLUSION
A routine was developed to generate a TIMA-MIRA database with a more comprehensive content and specifically applied to minerals of Brazilian provenance. This routine, which includes a sequence steps, such as selection, preparation and analysis of mineral samples allowed properly identifying and classifying minerals that the distinction was not possible using the original system database.
The aforementioned limitation of the original database applied, for example, to oxides, a main element of Brazilian ore deposits, after this process, the selected minerals had their identification rules inserted in the new database, taking into account Its chemical composition, peak intensities of specific chemical elements and its BSE brightness. Identification difficulties were found with respect to polymorphic materials and some solid solutions at the closure of the chemical composition. Thus, the combination of the techniques described herein is very useful for automatic detection of mineral phases. This combination may also include in some situations optical microscopy, XR diffractometry and crystallographic studies of EBSD.
HOLOS, Year 34, Vol. 03 22 With respect to the study of gold ore, the system proved to be effective in the characterization and disclosure of small gold particles and their mineralogical associations, proving the great importance when agility is required in obtaining results.
The efficiency of the mineralogical classification in the system is strictly dependent on the analyzed surface, demanding a high-quality preparation, without the presence of surface roughness, as this directly influences the BSE level of the particle. It is important to emphasize that the developed routine should not be used solely in the study of the materials of interest, but in any method of mineralogical characterization. The quality of the results obtained depends on the experience and the technical-scientific knowledge of the operator and of subsequent validations by complementary techniques. The process of insertion of new minerals is continuous and will always be associated to the geological context of the ore studied.
5. ACKNOWLEDGEMENTS
I would like to thank Rede Temática de Engenharia de Materiais (REDEMAT), Universidade Federal de Ouro Preto (UFOP), Laboratório NanoLab-CMM-REDEMAT-UFOP and Centro de Microscopia – Universidade Federal de Minas Gerais (CM-UFMG).
6. REFERENCES
Dana J.D. Dana'S Manual Of Mineralogy For The Student Of Elementary Mineralogy, The Mining Engineer, The Geologist, The Prospector, The Collector, Etc...(2011), Nabu Press. 494 p.
Fandrich, R., Ying Gu, Y., Burrows, D., Moeller, D. (2007). Modern SEM-based mineral liberation analysis,International Journal of Mineral Processing,Volume 84, Issues 1–4, pp. 310-320, https://doi.org/10.1016/j.minpro.2006.07.018.
FEI COMPANY (2012): Product datasheets for MLA 650 and 650F instruments. FEI. 2015. Disponível em<http://www.fei.com/> Acesso em:27 de maio de 2015.
Gottlieb P., Wilkie G., Sutherland D., Ho Tun, E., 2000. Using quantitative electron microscopy for process mineralogy applications. J. Minerals & Materials Characterisation & Engineering 52, 24–27.
Heinrich K. F. J.,1966. X-ray optics and microanalysis. In 4th International Congress on ray Optics and Microanalysis (R. Castaing, P.Deschamps & J. Philibert, eds.), Hermann, Paris,p.1509.
Neumann, et al., 2004. The Evolution of the Upper Mantle beneath the Canary Islands: Information from Trace Elements and Sr isotope Ratios in Minerals in Mantle Xenoliths. Journal of Petrology.Vol.45 (12), pp.2573-261 Mineral Database,Webmineral. 2015. Disponível em <http://webmineral.com> Acesso 15 de outubro de 2015.
Petruk, W., 1989. The MP-SEM-IPS image analysis system: short course handbook. Image analysis in earth science. In: W. Petruk (Ed.) CANMET, Ottawa, Canada, 16, pp. 37–42.
Rocio, M.A.R., et al., 2012, "Terras-raras: situação atual e perspectivas." BNDE, Setorial, n. 35, p. 369-420.
Sutherland D. N., Gottlieb P. 1991. Application of automated quantitative mineralogy in mineral processing. Minerals Engineering, 4(7): 753-762. Sylvester P. J., 2012. Chapter 1: Use of the mineral liberation analyzer (MLA) for mineralogical studies of sediments and sedimentary rocks. Mineralogical Association of Canada Short Course, 42, St. John’s NL, p. 1-16.