Wnt/
b
-Catenin Signaling Induces the Aging of
Mesenchymal Stem Cells through the DNA Damage
Response and the p53/p21 Pathway
Da-yong Zhang, Hai-jie Wang, Yu-zhen Tan*
Department of Anatomy and Histology and Embryology, Shanghai Medical College of Fudan University, Shanghai, People’s Republic of China
Abstract
Recent studies have demonstrated the importance of cellular extrinsic factors in the aging of adult stem cells. However, the effects of an aged cell–extrinsic environment on mesenchymal stem cell (MSC) aging and the factors involved remain unclear. In the current study, we examine the effects of old rat serum (ORS) on the aging of MSCs, and explore the effects and mechanisms of Wnt/b-catenin signaling on MSC aging induced by ORS treatment. Senescence-associated changes in the cells are examined with SA-b-galactosidase staining and ROS staining. The proliferation ability is detected by MTT assay. The surviving and apoptotic cells are determined using AO/EB staining. The results suggest that ORS promotes MSC senescence and reduces the proliferation and survival of cells. The immunofluorescence staining shows that the expression ofb-catenin increases in MSCs of old rats. To identify the effects of Wnt/b-catenin signaling on MSC aging induced with ORS, the expression ofb-catenin, GSK-3b, and c-myc are detected. The results show that the Wnt/b-catenin signaling in the cells is activated after ORS treatment. Then we examine the aging, proliferation, and survival of MSCs after modulating Wnt/
b-catenin signaling. The results indicate that the senescence and dysfunction of MSCs in the medium containing ORS is reversed by the Wnt/b-catenin signaling inhibitor DKK1 or byb-catenin siRNA. Moreover, the expression of c-H2A.X, a molecular marker of DNA damage response, p16INK4a, p53, and p21 is increased in senescent MSCs induced with ORS, and is also reversed by DKK1 or byb-catenin siRNA. In summary, our study indicates the Wnt/b-catenin signaling may play a critical role in MSC aging induced by the serum of aged animals and suggests that the DNA damage response and p53/p21 pathway may be the main mediators of MSC aging induced by excessive activation of Wnt/b-catenin signaling.
Citation:Zhang D-y, Wang H-j, Tan Y-z (2011) Wnt/b-Catenin Signaling Induces the Aging of Mesenchymal Stem Cells through the DNA Damage Response and the p53/p21 Pathway. PLoS ONE 6(6): e21397. doi:10.1371/journal.pone.0021397
Editor:Austin John Cooney, Baylor College of Medicine, United States of America
ReceivedMarch 3, 2011;AcceptedMay 27, 2011;PublishedJune 21, 2011
Copyright:ß2011 Zhang et al. This is an open-access article distributed under the terms of the Creative Commons Attribution License, which permits unrestricted use, distribution, and reproduction in any medium, provided the original author and source are credited.
Funding:This work was supported by grants from Natural Science Foundation of China (30470883 and 30971674) and The Research Fund for the Doctoral Program of Higher Education of China (200802460044). The funders had no role in study design, data collection and analysis, decision to publish, or preparation of the manuscript.
Competing Interests:The authors have declared that no competing interests exist. * E-mail: [email protected]
Introduction
Stem cells are important for maintaining and repairing adult organs. Recent data have demonstrated that the stem cells of older individuals show senescence and their function gradually decline with increasing age [1]. Mesenchymal stem cells (MSCs) are characterized by their ability to self-renew and to differentiate into multiple cell lineages [2,3], and have been widely used in clinical cell transplantation therapy [4]. However, the aging of MSCs affects their clinical application [5,6]. Recent studies have shown that MSC function declines in older individuals and that MSC dysfunction influences the effects of autologous MSC transplan-tation in older individuals [7,8]. Moreover, when xenogenic MSCs are transplanted in older individuals, MSC function is also limited in the older recipients because of the effects of the aged cell– extrinsic environment [9]. Increasing studies have shown that an aged cell–extrinsic environment plays an important role in the aging of adult stem cells [10–12]. However, the effects of an aged environ-ment on MSC function, especially on their ability to proliferate and survive, remain unclear. Therefore, research on the effects of an aged cell–extrinsic environment on the senescence and function of MSCs has important clinical significance.
A number of studies have demonstrated that serum is an important factor in cell senescence [13,14]. As a systemic milieu [15], serum has an important influence on stem cell function [16]. Recent studies have suggested that old mouse serum induces the aging or dysfunction of satellite cells, embryonic stem cells, and hemopoietic stem cells [11,13,14]. However, the critical factors that promote stem cell aging in the serum of older individuals are still unclear. Brack et al. [17] investigated the effects of aged cell– extrinsic environment on satellite cell senescence or dysfunction in a parabiosis model, in which the animals develop a common circulatory system, allowing blood to move between the young and old mice. When young mice are parabiotically fused with older mice, the Wnt activity of satellite cells in young mice increases, which suggests that the Wnt/b-catenin signaling of satellite cells in young mice is activated by the serum of old mice. However, more experimental evidence is necessary to identify the relationship between Wnt/b-catenin signaling and the stem cell aging induced by an aged systemic milieu.
system. When Wnt ligands bind to frizzled receptors, GSK-3b
activity is inhibited, and unphosphorylatedb-catenin accumulates in the cytoplasm and translocates into the nucleus, where it promotes the transcription of a variety of the target genes (such as c-myc) [18]. In adult mammals, Wnt/b-catenin signaling is crucial for regulating cell proliferation, cell fate determination, apoptosis, and axis polarity induction [19]. Some recent studies have shown that Wnt/b-catenin signaling is involved in cellular senescence. Liu et al. [20] investigated the effects of Wnt signaling on stem cell aging in klotho knockout mice, and demonstrated that klotho mutant mice have elevated Wnt activity, which accelerates the senescence of stem cells in hair follicles, bones, and intestinal crypts. Other studies have shown that constitutive activated Wnt/
b-catenin signaling leads to the rapid exhaustion of hematopoietic stem cells [21,22], and the senescence or dysfunction of fibroblasts [23], thymocytes [24], endothelial cells [25], and human mam-mary artery cells [26]. These data have revealed the new biological role of Wnt/b-catenin signaling on cellular aging. However, whether the Wnt/b-catenin signaling plays an important role in MSC aging remains unclear. In the present study, we investigate the effects of the Wnt/b-catenin signaling on MSC aging.
The mechanisms of cell senescence induced by Wnt/b-catenin signaling are still poorly understood. Xu et al. [24] reported thatb -catenin overexpression inducesc-H2A.X expression in thymocytes, which suggests that activated Wnt/b-catenin signaling can induce the DNA damage response (DDR). DDR induces p16INK4a expression [27,28]. The p16INK4agene is an aging-induced gene that directly induces cellular aging [29,30]. Other studies have shown that activated Wnt/b-catenin signaling causes p53 accumulation [23,25], whereas p21, a target gene of p53 protein, directly induces cellular aging [31]. Therefore, we detected the expression of c-H2A.X, p16INK4a, p53, and p21 in MSCs, and explored whether activated Wnt/b-catenin signaling induces aging in MSCs through DDR and the p53/p21 pathway.
In the current study, the effects of old rat serum (ORS) on aging, proliferation, and survival of MSCs are investigated. To determine the effects of ORS on Wnt/b-catenin signaling of MSCs, the ex-pressionof b-catenin, GSK-3b, and c-myc are examined. In addition, to evaluate the role of Wnt/b-catenin signaling on MSCs aging, we investigated the aging, proliferation, and survival of MSCs after modulating Wnt/b-catenin signaling. Finally, to determine the mechanisms of Wnt/b-catenin signaling in MSCs aging, the expression of c-H2A.X, p16INK4a, p53, and p21 are examined.
Materials and Methods
Isolation and culture of MSCs
Sprague–Dawley (SD) rats were obtained from the Medical Institute Animal Center of Fudan University (Permit number SYXK (Shanghai) 2009-0019), China. The investigation was permitted by the Law of the People’s Republic of China on the Protection of Wildlife, and the protocol was approved by the Institutional Animal Care Committee from Fudan University, China. Bone marrow was harvested from SD rats aged 12–14 weeks. The femurs and tibias were removed from the SD rats and bone marrow was flushed out of the bones using 10 mL PBS with 100 U/mL heparin in a syringe. The cells were centrifuged at 1000 rpm for 8 min. The cell pellet was resuspended in 10 mL Dulbecco’s modified Eagle’s medium (DMEM; Gibco, USA) supplemented with 15% fetal bovine serum (FBS, Gibco, USA) and plated in a 25 cm2plastic flask (Corning, USA) to allow the MSCs to adhere. After 3 days, the medium was changed and the non-adherent cells were discarded. The medium was completely
replaced every three days. Approximately 7–10 days after seeding, the cells became nearly confluent. The adherent cells were released from the dishes with 0.25% trypsin (Gibco, USA) and seeded into new fresh culture flasks. All the experiments described below were performed using MSCs from the third to the fifth passage.
Isolation of serum
Whole blood was collected from anesthetized young (3–4 weeks old) or old (64–68 weeks old) SD rats via the abdominal aorta. Blood was clotted at 37uC for 4 h. Serum was isolated by centrifugation (9,000 rpm for 10 min). The supernate was col-lected, centrifugation was repeated, and then the supernate was collected again. Serum from young rats is designated ‘‘young rat serum’’ (YRS), whereas that from aged rats was designated as ‘‘old rat serum’’ (ORS).
RNAi (RNA interference)
The siRNA oligonucleotides were synthesized by Genepharma Co., Ltd. (Shanghai, China). The effective sequence used for the specific silencing ofb-catenin was 59 -CACCTCCCAAGTCCTT-TAT-39. The siRNA sequence was named by si-b-catenin. The non-silencing control siRNA is an irrelevant siRNA with random nucleotides 59-TTCTCCGAACGTGTCACGT-39 and is not homologous to any sequences found in the gene bank. Transfec-tion was carried out according to the manufacturer’s protocol (Qiagen Inc., Valencia, CA).
Treatment methods of MSCs
There were four groups in the present study. In the YRS or ORS groups, MSCs were cultured for 36 h in DMEM containing 20% YRS or ORS. In the ORS+DKK1 groups, 100 ng/mL Dickkopf-1 (DKKDickkopf-1, R&D Systems, USA) was directly incubated in DMEM containing 20% ORS for 36 h. In ORS+si-b-catenin group, the cells were first transfected with si-b-catenin for 12 h, and then 20% ORS was further added in the culture medium for 36 h.
SA-b-Gal staining
Senescence-associated b-galactosidase (SA-b-gal) staining was performed using a SA-b-gal staining kit (Genmed Scientifics Inc., China) following the manufacturer’s protocol. The treatment methods for the MSCs in each group were the same as described above. The cells were then fixed in 4% (v/v) formaldehyde for 5 min and were stained with SA-b-gal–staining solution at pH 6.0 for 12 h. The SA-b-gal–positive cells exhibited a blue color. The number of positive cells was counted under a phase-contrast mic-roscope. The experiment was repeated five times in each group.
ROS staining
ROS staining was performed using an ROS staining kit (Genmed, USA) following the manufacturer’s protocol. After cultured in each group according to the above treatment methods, the cells were washed three times in PBS and incubated in ROS staining solution (DCFH-DA) at 37uC for 20 min. After washing, the nuclei were counterstained with Hoechst 33342. The cells were observed using a fluorescence microscope. To quantify the ROS level, the DCFH fluorescence intensity in the cells was detected by flow cytometer (Calibur, BD Biosciences, USA) at an excitation wavelength of 488 nm and an emission wavelength of 525 nm. Experiments were repeated three times.
MTT assay
bromide] assay. The cells were trypsinized and resuspended. Then, the cells were seeded in 96-well plates at a density of 3000–4000 cells per well. The treatment method for the MSCs in each group was the same as described above, and each group had five parallel wells. At the test culture period at Days 1, 2, 3, 4, 5, 6, and 7, the cells were incubated with 5 mg/mL of MTT (Sigma, USA) for the last 4 h. The medium was then removed and formazan salts were dissolved with 150mL of dimethylsulfoxide (DMSO, Sigma, USA). To establish a growth curve for the cell, the absorbance values were determined at 570 nm with an ELISA reader. The experiment was repeated five times in each group.
Acridine orange/ethidium bromide (AO/EB) staining
AO/EBapoptotic staining was used to detect MSC apoptosis. The treatment method of the MSCs in each group was the same as that previously described. To increase the level of oxidative stress, the cells were further exposed to 100mmol/L H2O2for 1 h. The
cells were then washed three times in PBS at room temperature. The 80mL AO/EB cocktail (Solomon Bio-Sci & Tech Co, China)
was added to the culture plates for 30 min. The cells were exam-ined by fluorescence microscopy (Nikon Eclipse E800 microscope, Japan). The results were documented as previously described [32]. Viable cells stained only with AO were bright green with intact structures, whereas cells in early apoptosis showed bright green nuclear staining. Late apoptotic cells stained with AOLOWand EB
were red-orange with condensed chromatin. To determine the apoptotic index, the number of apoptotic cells was divided by the total number of counted cells and multiplied by 100% to calculate the percentage. The experiment was repeated four times in each group.
Reverse transcription - PCR analysis
Total RNA was extracted with Trizol (Invitrogen, USA) reagent from cells. The RNA was spectrophotometrically quantified at
260 nm. The experiment was performed with an RNA PCR kit (TAKARA, Japan) according to the manufacturer’s protocol. The PCR reactions for c-myc, p16INK4a, p53, p21, andb-actin mRNA (94uC for 30 s, 54uC for 45 s, 72uC for 1 min, 35 cycles) were carried out using the following forward and reverse primers: c-mycFwd (59-CCTACCCTCTCAACG ACAGC-39) and c-mycRev (59 -CT-CTAGCCTTTTGCCAGGAG-39). p16INK4aFwd (59 -ACCAAAC-GCCCCGAACA-39) and p16INK4aRev (59 -GAGAGCTGCCAC-TTT GACGT-39); p53Fwd (59 -ACCATGAGCGCTGCTCAGAT-39) and p53Rev (59-AGTTGCAAACCAGACCTCAG-39); p21Fwd (59-TGAATGAAGGCTAAGGCA GAAGA-39) and p21Rev (59 -A-GGCAGACCAGCCTAACAGATT-39); and b-actinFwd (59 -AA-GAGAGGCATCCTCACCCT-39) and b-actinRev (59-TACATG
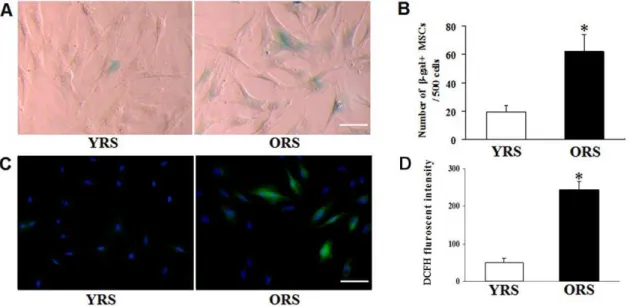
Figure 1. Effects of ORS on SA-b-gal expression and ROS fluorescence level in MSCs.(A) SA-b-gal staining. Compared with the YRS group, the number of SA-b-gal–positive cells in the ORS group was clearly increased, and those SA-b-gal–positive cells show flat and enlarged cell shape. Scale bar = 25mm. (B) Quantification of SA-b-gal–positive cells. The total number of SA-b-gal–positive cells among 500 random cells was counted
using phase-contrast microscopy. The results show that the number of SA-b-gal–positive MSCs/500 cells in the ORS group was significantly higher than that in the YRS group(*P,0.01;n= 5). (C) ROS staining. In the ORS group, more ROS–stained cells were observed through a fluorescence microscope. Green, ROS staining; blue, Hoechst 33342 staining. Scale bar = 25mm. (D) Quantification assays of the ROS level. Intracellular ROS
generation was determined by DCFH fluorescence. The DCFH fluorescence intensity in the ORS group was evidently higher compared with the YRS group (*P,0.01;n= 3).
doi:10.1371/journal.pone.0021397.g001
Figure 2. Cell proliferation curves of MSCs.MTT assay show that the proliferation of the cells was not significantly different between the YRS and ORS groups at 1 and 2 days. The absorbance in the ORS group were significantly lower than that in the YRS group from 4 to 7 days (*P,0.05;n= 5).
doi:10.1371/journal.pone.0021397.g002
GCTGGGGTGTTGAA-39). The PCR products were analyzed on 1.5% agarose gel and visualized under UV light following ethidium bromide staining. Quantitative data were expressed by normalizing the densitometric units tob-actin (internal control).
Immunofluorescence
To examine the expression of b-catenin in young or old rat MSCs, the primary MSCs were isolated from SD rats aged 12–14 or 64–68 weeks as previously described. The cells were then seeded onto 35 mm dishes and cultured in DMEM without serum for 24 h. Thereafter, the cells were fixed with 4% (v/v) form-aldehyde for 10 min. After washing with PBS, the cells were blocked with 10% BSA, and incubated at 37uC for 1 h with rabbit anti-ratb-catenin (1:200, Cell Signaling, USA) and mouse anti-rat GD2 (1:200, Imgenex, USA). Then, the cells were washed and incubated in the dark for 1 h at 37uC with goat anti-rabbit (cy3)-conjugated antibodies (1:300, ICN Cappel, USA) and goat anti-mouse FITC-conjugated antibodies (1:300, Dako, USA). After washing, the nuclei were counterstained with DAPI.
For evaluating the effect of ORS on the expression ofb-catenin, GSK-3b, c-H2A.X, and p53, the young MSCs were incubated
with b-catenin (1:200, Cell Signaling, USA), GSK-3b (1:200, Santa Cruz, USA),c-H2A.X (1:100, Santa Cruz, USA), or p53 (1:200, Santa Cruz, USA) polyclonal rabbit anti-rat antibodies. Thereafter, the cells were washed and incubated with goat anti-rabbit (cy3)-conjugated antibodies or FITC-conjugated antibodies (1:300, ICN Cappel, USA). DAPI was used to visualize nuclei. After washing and being mounted, the cells were examined under a fluorescence microscope.
Western blot analysis
To assay the b-catenin protein, cytoplasmic and nuclear proteins from cultured cells were prepared using NE-PER nuclear and cytoplasmic extraction reagents (Pierce Chemical Company, USA), respectively. b-Actin and b-tubulin were used as the internal control for the cytoplasmic and nuclear proteins. To assay GSK-3b, c-H2A.X, and p53, the total cellular protein was extracted through the following methods: The different MSC treatment groups were washed in cold-buffered PBS and were then lysed in RIPA buffer (150 mM NaCl, 1% Triton X-100, 0.5% NaDOD, 0.1% SDS, and 50 mM Tris, pH 8.0). After centrifugation (12,000 rpm, 5 min) at 4uC, the protein supernate
Figure 3. Effects of ORS on the survival and apoptosis of MSCs. (A) AO/EB staining. Most cells in the YRS group showed normal cell morphologies. In the ORS group, a small number of apoptotic cells (green- or red-orange–stained condensation nuclei) were observed. After 100mmol/L H2O2treatment for 1 h, the number of apoptotic cells in the YRS group remained low. However, in the ORS group, the apoptotic and
necrotic cells (red-orange–stained nucleus with normal structure) was clearly increased. Scale bar = 25mm. (B) MSC apoptotic index. After treatment
with 100mmol/L H2O2in the ORS group, the apoptotic index of the cells significantly increased compared with that in the YRS group (*P,0.01) or
that in the ORS group without H2O2treatment (#P,0.01;n= 4).
doi:10.1371/journal.pone.0021397.g003
Figure 4.b-Catenin and GD2 expression in MSCs from young and old rats.The immunofluorescence staining results show that theb -catenin expression is very weak in the young GD2–positive cells, but clearly increased in old GD2–positive cells. The arrow indicates the old cells co-expressed withb-catenin and GD2. Red,b-catenin; green, GD2; blue, DAPI. Scale bar = 25mm.
was transferred into new tubes. The protein concentration of the samples was determined with a bicinchoninic acid protein assay (Pierce, USA). A 40mg sample of the total protein was resolved
using 12.5% SDS-PAGE and transferred onto polyvinylidene difluoride (PVDF, Millipore, USA) membranes. The membranes were blocked with 5% nonfat milk at room temperature for 1 h in Tris-buffered saline containing Tween 20 (TBST). Primary antibodies to detect b-catenin, GSK-3b, c-H2A.X, p53, b-actin (Biovision, USA), or b-tubulin (Cell Signaling, USA) were in-cubated overnight with the membranes at 4uC. Membranes were
incubated with horseradish peroxidase (HRP)-conjugated anti-rabbit secondary antibodies (1:2000 dilution, Dako, USA), and proteins were detected by enhanced chemiluminescence (ECL) (Amersham Biosciences Corp, USA). b-Actin was used as the internal control to normalize the loading materials.
Statistical Analysis
All experiments were performed at least in triplicate. All data are presented as mean6standard deviation (SD) of the replicates. Significance testing was performed using one-way ANOVA to
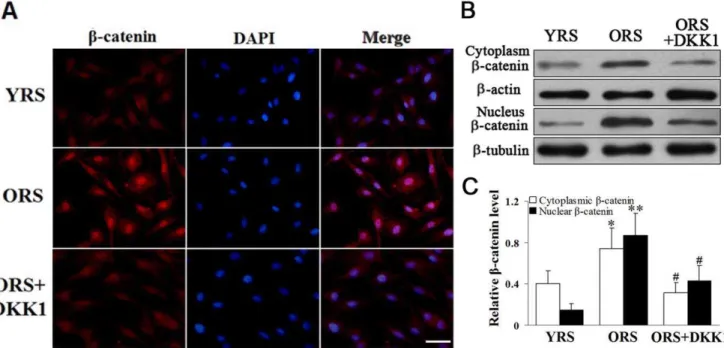
Figure 5. Effect of ORS onb-catenin expression.(A) Immunofluorescence staining ofb-catenin. In the ORS group, there was a clear increase in nuclearb-catenin expression. After treatment with 100 ng/mL DKK1, the nuclearb-catenin expression decreased. Scale bar = 25mm. (B) Western blot
analysis of the cytoplasmic and nuclearb-catenin.b-Actin was used as the internal control for the cytoplasmic proteins, whereasb-tubulin was used as the internal control for the nuclear proteins. (C) Quantification of cytoplasmic and nuclearb-catenin protein levels. An obvious increase inb -catenin protein level was detected in the cytoplasm (*P,0.05) and nuclei (**P,0.01) of the cells in the ORS group compared with that in the YRS group. In the ORS+DKK1 group, theb-catenin levels were clearly decreased compared with that in the ORS group (#
P,0.01;n= 5). doi:10.1371/journal.pone.0021397.g005
Figure 6. Effect of ORS on GSK-3bexpression.(A) Immunofluorescence staining of GSK-3b. Compared with that in the YRS group, GSK-3b expression was weak in the ORS group. However, after treatment with 100 ng/mL DKK1, the GSK-3bexpression increased. Red, GSK-3b; blue, DAPI. Scale bar = 25mm. (B) Western blot analysis of GSK-3bexpression.b-Actin was used as the internal control. (C) Quantification of GSK-3bprotein levels. GSK-3b
protein levels were significantly decreased in the ORS group compared with the YRS group (*P,0.05) and the ORS+DKK1 group (#P,0.05;n= 5). doi:10.1371/journal.pone.0021397.g006
compare data from different experimental groups. AP,0.05 was considered statistically significant.
Results
Effects of ORS on the MSCs senescence
SA-b-gal staining was used to examine the effects of ORS on MSC senescence. The MSCs which were not specially illustrated in our study were derived from SD rats 12–14 weeks old, and passage 3–5 cells were used. After culturing with ORS for 36 h, the number of SA-b-gal–positive cells obviously increased (Figure 1A). The cell count revealed that the number of SA-b-gal–positive cells was significantly different between the ORS group (62.0611.7) and the YRS group (19.464.8;P,0.01) (Figure 1B). ROS staining shows
that the number of ROS–stained cells and the DCFH fluorescent level of the cells were higher in the ORS group compared with that in the YRS group (Figure 1C–D). These results suggested that ORS promoted senescence of MSCs.
Effect of ORS on MSCs proliferation
The proliferation of MSCs was measured with an MTT assay. The results indicate that MSC proliferation is inhibited by the ORS culture, and the absorbance values in the ORS group were markedly decreased compared with that in the YRS group (P,
0.05, Figure 2).
Effects of ORS on MSCs survival
After treatment with YRS or ORS for 36 h, AO/EB staining was used to observe the apoptotic cells. The apoptotic cells had green or red-orange stained condensation nucleus. In the YRS group, no obvious apoptosis was observed, whereas a few apoptotic cells were observed in the ORS group. After treatment
with 100mmol/L H2O2for 1 h, apoptosis was still not obvious in
the YRS group, but in the ORS group, the number of apoptotic cells obviously increased (Figure 3A). The cell count shows that the apoptotic index in the ORS group after H2O2 treatment
(40.9%67.8%) was significantly higher than that in the YRS group (12.6%62.1%,P,0.01) or that in the ORS group without
H2O2treatment (8.2%61.5%,P,0.01) (Figure 3B). The results
indicated that the ORS could inhibite the survival of MSCs.
The expression ofb-catenin in the young or old rat MSCs
To identify the activity of Wnt/b-catenin signaling in MSCs of old rats, theb-catenin expression in the MSCs of young rats (12– 14 weeks old) and of old rats (64–68 weeks old) was examined by immunofluorescence. The disialoganglioside (GD2) is a new marker of MSCs and can express on primary MSCs, and the MSCs are the only cells that express this marker in bone marrow [33], so GD2 was used to mark primary MSCs. The results showed thatb-catenin expression clearly increased in the GD2–positive cells of the old rats compared with that of the young rats (Figure 4). The results in-dicated the Wnt/b-catenin signaling was elevated in old rat MSCs.
ORS promoted the nuclear accumulation ofb-catenin in MSCs
To investigate the effects of ORS on Wnt/b-catenin signaling, we examined the expression ofb-catenin in MSCs by immuno-fluorescence staining and western blot analysis. The expression of cytoplasmic and nuclear b-catenin increased in the ORS group compared with that in the YRS group, and the increase in nuclear
b-catenin expression was more pronounced in the ORS group. After treatment with 100 ng/mL DKK1, nuclear b-catenin expression markedly decreased (Figure 5). To further evaluate the effects of ORS on the nuclear translocation ofb-catenin, the expression of b-catenin was examined at different time points during the ORS culture. The results demonstrated that the nuclear translocation of b-catenin could be promoted by ORS (Supporting Information, Figure S1).
ORS reduced GSK-3bexpression in MSCs
GSK-3b is a key enzyme in negatively regulating Wnt/b -catenin signaling. The effect of ORS on Wnt/b-catenin signaling was further studied by determining GSK-3b expression. Com-pared with the YRS group, GSK-3b expression was evidently decreased in the ORS group (P,0.05). However, after treatment
with DKK1, GSK-3b expression was significantly increased (P,0.05, Figure 6).
ORS promoted c-myc expression in MSCs
To further examine the expression of target gene of Wnt/b -catenin signaling, we detected the expression of c-myc by RT-PCR. The expression of c-myc in the ORS group is significantly higher than that in the YRS group (P,0.01). After treatment with DKK1, c-myc expression was significantly decreased (P,0.01,
Figure 7). These data further indicated that the Wnt/b-catenin signaling could be activated by ORS.
Effects of Wnt/b-catenin signaling on MSCs senescence
To explore the effects of Wnt/b-catenin signaling on MSCs senescence, we examined cellular senescence after modulating Wnt/b-catenin signaling through SA-b-gal staining. To examine better the relationship between Wnt/b-catenin signaling and cellular senescence in the YRS group, different concentrations of Wnt 3a were added into the culture medium. The results suggest that only treatment with high Wnt 3a concentrations (100 ng/mL)
Figure 7. Effect of ORS on c-myc expression.(A) RT-PCR analysis of the expression of c-myc.b-Actin was used as an internal control. (B) Quantification of c-myc mRNA expression level. The expression of c-myc mRNA in the ORS group was markedly increased than that in the YRS group (*P,0.01). However, after treatment with DKK1 to inhibitor the Wnt/b-catenin signaling in ORS, the c-myc mRNA level was significantly decreased compared with that in the ORS groups (#
significantly increases the number of SA-b-gal–positive cells (Supporting Information, Figure S2). In the ORS group, siRNA that specifically silences b-catenin mRNA was designed and synthesized to inhibit intracellular Wnt/b-catenin signaling further (Supporting Information, Figure S3). The results show that after Wnt/b-catenin signaling was inhibited with DKK1 or si-b -catenin, the number of SA-b-gal–positive cells in the two groups (29.264.7 and 22.666.5) were significantly decreased compared with that in the ORS group (61.669.6,P,0.01) (Figure 8A–B).
ROS staining showed that after Wnt/b-catenin signaling was inhibited by DKK1 or si-b-catenin in ORS, the level of DCFH fluorescence in the MSCs clearly decreased (Figure 8C–D).
Effect of Wnt/b-catenin signaling on MSCs proliferation
MTT analysis shows that after treatment with DKK1 or si-b -catenin in ORS, the absorbance values of the two groups were significantly higher than those of the ORS group (P,0.05, Figure 9).
Effects of Wnt/b-catenin signaling on MSCs survival
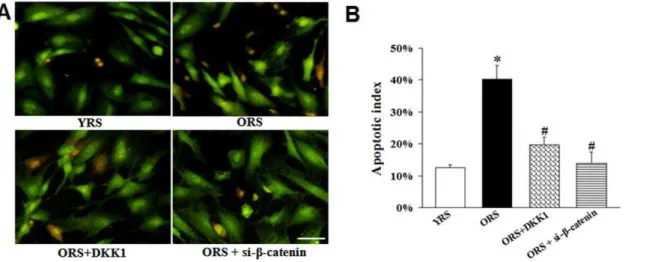
After Wnt/b-catenin signaling was inhibited with 100 ng/mL DKK1 or si-b-catenin in ORS, the number of apoptotic cells decreased (Figure 10A). The apoptotic indices in the ORS+DKK1 group (19.7%62.4%) and ORS + si-b-catenin group (12.3%6
2.5%) were significantly decreased compared with that in the ORS
Figure 8. Effect of Wnt/b-catenin signaling on MSC senescence.(A) SA-b-gal staining. After treatment with DKK1 and si-b-catenin in ORS, the number of SA-b-gal–positive cells decreased. Scale bar = 25mm. (B) Quantification of SA-b-gal–staining cells. The number of SA-b-gal–positive cells
significantly decreased in the ORS+DKK1 group and in the ORS+si-b-catenin group compared with that in the ORS group (#P,0.01). *P,0.01 versus the YRS group (n= 5).(C)ROS staining.Scale bar = 25mm. (D) Quantification of ROS level. The fluorescence intensity of DCFH was significantly
lower in the ORS+DKK1 group or ORS+si-b-catenin group compared with that in the ORS group (#
P,0.01). *P,0.01 versus YRS group (n= 3). doi:10.1371/journal.pone.0021397.g008
Figure 9. MSC proliferation curves.MTT assay showed there was no significant difference in the proliferation of cells within 1, 2, and 3 days. From days 5 to 7, the absorbance values in the ORS+DKK1 and
ORS+si-b-catenin groups were significantly higher compared with that in the ORS group (*P,0.05:n= 5).
doi:10.1371/journal.pone.0021397.g009
group (40.3%64.4%,P,0.01) (Figure 10B). The flow cytometry
analysis of Annexin V/PI staining also showed that the apoptotic index in the ORS group increased more than that in the YRS group. After treatment with DKK1 or si-b-catenin in ORS, the apoptotic index significantly decreased (Supporting Information, Figure S4).
Activated Wnt/b-catenin signaling induced DDR in MSC
To explore whether Wnt/b-catenin signaling have any effects on DDR, we examined the expression of c-H2A.X, a sensitive marker for the formation of DNA damage foci. The results suggest that compared with the YRS group, the number of c-H2A.X– positive cells and the c-H2A.X expression level were markedly increased in the ORS group. After treatment with DKK1 or si-b -catenin, the number ofc-H2A.X–positive cells and thec-H2A.X level markedly decreased (P,0.01, Figure 11A–C). A recent study
sug-gested that DDR induces cell aging by directly activating p16INK4a expression [28]. Therefore, we examined the expression of p16INK4aby RT-PCR. The RT-PCR results show that p16INK4aexpression was significantly increased in the ORS groups compared with that in the YRS groups. In the ORS+DKK1 group and the ORS+si-b-catenin group, p16INK4a expression clearly decreased (P,0.05 or P,0.01,
Figure 11D–E).
Activated Wnt/b-catenin signaling promoted expression of p53 and p21 in MSCs
To investigate the effects of Wnt/b-catenin signaling on the p53/p21 pathway, we first examined p53 expression through immunofluorescence and western blot analysis. In the YRS group, p53 expression was very weak, whereas the ORS group showed a clear increase in p53 expression. Compared with the ORS group, p53 expression was substantially inhibited in the ORS+DKK1 or ORS + si-b-catenin group (Figure 12A–C). The target gene of p53, p21, plays an important role in cell aging induced by p53. Therefore, we further tested the expression of p53 and p21 through RT-PCR. The results show that p53 and p21 expression were obviously increased in the ORS group compared with that in the YRS group (P,0.01, Figure 12D–F). However, after treatment
with DKK1 or si-b-catenin in ORS, p53 and p21 were signifi-cantly decreased compared with that in the ORS group (P,0.01,
Figure 12D–F).
Discussion
Increasing studies have demonstrated the importance of extrinsic cellular factors on the aging of adult stem cells. Aged mouse spermatogonial stem cells have been transplanted into young recipient hosts for over three years without any decline in function [34]. Serum from old mice markedly induces embryonic stem cell dysfunction [13]. However, the effects of the aged environment on MSC senescence and function have not yet been reported. In the present study, the young and the old systemic milieu were mimicked by adding 20% YRS and ORS into the culture medium respectively. The results show that the ORS culture clearly promoted senescence and ROS production in the MSCs compared with those cultured with YRS. The proliferation and survival ability of the MSCs were also significantly inhibited in the ORS group compared with that in the YS group. Therefore, ORS induces MSC senescence, as well as inhibit their prolifer-ation and survival ability.
Studies have demonstrated that some signaling pathways also have important effects on the cell senescence induced by an aged systemic environment [10,35,36]. Recent papers [17,20] have shown that Wnt/b-catenin signaling is elevated in aged tissue and in a mouse model of accelerated aging. This elevated Wnt/b -catenin signaling may contribute to cell senescence. Our study shows thatb-catenin expression increases in primary MSCs of old rat. ORS treatment promotes the nuclear accumulation of b -catenin in young rat MSCs, which is inhibited by DKK1. These results indicate that the Wnt/b-catenin signaling in MSCs can be activated by the aged system enviroment and the presence of soluble factors in ORS that mediate the activity of Wnt/b-catenin signaling. Research by Binet has shown that senescent cells secrete more Wnt 16 b, a member of the Wnt family of secreted proteins [37]. However, whether Wnt 16 b is the activator of Wnt/b -catenin signaling in ORS or some other ‘‘Wnt-like substance’’ requires further verification. To explore further the relationship between MSC senescence and the activity of Wnt/b-catenin signaling, we examined the changes in the MSCs by modulating Wnt/b-catenin signaling. In the YRS group, only excessive Wnt/
b-catenin signaling activation could induce MSC senescence. In the ORS group, after treatment with DKK1 or si-b-catenin, the number of SA-b-gal–positive cells was significantly decreased, and the proliferation and survival ability were evidently enhanced.
Figure 10. Effects of Wnt/b-catenin signaling on survival and apoptosis of MSCs.(A) AO/EB staining. In the ORS+DKK1 and ORS+si-b
-catenin group, the number of apoptotic or necrotic cells decreased. Scale bar = 25mm. (B) The apoptotic index of the MSCs. The apoptotic indices of the
Taken together, activated Wnt/b-catenin signaling is an important mediator of MSC aging induced by ORS.
Based on these results, we explored the mechanisms of Wnt/b -catenin signaling on MSC aging. DDR may induce cell senescence [38]. Recent data have shown that DDR can be found in almost all of the organs of aged mice [39]. The DDR induces cell senescence through the p16INK4agene [27,28] or the p53/p21 pathway [40,41]. However, whether activated Wnt/b-catenin signaling promotes
cellular senescence through the DDR and p53/p21 pathway remains unclear. In the present study, a clear increase inc-H2A.X, p16INK4a, p53, and p21 expression was observed in the ORS group compared with that in the YRS group. After the 100 ng/mL DKK1 and si-b -catenin treatment, the expression ofc-H2A.X, p16INK4a, p53, and p21 were substantially decreased. These results imply that the activation of Wnt/b-catenin signaling induces MSC aging though the DDR and p53/p21 pathways. One recent published report has also
Figure 11. Effects of Wnt/b-catenin signaling onc-H2A.X and p16INK4aexpression.(A) Immunofluorescence staining ofc-H2A.X. The expression ofc-H2A.X was hardly detected in the YRS group, whereas the number ofc-H2A.X–positive cells andc-H2A.X expression level were markedly increased in the ORS group. In the ORS+DKK1 and ORS +si-b-catenin groups, the number ofc-H2A.X–positive cells andc-H2A.X
expression levels were clearly decreased. The pictures on the right are magnified images of the white box.c-H2A.X expression is indicated by a stippled appearance in the nucleus. Green,c-H2A.X; blue, DAPI. Scale bar = 25mm. (B) Western blot analysis ofc-H2A.X expression.b-Actin was used
as the internal control. (C) Quantification ofc-H2A.X protein expression levels.c-H2A.X expression was significantly increased in the ORS groups compared with that in the YRS groups (**P,0.01). After treatment with DKK1 or si-b-catenin in ORS,c-H2A.X expression was markedly decreased compared with the ORS group (##
P,0.01; n= 5). (D) RT-PCR analysis of p16INK4a expression. b-Actin was used as the internal control. (E)
Quantification of p16INK4amRNA expression level. p16INK4aexpression in the ORS group markedly increased compared with that in the YRS group (**P,0.01). However, in the ORS+DKK1 and the ORS+si-b-catenin groups, the p16INK4amRNA levels were significantly decreased compared with the
ORS groups (#
P,0.05 or# #
P,0.01;n= 5). doi:10.1371/journal.pone.0021397.g011
shown that the consequences of persistent Wnt1-induced epithelial cell senescence and progressive hair loss in transgenic mice. The number ofc-H2A.X–positive cells increased in the hair follicles [42]. The activated c-myc, a target gene of Wnt/b-catenin signaling, induces cellular senescence by promoting p16INK4aexpression [43], which is consistent with the results of the present study. Therefore, there is a correlation between Wnt/b-catenin signaling and the DDR
and p53/p21 pathway, which are potential molecular targets for delaying stem cell aging in aged systemic milieus.
In conclusion, ORS can induce the senescence of adult MSCs, as well as inhibit their proliferation and survival. Wnt/b-catenin signaling plays a critical role in the aging of MSCs induced by ORS. The DNA damage response and p53/p21 pathway may be the main mediators of MSC aging induced by excessive Wnt/
Figure 12. Effects of Wnt/b-catenin signaling on p53 and p21 expression.(A) Immunofluorescence staining of p53. p53 expression was hardly detected in the YRS group, whereas the ORS group showed an obvious increase in p53 expression. p53 expression was decreased after treatment with DKK1 or si-b-catenin to inhibit Wnt/b-catenin signaling. Green, p53; blue, DAPI. Scale bar = 25mm. (B) Western blot analysis of p53
protein expression.b-Actin was used as the internal control. (C) Quantification of p53 protein levels. The p53 expression level was clearly higher in the ORS group than that in the YRS group (*P,0.01). In the ORS+DKK1 and ORS+si-b-catenin groups, the p53 expression level was evidently lower than in the ORS group (#
P,0.01;n= 5). (D) The expression of p53 and p21 were assessed using RT-PCR.b-Actin was used as the internal control. (E) Quantification of p53 and p21 mRNA level, normalized withb-actin mRNA level. The results show there was a clear upregulation of p53 and p21 mRNA expression in the ORS group compared with that in the YRS group (*P,0.01). After treatment with DKK1 or si-b-catenin to inhibit Wnt/b -catenin signaling in ORS, p53 and p21 expression was significantly decreased compared with that in the ORS group (#
b-catenin signaling. Further deciphering the mechanisms of Wnt/
b-catenin signaling involved in stem cell aging will help improve transplantation efficacy of stem cells for older persons.
Supporting Information
Figure S1 Effect of ORS on b-catenin expression at different time points.(A) Immunofluorescence staining ofb -catenin. Cytoplasmicb-catenin expression after culturing with ORS for 12 h was obviously increased compared with that in the cells cultured with ORS for 0 h. When the cells were cultured with ORS for 24 h, the expression of cytoplasmb-catenin decreased and the expression of nucleusb-catenin increased. After culturing with ORS for 36 h, the expression of nucleus b-catenin further increased. Scale bar = 25mm. (B) Western blot analysis of cytoplasmic and nuclear b-catenin. b-Actin was used as the internal control for cytoplasmic proteins, whereas b-tubulin was used as the internal control for nuclear proteins. (C) Quantification of cytoplasmic and nuclearb-catenin protein levels. Compared with those cultured with ORS for 0 h, an obvious increase inb-catenin protein level was detected in the cytoplasm (*P,0.01) of MSCs cultured from 12 h to
36 h. However, after culturing for 36 h, the cytoplasmb-catenin protein level significantly decreased compared with that in the MSCs cultured for 12 h (#P,0.05). The nuclearb-catenin protein
level gradually increased in the cells cultured with ORS from 0 to 36 h.$P,0.05 versus 0 h,$$P,0.01 versus 0 h,{P,0.01 versus
12 h,1P,0.05 versus 24 h,n= 4.
(TIF)
Figure S2 Effects of different concentrations of Wnt 3a on MSC senescence.(A) SA-b-gal staining. Similar to the YRS group, after stimulation with 10 or 50 ng/mL Wnt 3a (R&D Systems, USA) in YRS for 36 h, only a small number of SA-b-gal– positive cells were observed. However, in the YRS+100 ng/mL Wnt 3a group, the number of SA-b-gal–positive cells obviously increased. Scale bar = 25mm. (B) Quantification of SA-b-gal–
positive cells. The number of SA-b-gal–positive cells was not significantly increase in the YRS+10 ng/mL Wnt 3a and the YRS
+50 ng/mL Wnt 3a groups compared with that in the YRS group (22.465.5 or 24.668.7 vs. 20.864.2.P . 0.1). However in the
YRS +100 ng/mL Wnt 3a group, the number of SA-b-gal– positive cells (56.2612.1) was significantly increased compared with that in the YRS group (*P,0.01).n= 5.
(TIF)
Figure S3 Detection of si-b-catenin transfection efficien-cy.(A) Up to 500 ng of FAM-labeled NC-siRNA was transfected into the MSCs for 12 h. Transfection efficiency was detected through phase-contrast and fluorescence microscopy. The results showed that siRNA had entered the cells. Scale bar = 25mm. (B)
Flow cytometry was also employed to detect the transfection efficiency of siRNA. The results were analyzed with Win MDI29 software, which indicated that siRNA transfection efficiency in
MSCs was 88.63%. (C) RT-PCR analysis ofb-catenin expression for screening the effective siRNA fragment. Three siRNA oligo-nucleotide targets were designed and synthesized to silence b -catenin (si-b-catenin1: 59-GCTGACCAAACTGCTAAAT-39;
si-b-catenin2: 59-CACCTCCCAAGTCCTTTA T-39; si-b-catenin3: 59-GCACCATGCAGAATACAAA-39). MSCs were incubated with the control siRNA and three si-b-catenin for 12 h. The MSCs were further exposed to ORS for 12 h.b-catenin mRNA expression was examined by RT-PCR. The results show thatb -catenin mRNA expression is significantly inhibited by si-b -catenin2 and si-b-catenin3. b-Actin was used as the internal control. The methods for RNA extraction and RT-PCR were the same as described in the Materials and Methods section. b -CateninFwd (59-ACAGCACCTTCAGCACTCT-39) andb -cate-ninRev (59-AAGTTCTTGGCTATTACGACA-39). (D) Western blot analysis of b-catenin expression for screening the effective siRNA fragment. After transfection with si-b-catenin for 48 h, the totalb-catenin levels were assessed through western blot analysis.
b-Actinoligonucleotide was used as the internal control. For the whole-cell extracts, the expression ofb-catenin protein is signifi-cantly inhibited by si-b-catenin2 and si-b-catenin3. The si-b -ca-tenin2 had a more efficient silencing effect. Thus, the si-b-catenin used in the present study was si-b-catenin2. (E) Immunofluores-cence staining ofb-catenin. After transfected with si-b-catenin for 48 h, MSCs were fixed with formaldehyde, stained forb-catenin (red) and DAPI (blue), and observed through fluorescence micro-scopy. The results show thatb-catenin expression was significantly decreased after si-b-catenin (si-b-catenin2) transfection in MSCs. Scale bar = 25mm.
(TIF)
Figure S4 Flow cytometry analysis of apoptotic cells stained with Annexin V and PI.(A) Representative graphs of flow cytometry analysis. To further examine the apoptosis, the apoptotic cells were determined using an Annexin V/PI apoptosis detection kit (Sigma, USA) for flow cytometry (Calibur, BD Biosciences, USA), according to the manufacturer’s instructions. Up to 26104cells for each sample were analyzed using CellQuest software. Every experiment was performed in quadruplicate. (B) The apoptotic index of different groups according to annexin V/ PI staining. The apoptotic index clearly increased in the ORS group compared with that in the YRS group (*P,0.01). However,
after treatment with DKK1 or si-b-catenin in ORS to inhibit Wnt/b-catenin signaling, the apoptotic index significantly de-creased (#P,0.01).n= 4.
(TIF)
Author Contributions
Conceived and designed the experiments: Y-ZT D-YZ. Performed the experiments: D-YZ H-JW. Analyzed the data: H-JW D-YZ. Wrote the paper: D-YZ Y-ZT H-JW.
References
1. Wallenfang MR (2007) Aging within the Stem Cell niche. Dev Cell 13: 603–604. 2. Purpura KA, Aubin JE, Zandstra PW (2004) Sustained in vitro expansion of
bone progenitors is cell density dependent. Stem Cells 22: 39–50.
3. Guo HD, Wang HJ, Tan YZ, Wu JH (2011) Transplantation of marrow-derived cardiac stem cells carried in fibrin improves cardiac function after myocardial infarction. Tissue Eng Part A 17: 45–58.
4. Krampera M, Franchini M, Pizzolo G, Aprili G (2007) Mesenchymal stem cells: from biology to clinical use. Blood Transfus 5: 120–129.
5. Sethe S, Scutt A, Stolzing A (2006) Aging of mesenchymal stem cells. Ageing Res Rev 5: 91–116.
6. Wagner W, Bork S, Lepperdinger G, Joussen S, Ma N, et al. (2010) How to track cellular aging of mesenchymal stromal cells? Aging (Albany NY) 2: 224–230.
7. Zhang H, Fazel S, Tian H, Mickle DA, Weisel RD, et al. (2005) Increasing donor age adversely impacts beneficial effects of bone marrow but not smooth muscle myocardial cell therapy. Am J Physiol Heart Circ Physiol 289: 2089–2096.
8. Kretlow JD, Jin YQ, Liu W, Zhang WJ, Hong TH, et al. (2008) Donor age and cell passage affects differentiation potential of murine bone marrow derived stem cells. BMC Cell Biol 9: 60.
9. Kyriakou C, Rabin N, Pizzey A, Nathwani A, Yong K (2008) Factors that influence short-term homing of human bone marrow-derived mesenchymal stem cells in a xenogeneic animal model. Haematologica 93: 1457–1465. 10. Conboy IM, Conboy MJ, Smythe GM, Rando TA (2003) Notch-mediated
11. Conboy IM, Conboy MJ, Wagers AJ, Girma ER, Weissman IL, et al. (2005) Rejuvenation of aged progenitor cells by exposure to a young systemic environment. Nature 433: 760–764.
12. Pan L, Chen S, Weng C, Call G, Zhu D, et al. (2007) Stem cell aging is controlled both intrinsically and extrinsically in the Drosophila ovary. Cell Stem Cell 1: 458–469.
13. Carlson ME, Conboy IM (2007) Loss of stem cell regenerative capacity within aged niches. Aging Cell 6: 371–382.
14. Mayack SR, Shadrach JL, Kim FS, Wagers AJ (2010) Systemic signals regulate ageing and rejuvenation of blood stem cell niches. Nature 463: 495–500. 15. Rando TA (2006) Stem cells, ageing and the quest for immortality. Nature 441:
1080–1086.
16. Snoeck HW (2005) Serum of youth. Nat Biotechnol 23: 434–435.
17. Brack AS, Conboy MJ, Roy S, Lee M, Kuo CJ, et al. (2007) Increased Wnt signaling during aging alters muscle stem cell fate and increases fibrosis. Science 317: 807–810.
18. Clevers H (2006) Wnt/beta-catenin signaling in development and disease. Cell 127: 469–480.
19. Reya T, Clevers H (2005) Wnt signalling in stem cells and cancer. Nature 434: 843–850.
20. Liu H, Fergusson MM, Castilho RM, Liu J, Cao L, et al. (2007) Augmented Wnt signaling in a mammalian model of accelerated aging. Science 317: 803–806. 21. Scheller M, Huelsken J, Rosenbauer F, Taketo MM, Birchmeier W, et al. (2006)
Hematopoietic stem cell and multilineage defects generated by constitutive beta-catenin activation. Nat Immunol 7: 1037–1047.
22. Kirstetter P, Anderson K, Porse BT, Jacobsen SE, Nerlov C (2006) Activation of the canonical Wnt pathway leads to loss of hematopoietic stem cell repopulation and multilineage differentiation block. Nat Immunol 7: 1048–1056. 23. Damalas A, Kahan S, Shtutman M, Ben-Ze’ev A, Oren M (2001) Deregulated
beta-catenin induces a p53- and ARF-dependent growth arrest and cooperates with Ras in transformation. EMBO J 20: 4912–4922.
24. Xu M, Yu Q, Subrahmanyam R, Difilippantonio MJ, Ried T, et al. (2008) Beta-catenin expression results in p53-independent DNA damage and oncogene-induced senescence in prelymphomagenic thymocytes in vivo. Mol Cell Biol 28: 1713–1723.
25. Mao CD, Hoang P, DiCorleto PE (2001) Lithium inhibits cell cycle progression and induces stabilization of p53 in bovine aortic endothelial cells. J Biol Chem 276: 26180–26188.
26. Marchand A, Atassi F, Gaaya A, Leprince P, Le Feuvre C, et al. (2011) The Wnt/beta-catenin pathway is activated during advanced arterial aging in humans. Aging Cell 10: 220–232.
27. Collins CJ, Sedivy JM (2003) Involvement of the INK4a/Arf gene locus in senescence. Aging cell 2: 145–150.
28. Kosar M, Bartkova J, Hubackova S, Hodny Z, Lukas J, et al. (2011) Senescence-associated heterochromatin foci are dispensable for cellular senescence, occur in
a cell type- and insult-dependent manner and follow expression of p16 (ink4a). Cell Cycle 10: 457–468.
29. Ca´nepa ET, Scassa ME, Ceruti JM, Marazita MC, Carcagno AL, et al. (2007) INK4 proteins, a family of mammalian CDK inhibitors with novel biological functions. IUBMB Life 59: 419–426.
30. Janzen V, Forkert R, Fleming HE, Saito Y, Waring MT, et al. (2006) Stem-cell ageing modified by the cyclin-dependent kinase inhibitor p16INK4a. Nature 443: 421–426.
31. Ju Z, Choudhury AR, Rudolph KL (2007) A dual role of p21 in stem cell aging. Ann N Y Acad Sci 1100: 333–344.
32. Kiechle FL, Malinski T (1993) Nitic oxide: biochemistry, pathophysiology, and detection. Am J Clin Pathol 100: 567–575.
33. Martinez C, Hofmann TJ, Marino R, Dominici M, Horwitz EM (2007) Human bone marrow mesenchymal stromal cells express the neural ganglioside GD2: a novel surface marker for the identification of MSCs. Blood 109: 4245–4248. 34. Ryu BY, Orwig KE, Oatley JM, Avarbock MR, Brinster RL (2006) Effects of
aging and niche microenvironment ospermatogonial stem cell self-renewal. Stem Cells 24: 1505–1511.
35. Morrison SJ, Spradling AC (2008) Stem cells and niches: mechanisms that promote stem cell maintenance throughout life. Cell 132: 598–611. 36. Luo S, Kleemann GA, Ashraf JM, Shaw WM, Murphy CT (2010) TGF-band
insulin signaling regulate reproductive aging via oocyte and germline quality maintenance. Cell 143: 299–312.
37. Binet R, Ythier D, Robles AI, Collado M, Larrieu D, et al. (2009) WNT16B is a new marker of cellular senescence that regulates p53 activity and the phosphoinositide 3-kinase/AKT pathway. Cancer Res 69: 9183–9191. 38. Seoane M, Iglesias P, Gonzalez T, Dominguez F, Fraga M, et al. (2008)
Retinoblastoma loss modulates DNA damage response favoring tumor progression. PLoS One 3: e3632.
39. Wang C, Jurk D, Maddick M, Nelson G, Martin-Ruiz C, et al. (2009) DNA damage response and cellular senescence in tissues of aging mice. Aging Cell 8: 311–323.
40. Bakkenist CJ, Drissi R, Wu J, Kastan MB, Dome JS (2004) Disappearance of the telomere dysfunction-induced stress response in fully senescent cells. Cancer Res 64: 3748–3752.
41. Ja¨a¨maa S, Af Ha¨llstro¨m TM, Sankila A, Rantanen V, Koistinen H, et al. (2010) DNA damage recognition via activated ATM and p53 pathway in nonprolifer-ating human prostate tissue. Cancer Res 70: 8630–8641.
42. Castilho RM, Squarize CH, Chodosh LA, Williams BO, Gutkind JS (2009) mTOR mediates Wnt-induced epidermal stem cell exhaustion and aging. Cell Stem Cell 5: 279–289.