Cost and proit Analysis of Organic and
Conventional Farming in Hungary
Ökológiai és konvencionális gazdálkodás
költség-jövedelem elemzése Magyarországon
Péter URFI1, Krisztina KORMOSNÉ KOCH2, Zsuzsanna BACSI1
1University of Pannonia, Georgikon Faculty, Department of Economic Methodology; H-8360 Keszthely,
Deák F. u. 16. [email protected]
2University of Debrecen, Centre of Agricultural and Applied Economics Sciences, Faculty for Rural
Development and Applied Economics, Institute of Rural Development and Functional Economics
ABSTRACT
The object of this analysis was to compare the organic and the conventional farming on the basis of primer database and modeling at the location of Hortobágy that is a well-known organic farming region in Hungary. 20 model variations were worked out for the conventional and 20 for the organic farming situation. According to the results, there is no signiicant difference considering the costs per hectare in the two modeled farming methods, although the structures of the production costs show huge
deviations. The cost per production unit is typically higher in the organic model. Considering most of the model variations, organic farming is proved to be more proitable, but this economic pre-eminence is not explicit by any means.
KEYWORDS: organic farming, conventional farming, cost and proit analysis
ÖSSZEFOGLALÁS
Elemző munkánk célja az volt, hogy a Hortobágy térségében végzett, primer
adatgyűjtésen alapuló modellezés segítségével összehasonlítsuk az ökológiai és a konvencionális gazdálkodást. Összesen húsz-húsz modelvariációt dolgoztunk ki a két gazdálkodási módra. Eredményeink alapján nincs jelentős különbség a két gazdálkodási mód között az egy hektárra jutó termelési költségben, ugyanakkor a termelési költség szerkezete jelentős eltérést mutat. Az ökológiai gazdálkodásban az önköltség általában magasabb. A legtöbb modellvariációban az ökológiai
gazdálkodás jövedelmezőbbnek bizonyult, de ez a gazdasági előnye nem egyértelmű.
DETAILED ABSTRACT
Vizsgálataink célja az volt, hogy az ökológiai és a hagyományosnak tekinthető, kemikáliát, műtrágyát is felhasználó (konvencionális) gazdálkodást termelői
adatgyűjtésre alapozott modellszámítások alapján összehasonlítsuk. Adatgyűjtésünk a Hortobágy – Faluvéghalma – Ohat – Újszentmargita települések által körülölelt területen történt, ennek termelési adottságait, gazdálkodási gyakorlatát,
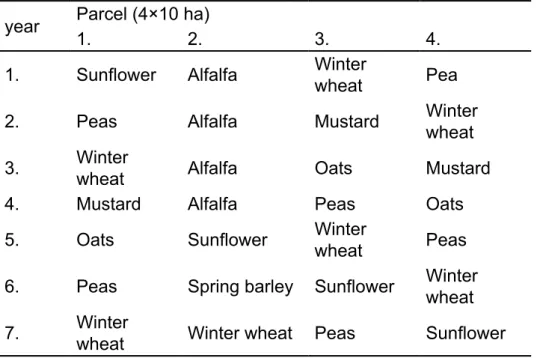
vetésszerkezetét (1. táblázat) vettük igyelembe a modellezéskor. Az egyes
modellváltozatok összehasonlítása – a technológiák, hozamok és árak mellett – kiterjedt a vállalkozó munkadíját nem tartalmazó költségekre, az önköltségre, a támogatásokra, valamint a bruttó jövedelemre. Az egy hektárra jutó költségek összegében a két gazdálkodási mód között jelentős eltérések nem alakultak ki (2. táblázat), a költségek szerkezete azonban markáns különbségeket mutatott (1. ábra),
amely a két gazdálkodási mód technológiai eltéréseivel magyarázható. A növénytermesztés valamennyi vizsgált ágazata esetében magasabb önköltség mutatkozott az ökológiai gazdálkodásban (3. táblázat), viszont a juhtartás esetében
ez a gazdasági hátrány elmaradt. Az összefogott és szervezett, elsősorban exportpiacokon történő termékértékesítésnek köszönhetően, az ökológiai gazdálkodásban realizálható magasabb termékár általában ellensúlyozta a konvencionális gazdálkodásban elérhető magasabb hozamokat, de egyes évek hozam- és áradatai mellett fordított helyzet is kialakulhat. A modellváltozatok többségében, a támogatási szinteket is igyelembe véve (4. táblázat), az ökológiai
gazdálkodás összességében jövedelmezőbbnek bizonyult, bár ez a gazdasági fölény a vizsgált tényezők változásától jelentős mértékben függ (1. melléklet).
INTRODUCTION
Organic farming in Hungary, following the Western-European “green” trends of the past 15 years, developed dynamically from the mid 1980s ( [2] ) till 2004. Then, the size of organic land and the number of organic farmers turned to decrease ( [4,11]). To understand this phenomenon, analytical studies on cost and proit conditions, comparing organic farming with the other, basically conventional one, would be essential.
Only few studies can be found on sector-speciic cost and proit analyses of organic farming in Hungary, and analyses on the comp arison of organic and conventional farming methods are even less common.
MATERIALS AND METHODS
During primary data collection special emphasis was put on the fact that the modeled farms should have same features in production sites and farming conditions. Data collection was done in the area of Hortobágy, at Faluvéghalma, Ohat and
Újszentmargita settlements. Private farms dealing with arable farming and animal husbandry were considered as basic population for the sample of the present analysis. Typical arable crops in the area include winter wheat, spring barley, rye, sorghum, sunlower, rape, peas and alfalfa. Animal breeding concentrates mainly on ewe and cattle breeds; fodder-based animal husbandry is not signiicant. The data collection was carried out by asking producers to ill in a datasheet. Beside the general characteristics of farming data collection focused on technologies,
purchases and sales, asset supply and information on overhead costs. Altogether 28 producers illed in the datasheet, of which 22 were appropriate for evaluation. On the basis of professional considerations, 4 typical ecological farms and 4 typical
conventional ones were selected with the following aspects: the production structure is similar in the farms, their production standards are acknowledged by local experts and the ecological farms are farms already converted to organic technologies.
The average farm size of the organic sample is 58 hectares. Beside winter wheat (30%) and sunlower (18%), alfalfa, barley, oat, pea and mustard are continuously present in the crop structure. Two farmers of the four keep Hungarian merino on grassland in 0,4 livestock unit density. The average farm size of the conventional sample is 76 hectares. Beside winter wheat (55%), sunlower (20%), barley, mustard are present in a great proportion in the crop structure. Three of the conventional farms deal with conventional sheep husbandry. Every farm in the sample bases its operation on family labour, but hire external labour for certain seasonal works (e.g. sheep shearing).
Data were evaluated in a detailed way, the most common practices were taken into consideration relating to characteristics of farms as well as technological processes (e.g. machinery connections of ield operations), and in the case of data to be averaged (e.g. yields) the weighted arithmetical mean was calculated. The models created were built on these features. When compiling the model, the principle ceteris paribus was followed to the greatest degree; the two-farm model contains differences which are only compulsory consequences of the different farming methods
(technologies, prices, subsidies, extra costs of controlled production etc.).
Crown-value being 4) the average number of ewes is 50 animals (with milking lambs being sold). The crop rotation recurring in 8 years is the same in the two models. As the structures of the produced crops are different in certain years (Table 1), and these inluence the revenues and the costs, the models were developed for seven years in accordance with the seven-year-cycle of the crop rotation in a way, that prices and subsidies of sample farms, based on the data collected from producers, were considered the same within one model variety. This arrangement facilitated the analysis of a seven-year-period assuming the same price and subsidy conditions.
To determine the sum of the subsidies, the year of 2007 was chosen; but this year was not a usual year considering the yields and prices, so we created 4 organic and 4 conventional model variations based on yields and prices of different years in the following way:
A: average yields of the years of 2005 to 2007, prices of the year of 2007; B: yields and prices of the year of 2006; C: yields and prices of the year of 2007; D: yields and prices of the year of 2008.
The model variations are identiied with letters. The irst one refers to the farming method (O = organic; C = conventional), the second one (A, B, C, D) refers to the model variation based on the yields and prices. For example „OD” refers to the organic model based on the yields and prices of the year of 2008.
Each of the model variations was calculated on 5 subsidy levels, so the total amount of the model variations is 20 for the organic and 20 for the conventional farming. The ive subsidy levels are the following:
Table 1. Crop rotation and annual cropping structures in the model
year Parcel (4×10 ha)
1. 2. 3. 4.
1. Sunlower Alfalfa Winter
wheat Pea
2. Peas Alfalfa Mustard Winter
wheat
3. Winter
wheat Alfalfa Oats Mustard
4. Mustard Alfalfa Peas Oats
5. Oats Sunlower Winter
wheat Peas
6. Peas Spring barley Sunlower Winter
wheat
7. Winter
I. No subsidy;
II. SAPS plus national TOP-UP level;
III. SAPS plus national TOP-UP level plus LFA;
IV. SAPS plus national TOP-UP plus the subsidies of the Agri-environmental Program:
• in the conventional model, the basic-level programs for the arable land and grassland.
• in the organic model, the organic arable land and the organic grassland programs.
V. SAPS plus national TOP-UP plus the subsidies of LFA plus the subsidies of the already listed Agri-environmental Programs:
Beside yields, prices, the technologies the 20-20 model varieties were compared from the aspect of non-labour costs (all costs without the wages due to the entrepreneur, but containing the cost of the required external labour), non-labour production cost per unit (area or animal), subsidies as well as gross proit (including the wage due to the entrepreneur). The gross proit was calculated as the revenue containing subsidies minus non-labour costs (including overhead costs). The deviations of gross proit were divided among the effects of ive factors by chain substitution, in the following way: the starting point in every model variety was the gross proit in the conventional farm, and then the data of factors inluencing the gross proit of the conventional farm were substituted by the relevant data of the ecological farms step by step. The Five Factors considered were:
C: Capacity – number of ewes (item), ield size (hectare). These are the same at
each subsidy levels, except for subsidy levels IV and V, due to the AEM national rules that require a given size of “organic compensational territory” in the case of organic arable land AEM program, and because of this, grass boundaries of 8 percentages of the parcels were calculated in the organic farming model.
Y: Yield (amount of products per ewe or hectare, in natural measurement units).
CU: Cost per production unit, deined as direct plus overhead costs minus labor costs (HUF/kg, HUF/t).
P: Market price (HUF/kg, HUF/t).
Then gross proit (GP) is computed in the following way:
GP = (CÍYÍP)+(CÍS)-(CÍYÍCU)
The applied calculations are exactly the same as those in most of the relevant analytical methodology literature (for example 7, 8 ) the only difference is that our data cover more than one product or one year, so the calculations are applied for the period of 7 years of the crop rotation, while the product is the sum of the outputs of the individual years . It must be mentioned that this process requires an
uncomparable amount of calculations.
RESULTS AND DISCUSSION
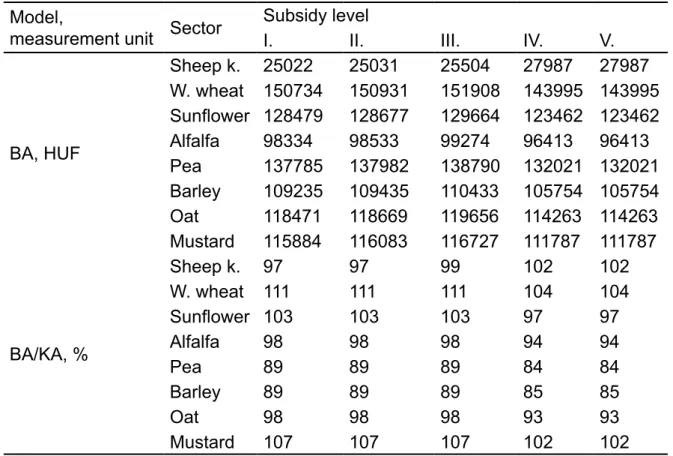
Taking the costs per ewe or hectare into consideration, there are no signiicant differences between the two modeled farming methods (Table 2). An advantage of more than 10 % for conventional farming is found only in winter wheat production at the irst three subsidy levels. The most remarkable cost differences are shown in pea and barley production to the advantage of organic farming; however, these
differences do not exceed 15-16 percentages at any of the subsidy levels.
In winter wheat production, material costs per hectare are the same in the two modeled farming methods, because the costs of chemicals and artiicial fertilizers in
Table 2. Costs per ewe or hectare in Model BA
Model,
measurement unit Sector
Subsidy level
I. II. III. IV. V.
BA, HUF
Sheep k. 25022 25031 25504 27987 27987
W. wheat 150734 150931 151908 143995 143995 Sunlower 128479 128677 129664 123462 123462
Alfalfa 98334 98533 99274 96413 96413
Pea 137785 137982 138790 132021 132021
Barley 109235 109435 110433 105754 105754
Oat 118471 118669 119656 114263 114263
Mustard 115884 116083 116727 111787 111787
BA/KA, %
Sheep k. 97 97 99 102 102
W. wheat 111 111 111 104 104
Sunlower 103 103 103 97 97
Alfalfa 98 98 98 94 94
Pea 89 89 89 84 84
Barley 89 89 89 85 85
Oat 98 98 98 93 93
conventional farming are balanced with the costs of soil and plant conditioning materials in organic farming as well as the more expensive organic seed used in the latter one. The extra costs of organic winter wheat production is basically caused by the extra machinery costs that are partly covered by the more precise seedbed preparation and partly by the mechanical weed control. In the case of conventional barley production, the extra cost is largely explained by the higher level of material costs (costs of fertilizers and chemicals). The cost per hectare of pea silage in conventional farming is higher because of the extra material costs (fertilizer, larger amounts of bale-net due to higher yield levels ) and extra machinery costs
(fertilization, extra baling).
However, there are no signiicant differences in costs per ewe and hectare
considering the two farming methods while there are excessive differences in cost structures and costs per production unit. Figure 1 focuses on the effects of
tehnological differences for the production costs in the case of barley production. It is clear that the soil preparation cost is higher in organic farming due to the more
precise seedbed preparation. In conventional farming, the higher level of fertilization costs is explained by the use of chemical fertilizers, while the higher level of plant conditioning costs is due to the different type of chemicals used. The differences in costs displayed in Figure 1 cannot be taken common or typical. For example, in winter wheat production it was already discussed that the costs of chemical fertilizers and other chemicals can be balanced with the mechanical weed control and the application of permitted soil and plant condition materials.
Figure 1. Costs per hectare in barley production (Models BA and KA)
0 5000 10000 15000 20000 25000
soil preparation
fertilization
sowing
plant conditioning
harvesting proharvesting field works
transport seed cleaning
other cost
conventional farming
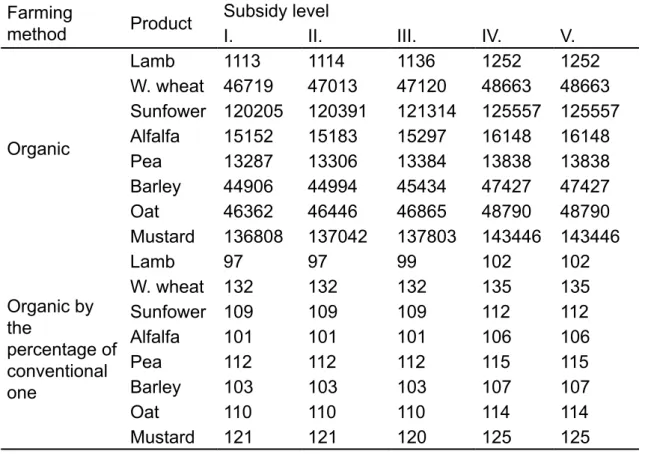
Table 3 summarizes and compares the average costs per production units of the conventional and the organic models A to D. It seems to be obvious that all the organic products have a high level of cost per production unit, and this is evidently cannot be explain by the organic farming method itself, but it is also a result of poor natural resources, soil conditions, and farming size.
There is no signiicant difference in the production costs per ewe considering the two analyzed production methods, and this is what can be expected, because of the similar production technologies. Taking the cultivation into consideration, the cost per unit of each of the crops is higher in organic farming. The most remarkable difference appears for the winter wheat (32-35%), however, the “extra organic price” is also the highest for this crop. According to these results, it seems possible to meet the higher level of costs per hectare (good quality of seeds, seedbed preparation, mechanical weed control, and soil and crop condition materials) even with relatively low level of yields achieved. There is also a signiicant difference (20-25%) in the case of
mustard, where the costs per hectare are higher by only a few percentages in organic farming, but the yield per hectare is much lower. In pea silage production, the cost per production unit is higher by 12-15 percentages in organic farming, and this
relects the fact that the more than 20-percentage yield loss overcompensates for the 10-15-percentage lower costs per hectare.
Table 3. Cost per production unit minus labor cost at the average of models A - D me.unit: HUF/kg for lamb, HUF/t for crops
Farming
method Product
Subsidy level
I. II. III. IV. V.
Organic
Lamb 1113 1114 1136 1252 1252
W. wheat 46719 47013 47120 48663 48663
Sunfower 120205 120391 121314 125557 125557
Alfalfa 15152 15183 15297 16148 16148
Pea 13287 13306 13384 13838 13838
Barley 44906 44994 45434 47427 47427
Oat 46362 46446 46865 48790 48790
Mustard 136808 137042 137803 143446 143446
Organic by the
percentage of conventional one
Lamb 97 97 99 102 102
W. wheat 132 132 132 135 135
Sunfower 109 109 109 112 112
Alfalfa 101 101 101 106 106
Pea 112 112 112 115 115
Barley 103 103 103 107 107
Oat 110 110 110 114 114
Table 4 identiies the signiicance of subsidies in both of the models. According to data in Annex 1 none of the farming methods seems to be viable without subsidies. In models BA and BC, the gross proit is positive even without subsidies, but still quite low, not even covering the minimum wage of the agricultural entrepreneur. The ratio of subsidies in the total income of the entrepreneur is 24 to 30 percentages even at the lowest subsidy levels, and it is as high as about 50 percentages at the highest subsidy level. The variations in gross proit cannot mainly be explained by the subsidy system.
The summarizing table of chain substitution analysis (Annex 1) relects that variations in capacities and subsidies explain only a small part of the differences in gross
proits, and only at subsidy levels IV and V. Note that at these subsidy levels there are smaller ield sizes (because of the already mentioned grass boundary) and a difference in subsidy amounts (“basic level” AEM program for conventional, organic AEM program for organic model). The positive values in the “capacity” column show that the decrease of ield size results in the increase of gross proit, with costs per production unit higher than market price (ceteris paribus).
Most of the differences in gross proit are the results of the differences in product amount per hectare, the cost per product unit and the market prices. As it was explained earlier, there are no signiicant differences considering the costs per hectare between the modeled farms, the variations in costs per production units are mainly the results of differences in yields. So the variations in gross proit are
basically inluenced by the conventional “extra yield” and the organic “extra price”. It can be seen that the effect of organic “extra price” was stronger in models “A”, “B” and “C”, and, on the other hand, in model “D”, using yields and prices of the year 2008, the “extra price” cannot balance the disadvantages in yields and costs per production unit in the organic farm. Considering most of the models, organic farming seemed to be more proitable; however, its economic advantages could not be easily recognized.
Table 4. Ratio of subsidy within the total income (%)
Model Subsidy level
I. II. III. IV. V.
KA 0 25 33 36 41
KB 0 30 38 41 47
KC 0 27 35 38 43
KD 0 26 33 36 42
BA 0 24 31 37 42
BB 0 29 37 44 49
BC 0 24 32 38 44
ACKNOWLEDGEMENT
The authors gratefully acknowledge the support of the National Scientiic Research Fund of Hungary provided for the project No. OTKA K60444.
REFERENCES
[1] Denison, R. F. – Bryant, D. C. –Kearney, T. E. (2004): Crop yields over the irst nine years of LTRAS, a long-term comparison of ield crop systems in a Mediterranean climate. Field Crops Research 86 (2004) p. 267–277.
[2] Frühwald, F. (2000): Organic Farming in Hungary. http://www.organic-europe.net, Stiftung Ökologie & Landbau (SÖL), Bad Dürkheim, Germany
[3] Kis, S. (2007): Results of a questionnaire survey of Hungarian organic farms. Studies in Agricultural Economics. 106. p. 125-148.
[4] Kormosné Koch, K. (2008): Environmental consciousness and the role of
subsidies in private farms carrying out organic farming. Ph.D. thesis, Debrecen.
[5] Maeder, P. et al. (2002). Soil Fertility and Biodiversity in Organic Farming. Science 296, p.1694-1697.
[6] Podmaniczky, L. (2002): 6. Ökonómiai és marketingkérdések az ökológiai
gazdálkodásban. In: Radics L. (ed.) Ökológiai gazdálkodás. II. Szaktudás Kiadó Ház, Budapest. 543-615.
[7] Sabján, J. – Sutus, I. (2009): A mezőgazdasági vállalkozások gazdálkodásának elemzése. Szaktudás Kiadó Ház, Budapest.
[8] Sztanó, I. (2006): 4.4. A mezőgazdasági tevékenység elemzési sajátosságai. In: Sándor L.-né (ed.) A vállalkozások tevékenységének gazdasági elemzése. Perfekt, Budapest. 327-386.
[9] Stanhill, G. (1990). The comparative productivity of organic agriculture. Agriculture, Ecosystems, and Environment. 30 (1-2):1-26.
[10] Takács (2007): Factors of increasing of organic farming according to demand and supply. Cereal Research Communications. 35. 2. 1173-1176. ISSN 0133-3720.
And Proit
Analysis Of Organic
And Conventional Farming In Hungary
Annex 1. Summary table of the chain substitution analysis me.unit: thousand HUF
Model Subsidy
level
Gross proit of conventional farming
Effects of the variations in the ive factors on gross proit (±) Gross proit of organic farming
Capacity Yield Cost per
unit
Market
price Subsidy
A
I. -211 0 -63 -538 1145 0 334
II. 1588 0 -62 -546 1146 0 2125
III. 2383 0 -58 -554 1146 0 2916
IV. 2635 -11 -51 -682 1054 237 3181
V. 3439 -11 -51 -682 1054 237 3985
B
I. -1354 0 64 -667 815 0 -1142
II. 445 0 65 -673 815 0 652
III. 1239 0 70 -684 815 0 1440
IV. 1491 81 67 -803 750 237 1823
V. 2295 81 67 -803 750 237 2627
C
I. -593 0 -21 -401 1084 0 69
II. 1201 0 -20 -404 1084 0 1861
III. 1996 0 -17 -411 1084 0 2652
IV. 2248 20 -14 -549 997 237 2939
V. 3052 20 -14 -549 997 237 3743
D
I. -320 0 -69 -812 794 0 -407
II. 1482 0 -68 -821 794 0 1387
III. 2277 0 -61 -834 794 0 2176
IV. 2529 -2 -53 -941 730 237 2499
V. 3333 -2 -53 -941 730 237 3303
And Profit
Analysis Of Organic