Comparison with COPD Patients and Healthy Smokers
Markos Minas1*, Andriana I. Papaioannou1, Agori Tsaroucha1, Zoe Daniil1, Chrissi Hatzoglou2, Markos Sgantzos3, Konstantinos I. Gourgoulianis1, Konstantinos Kostikas1
1Respiratory Medicine Department, University of Thessaly Medical School, Larissa, Greece,2Department of Physiology, University of Thessaly Medical School, Larissa, Greece,3Department of Anatomy, University of Thessaly Medical School, Larissa, Greece
Abstract
Background:Body composition is an important parameter for patients with chronic obstructive pulmonary disease (COPD) whereas the association between asthma and obesity is not fully understood. The impact of severe refractory asthma (SRA) on fat free mass (FFM) has not been investigated.
Methodology and Principal Findings:213 subjects (70 healthy smokers, 71 COPD patients and 72 asthma patients) without significant comorbidities were included in the study. In all patients, body composition assessment (using bioelectrical impendance analysis, skinfold and anthropometric measurements) and spirometry were performed. Differences in fat free mass index (FFMI) between groups were assessed and determinants of FFMI in asthma were evaluated. Patients with SRA had lower values of FFMI compared to patients with mild-to-moderate asthma [18.0(17.3–18.3)–19.5(18.4–21.5), p,0.001], despite the fact that they were more obese. The levels of FFMI in SRA were lower than those of GOLD stage I–III COPD and comparable to those of stage IV COPD patients [18.0(17.3–18.3)–18.8(17.8–20.1), p = ns]. These differences were present even after proper adjustments for sex, age, smoking status, daily dose of inhaled corticosteroids (ICS) and daily use of oral corticosteroids (OCS). In multivariate analysis, independent predictors of FFMI in asthmatic patients were age, use of OCS and the presence of SRA, but not smoking, sex or cumulative dose of ICS used.
Conclusions and Significance:SRA is related to the presence of low FFMI that is comparable to that of GOLD stage IV COPD. The impact of this observation on asthma mechanisms and outcomes should be further investigated in large prospective studies.
Citation:Minas M, Papaioannou AI, Tsaroucha A, Daniil Z, Hatzoglou C, et al. (2010) Body Composition in Severe Refractory Asthma: Comparison with COPD Patients and Healthy Smokers. PLoS ONE 5(10): e13233. doi:10.1371/journal.pone.0013233
Editor:Irwin Reiss, Erasmus University Rotterdam, Netherlands
ReceivedMay 15, 2010;AcceptedSeptember 13, 2010;PublishedOctober 6, 2010
Copyright:ß2010 Minas et al. This is an open-access article distributed under the terms of the Creative Commons Attribution License, which permits
unrestricted use, distribution, and reproduction in any medium, provided the original author and source are credited. Funding:The authors have no support or funding to report.
Competing Interests:The authors have declared that no competing interests exist. * E-mail: [email protected]
Introduction
Body composition is an important parameter for humans as it has been shown that either malnutrition or obesity, both expressed as body mass index (BMI), are correlated with overall morbidity and mortality [1]. Previous studies from the general population indicate that high values of body fat (BF) and low values of fat free mass (FFM) are independent predictors of all cause mortality [2]. Moreover, it was shown that in healthy subjects total BF, central adiposity and FFM are associated with lung function [3], whereas central adiposity seems to be a better predictor of lung function compared to body weight or BMI [4]. Finally, an 8-year study in the general population has shown that loss of weight and decrease in BMI is associated with an increase in lung function [5].
Body composition represents a risk factor for the development of both chronic obstructive pulmonary disease (COPD) and asthma [6,7]. Men with low values of BMI are at increased risk for the development of COPD [8]. Moreover, although it is unclear if malnutrition is an independent risk factor for COPD development, malnutrition and weight loss can reduce respiratory muscle mass and the strength of the remaining muscle fibers [6]. On the contrary,
obesity represents a risk factor for asthma development [7]. It has been shown that increase in BMI values predisposes to a new asthma diagnosis in female young adults [9], and high values of BMI increase the odds of incident asthma in both men and women [10].
The aim of the present study was to assess body composition in patients with asthma and compare it to COPD patients and healthy smokers. We tested the hypothesis that patients with severe refractory asthma (SRA) might have lower FFMI than those with mild-to-moderate asthma. Predictors of FFMI in patients with asthma were further evaluated.
Materials and Methods
Study design
Study participants were asthmatic patients, COPD patients and healthy smokers, without significant comorbidities that might affect body composition, including history of cardiovascular disease (CVD), diabetes mellitus, history of cancer, other lung disease or any other chronic systemic disease. COPD and asthma patients were recruited from the outpatients clinics of a tertiary hospital and had stable disease for the previous 8 weeks. Diagnosis of COPD and asthma has set at least one year before the inclusion in the study by an expert respiratory physician (K.K.) with specific interest in COPD and asthma, according to the existing guidelines [6,7]. Healthy smokers were divided to current and ex smokers (stopped smoking for at least one year prior to their inclusion).
A structured questionnaire was completed for all study participants, including demographic data, as well as data regarding their disease (for asthmatic and COPD patients) e.g. duration of treatment, use of inhaled corticosteroids (ICS), total ICS dose per day expressed in equivalent mcg of beclomethasone, number of exacerbations during the past year which were treated with short courses of oral corticosteroids (OCS), and daily dose of OCS for some patients with SRA.
All subjects additionally completed a food frequency question-naire (FFQ), which has been used in the Greek population, for the assessment of their nutritional status [17,18]. All subjects were submitted to body composition assessment, skinfolds measure-ments, assessment of anthropometric parameters and simple spirometry. The study protocol was approved by the review board of the University Hospital of Larissa and all patients provided written informed consent.
Body composition, skinfold and anthropometric measurements
Body composition was assessed by bioelectrical impendance analysis (BIA), with a commercially available body analyzer (BIA 101 System Analyser, Akern, Florence, Italy) according to current recommendations [19,20]. FFMI was calculated as FFM/height squared. Skinfolds were measured using a commercially available calliper (GIMA, Plicometro skinfold calliper mechanical, San Donato Milanese, Italy). Skinfolds measured were: biceps, triceps, chest, subscapular, midaxillary, abdominal, suprailiac, thigh and calf skinfold. Anthropometric circumferences and diameters were measured using a commercially available measuring tape. Measurements included the following parameters: neck circum-ference, chest circumcircum-ference, waist circumcircum-ference, abdominal circumference at the umbilicus level, circumference anteriorly between the xiphoid process of the sternum and the umbilicus and laterally between the lower end of the rib cage and iliac crests, iliac circumference, iliac diameter, hip circumference and knee circumference. All body composition measurements were per-formed by the same experienced technician who was blinded to the status of the study participants
Spirometry
All patients were submitted to spirometry by the same experienced technician, using a commercially available system
(Master Screen, Erich Jaeger GmbH, Wuerzburg, Germany) according to American thoracic society (ATS) guidelines [21]. Post-bronchodilator values were recorded for patients with asthma and COPD.
Classification of Patients with Asthma and COPD Patients with asthma were classified as mild-to-moderate asthma patients and patients with SRA according to the ATS and global initiative for asthma (GINA) guidelines [7,22,23]. COPD patients were distributed to the stages of the disease according to their forced expiratory volume in the 1stsecond (FEV1), as it is referred in the global initiative for chronic obstructive pulmonary disease (GOLD) guidelines (Stage I – mild COPD FEV1$80.0% predicted; Stage II – moderate COPD 50.0%#FEV1,80.0% predicted; Stage III – severe COPD 30.0%#FEV1,50.0%; Stage IV – very severe COPD FEV1#30.0% or FEV1,50.0% predicted with respiratory failure) [6].
Statistical analysis
Normally distributed data are presented as mean6SD whereas skewed data are presented as median (interquartile range). Normality of distribution of the variables was assessed using the D’Agostino-Pearson normality test. Comparisons of variables between two groups was performed using unpaired Student’s t-tests or Mann-Whitney U t-tests for normally distributed and skewed variables, respectively whereas comparisons of variables between three or more groups was performed using one way ANOVA or Kruskal Wallis test for normally distributed and skewed variables, respectively, with suitable post hoc analyses (Bonferroni or Dunn’s, respectively) for all pairs of data. For the comparison of FFMI among all groups of subjects a univariate general linear model with appropriate adjustment for confounding factors (sex, age, smoking habit, ICS dose and daily use of OCS) was used; the equality of variances was assessed with Levere’s test and post hoc analysis was performed with Dunnett’s T3 test. Pearson and Spearman’s rank correlation coefficients were used for the correlation between normally distributed and skewed variables, respectively. Multiple regression analysis was performed for the evaluation of FFMI predictors, using FFMI as dependent variable and sex, age, smoking habit, cumulative ICS dose, daily use of OCS and asthma classification (mild-to-moderate vs. SRA) as independent variables. Stepwise multiple regression analysis was additionally used for the development of a prediction equation for FFM in patients with asthma, using anthropometric param-eters. P values,0.05 were considered statistically significant. Analyses were performed using GraphPad Prism 5 (GraphPad Software Inc, La Jolla, CA, USA) and SPSS 16 (SPSS, Chicago, IL, USA).
Results
Body Composition in Healthy Smokers and Patients with COPD and Asthma
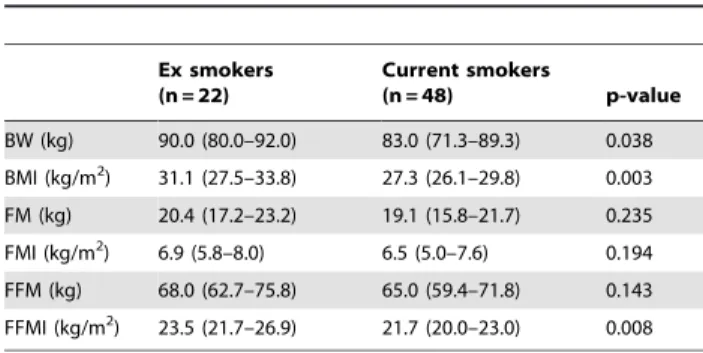
Regarding the group of healthy smokers, ex smokers had higher values of body weight, BMI and FFMI compared to current smokers (Table 3). Patients with stage IV COPD had lower values of FFM and FFMI compared to the earlier stages of the disease, whereas the values of FM and FMI were similar in all stages of the disease (Table 4). Regarding asthma patients, patients with SRA had higher values of BMI, FM and FMI and lower values of FFMI (Table 5).
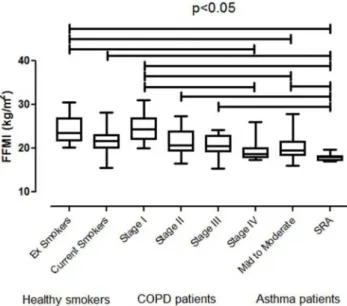
Differences in FFMI in all subgroups of healthy smokers, COPD and asthma patients are presented in Figure 1. Patients with SRA had significantly lower FFMI compared to healthy current and ex smokers, as well as to patients with COPD stage I, II, III and patients with mild-to-moderate asthma, whereas their levels were comparable to those of stage IV COPD.
After proper adjustments for sex, age, smoking habit, ICS dose and daily use of OCS, patients with SRA still presented significantly lower FFMI compared to healthy current (p,0.001) and ex smokers (p,0.001), as well as to patients with COPD stage I (p = 0.007), II (p,0.001), III (p = 0.005), and patients with mild-to-moderate asthma (p = 0.002). Again, there was no difference between patients with SRA and COPD stage IV (p = 0.826). Moreover, after the adjustments, ex smokers differed significantly with COPD stage III (p = 0.02), whereas there was no statistically significant difference between COPD stage I and patients with
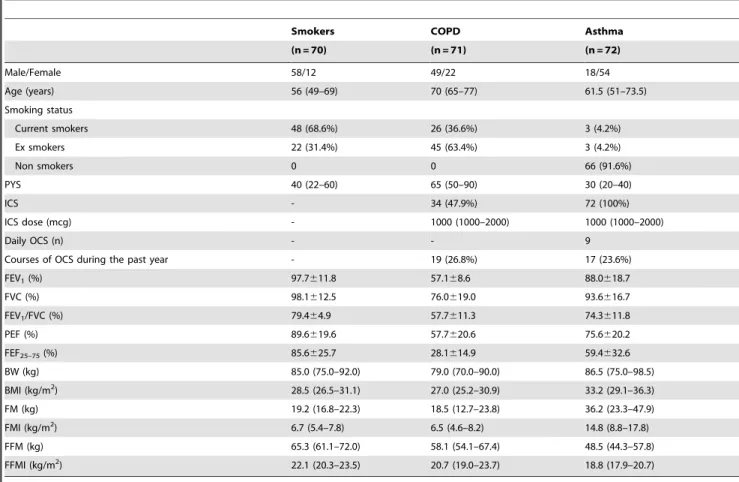
Table 1.Demographic data of the three groups of study participants.
Smokers COPD Asthma
(n = 70) (n = 71) (n = 72)
Male/Female 58/12 49/22 18/54
Age (years) 56 (49–69) 70 (65–77) 61.5 (51–73.5)
Smoking status
Current smokers 48 (68.6%) 26 (36.6%) 3 (4.2%)
Ex smokers 22 (31.4%) 45 (63.4%) 3 (4.2%)
Non smokers 0 0 66 (91.6%)
PYS 40 (22–60) 65 (50–90) 30 (20–40)
ICS - 34 (47.9%) 72 (100%)
ICS dose (mcg) - 1000 (1000–2000) 1000 (1000–2000)
Daily OCS (n) - - 9
Courses of OCS during the past year - 19 (26.8%) 17 (23.6%)
FEV1(%) 97.7611.8 57.168.6 88.0618.7
FVC (%) 98.1612.5 76.0619.0 93.6616.7
FEV1/FVC (%) 79.464.9 57.7611.3 74.3611.8
PEF (%) 89.6619.6 57.7620.6 75.6620.2
FEF25–75(%) 85.6625.7 28.1614.9 59.4632.6
BW (kg) 85.0 (75.0–92.0) 79.0 (70.0–90.0) 86.5 (75.0–98.5)
BMI (kg/m2) 28.5 (26.5–31.1) 27.0 (25.2–30.9) 33.2 (29.1–36.3)
FM (kg) 19.2 (16.8–22.3) 18.5 (12.7–23.8) 36.2 (23.3–47.9)
FMI (kg/m2) 6.7 (5.4–7.8) 6.5 (4.6–8.2) 14.8 (8.8–17.8)
FFM (kg) 65.3 (61.1–72.0) 58.1 (54.1–67.4) 48.5 (44.3–57.8)
FFMI (kg/m2) 22.1 (20.3–23.5) 20.7 (19.0–23.7) 18.8 (17.9–20.7)
Values are reported as mean6SD or median (interquartile ranges) for normally distributed and skewed data, respectively.
PYS: Pack Years, ICS: Inhaled corticosteroids, OCS: Oral corticosteroids, BW: Body Weight, BMI: Body Mass Index, FM: Fat Mass, FMI: Fat Mass Index, FFM: Fat Free Mass, FFMI: Fat Free Mass Index, FEV1: Forced Expiratory Volume in the 1stsecond, FVC: Forced Vital Capacity, PEF: Peak Expiratory Flow, FEF25–75: Forced mid-Expiratory Flow. doi:10.1371/journal.pone.0013233.t001
Table 2.Food items consumed (in servings/week) in each group.
Smokers COPD Asthma p-value
Red meat 1 (1–2) 1 (1–2) 1 (0–2) 0.856
Pork 1 (1–2) 1 (0–2) 1 (0–2) 0.394
Poultry 1 (1–2) 1 (1–2) 1 (0–2) 0.056
Fish 1 (1–2) 1 (1–2) 1 (1–2) 0.503
Egg 1 (1–3) 1 (0–2) 1 (0–2) 0.128
Bread and cereals 7 (3–7) 7 (5–7) 7 (6–7) 0.108 Pasta and rice 2 (1–3) 2 (1–3) 3 (1–4) 0.677
Potatoes 2 (2–3) 2 (1–3) 3 (1–3) 0.338
Vegetables 7 (4.5–7) 7 (4.5–7) 7 (5–7) 0.575 Fruit and juices 6 (4–7) 5 (3–7) 5 (4–7) 0.999 Milk and products full fat 2 (0–4.5) 5 (0–7) 5 (0–7) 0.213 Milk and products low fat 0 (0–0) 0 (0–0) 0 (0–0) 0.474 Cheese yellow 1 (0–4) 0 (0–2) 0 (0–3) 0.079 Cheese white 6 (4–7) 4.5 (3–7) 5 (4–7) 0.150
Legumes 5 (3–5.5) 4 (2–5) 5 (3–6) 0.269
Desert or ice cream 1 (0–3) 1 (0–2) 2 (1–3) 0.157
mild to moderate asthma (p = 0.087). All the other differences presented in Figure 1 remained statistically significant.
Predictors of FFMI in Patients with Asthma
Predictors of FFMI in patients with asthma, provided by multiple regression analysis, are presented in Table 6. Age, daily use of OCS and the presence of SRA, but not sex, smoking habit or the cumulative dose of ICS, were independent predictors of FFMI (R2: 0.960, Adjusted R2: 0.956).
FFMI in patients with asthma was correlated with subscapular skinfold (r = 0.354, p = 0.004), midaxillary skinfold (r = 0.335, p = 0.007), neck circumference (r = 0.268, p = 0.039), waist circum-ference (r = 0.417, p = 0.001), iliac diameter (r = 0.411, p = 0.002) and knee circumference (r = 0.314, p = 0.025). Stepwise multiple regression analysis using anthropometric parameters as indepen-dent variables showed that FFM values can be predicted based on weight, height, abdominal and calf skinfold and iliac diameter (Unadjusted R2: 0.999, Adjusted R2: 0.998; Table 7).
Discussion
The results of the current study indicate that there are differences in body composition among specific groups of healthy smokers, COPD and asthma patients without comorbidities. Patients with SRA have lower values of FFMI compared to patients with mild-to-moderate asthma, despite the presence of higher values of BMI and FMI. Additionally, the levels of FFMI in
SRA were lower than those of current and ex smokers and comparable to those with stage IV COPD. Finally, age, daily use of OCS and the presence of SRA were the only independent predictors of FFMI in patients with asthma.
This is the first study to show that patients with SRA, despite the fact that they are often obese, have also reduced values of FFMI. Moreover, it was shown that SRA is an independent predictor of FFMI in asthma patients. These patients had similar values of FFMI compared to patients with stage IV COPD, although they had higher values of BMI. Shore has recently proposed several mechanisms which may interfere in the association between obesity and asthma, such us mechanical factors, systemic inflammation and the role of comorbidities [16]. On the other hand it is known that patients with SRA present chronic airway inflammation, with a possible activation of neutrophils [22]. It is additionally known that obesity provokes systemic inflammation, leading to the development of metabolic syndrome, insulin resistance and high levels of CRP [24]. The coexistence of intense local and systemic inflammation in these patients may lead to loss of FFM in patients with SRA.
The fact that the presence of SRA was an independent predictor of FFMI in asthmatics further supports the significance of body composition assessment in that population. The results of our study indicate that in patients with SRA, FFMI was also associated with the use of OCS, whereas there was no association with daily ICS dose. In a similar study by Targowski et al., it was shown that systemic corticosteroids lead to loss of FFM in the
Table 3.Body composition in ex and current healthy smokers.
Ex smokers (n = 22)
Current smokers
(n = 48) p-value
BW (kg) 90.0 (80.0–92.0) 83.0 (71.3–89.3) 0.038 BMI (kg/m2) 31.1 (27.5–33.8) 27.3 (26.1–29.8) 0.003 FM (kg) 20.4 (17.2–23.2) 19.1 (15.8–21.7) 0.235 FMI (kg/m2) 6.9 (5.8–8.0) 6.5 (5.0–7.6) 0.194 FFM (kg) 68.0 (62.7–75.8) 65.0 (59.4–71.8) 0.143 FFMI (kg/m2) 23.5 (21.7–26.9) 21.7 (20.0–23.0) 0.008
Values are reported as median (interquartile ranges).
BW: Body Weight, BMI: Body Mass Index, FM: Fat Mass, FMI: Fat Mass Index, FFM: Fat Free Mass, FFMI: Fat Free Mass Index.
doi:10.1371/journal.pone.0013233.t003
Table 4.Body composition in COPD patients according to GOLD stages of the disease.
Stage I Stage II Stage III Stage IV p-value
(n = 9) (n = 32) (n = 19) (n = 11)
BW (kg) 92.0 (78.0–105.0) 79.0 (70.0–89.3) 75.0 (66.0–80.0) 76.0 (67.0–83.0) 0.073
BMI (kg/m2) 30.9 (26.8–34.3) 27.0 (25.2–30.3) 26.0 (24.8–29.4) 26.6 (23.4–28.9) 0.179
FM (kg) 18.1 (12.4–22.8) 18.3 (13.2–22.8) 16.1 (11.2–23.3) 24.0 (12.5–26.9) 0.619
FMI (kg/m2) 6.2 (4.4–7.3) 6.4 (4.8–8.1) 5.7 (4.1–9.2) 8.2 (4.4–9.4) 0.586
FFM (kg) 74.6 (63.8–79.7) 58.5 (54.6–67.8)‘ 57.1 (53.6–62.9)‘ 55.1 (48.8–57.7)‘ 0.002
FFMI (kg/m2) 24.4 (22.1–26.9) 20.8 (19.4–23.8) 20.6 (19.3–22.8) 18.8 (17.8–20.1)‘ 0.004
Values are reported as median (interquartile ranges).
BW: Body Weight, BMI: Body Mass Index, FM: Fat Mass, FMI: Fat Mass Index, FFM: Fat Free Mass, FFMI: Fat Free Mass Index. ‘Indicate statistically significant difference with Stage I.
doi:10.1371/journal.pone.0013233.t004
Table 5.Body composition in asthma patients according to their stage of the disease.
Mild to moderate Severe refractory asthma p-value
(n = 48) (n = 24)
BW (kg) 83.0 (69.3–89.5) 97.0 (87.0–103.8) ,0.001 BMI (kg/m2) 31.2 (27.3–34.0) 35.0 (34.6–37.4)
,0.001 FM (kg) 26.1 (22.3–37.4) 48.3 (41.7–54.3) ,0.001 FMI (kg/m2) 9.7 (7.6–14.9) 17.3 (16.8–19.4)
,0.001 FFM (kg) 49.9 (43.1–65.6) 48.2 (44.7–49.5) 0.199 FFMI (kg/m2) 19.5 (18.4–21.5) 18.0 (17.3–18.3)
,0.001
Values are reported as median (interquartile ranges).
BW: Body Weight, BMI: Body Mass Index, FM: Fat Mass, FMI: Fat Mass Index, FFM: Fat Free Mass, FFMI: Fat Free Mass Index.
lower limbs, whereas ICS do not affect FFM [25]. Our data further support the role of OCS, but not of ICS, on body composition of asthmatic patients, besides the role of age and the presence of severe disease.
On the other hand, body composition has been widely studied in COPD and the extrapulmonary effects of this disorder that leads to cachexia and loss of FFM have been well established [6]. Our data replicate the findings of Ischaki et al. showing lower FFMI in COPD patients with stage IV COPD compared to those with stages 0 and I of the disease [26], since in the present study patients at stage III and IV had lower values of FFMI compared to patients at stage I of the disease. Regarding the loss of FFM in COPD patients, several hypotheses have been suggested which imply that COPD affects both structure and function of skeletal muscles [27]. These effects of the disease in skeletal muscle mass are very important, as it has been shown that FFM is an independent predictor of mortality, irrespective of FM [28]. However, there are data implying that the loss of FFMI may be attributed in dietary problems in COPD patients [29]. The results of the current study, however, indicate that patients with severe and very severe COPD have lower values of FFMI compared to
patients with milder disease, despite the fact that our COPD patients had similar nutritional status compared to healthy smokers and asthma patients.
We have additionally shown that anthropometric and skinfolds methods may be used for the estimation of FFM in patients with asthma. Despite the fact that there were no strong correlations between single skinfolds and/or circumferences, we have shown that a combination of them may be used for the estimation of FFM in these patients. Equations using combinations of skinfold and/or anthropometric parameters have been used for body composition assessment in specific populations [30,31]. In a previous study, Peterson et al. have developed equations using skinfold measure-ments for the prediction of per cent BF (%BF) with a 4 compartment model [32]. In healthy subjects weight to height ratio was the best predictor of BF [33], whereas in COPD patients, anthropometry has been studied for the estimation of body composition [34,35]. To the best of our knowledge, this is the first study to assess body composition using skinfolds and anthropo-metric parameters in patients with asthma, and the equation provided from this study needs to be further validated in an independent population.
However, although the strength of the study is the careful selection of patients without comorbidities, this study has limitations. A significant limitation is that there were differences between the three groups concerning age, smoking status and gender distribution. In the healthy smokers and COPD groups subjects were predominantly male, whereas the asthmatics were predominantly female. Moreover COPD patients were older compared to asthma patients and healthy smokers. However, these differences are attributed to the prevalence of the diseases in the two genders, since it is known that SRA is more prevalent in women whereas, in Greece, smokers and COPD patients are mainly male [22,36]. Another possible limitation of our study is the high prevalence of obesity and overweight in our population. However, the prevalence of obesity in the Greek population is one of the highest among Europe countries in both adults and children [37]. In Thessaly, the area of origin of the population of the present study, the overall prevalence of obesity was 26.6% whereas the prevalence of overweight was 39.4% and the mean value of BMI in that study was 27.5 kg/m2 [38]. Therefore, our study population is rather representative of the general population of the area of Thessaly in terms of obesity. Moreover, the fact that the significant differences of FFMI in all groups remained after the additional analysis with proper adjustments for the aforemen-tioned confounders, further supports the need for evaluation of body composition in patients with SRA.
Figure 1. Comparison of FFMI between all subgroups of subjects.ES: Ex smokers, CS: Current smokers, MtM: Mild-to-moderate asthma, SRA: Severe refractory asthma.
doi:10.1371/journal.pone.0013233.g001
Table 6.Parameters associated with FFMI in asthma patients.
B* SE Beta# 95% CI for B p-value
Sex 1.219 1.606 0.030 21.997, 4.425 0.451 Age 0.223 0.026 0.696 0.171, 0.275 ,0.001 Smoking 1.996 1.856 0.038 21.721, 5.714 0.287 ICS dose 0.000 0.001 20.034 20.003, 0.002 0.698 Daily OCS 24.548 1.691 20.088 27.935, 1.162 0.009 Stagea 4.566 1.304 0.341 1.955, 7.177 0.001
*Unstandardized coefficients, SE: Standard error, #
Standardized coefficients.
ICS: Inhaled corticosteroids, OCS: Oral corticosteroids, Stagea: mild to moderate asthma or SRA.
doi:10.1371/journal.pone.0013233.t006
Table 7.Prediction equations for FFM in asthma patients.
B* SE Beta#
95% CI for B p-value
Weight (kg) 0.275 0.045 0.519 0.171, 0.379 ,0.001 Height (cm) 0.176 0.026 0.575 0.116, 0.236 ,0.001 Skinfolds (cm)
Abdominal 0.327 0.030 0.278 0.258, 0.397 ,0.001 Calf 20.265 0.097 20.102 20.489,20.042 0.026 Anthropometry (cm)
Iliac diameter 20.266 0..075 20.258 20.440,20.093 0.008
*Unstandardized coefficients, SE: Standard error, #
Standardized coefficients.
Another potential limitation is the use of BIA as a method for the estimation of FFM. It has been proposed that in COPD patients the method of choice for body composition assessment should be dual energy X ray absorptiometry (DEXA) [39], although in a previous study it was shown that DEXA did not differ from anthropometric measurements in COPD patients, and DEXA did not differ with either anthropometric or BIA measurements in healthy subjects [40]. In another study, Lerario et al. showed that both BIA and anthropometry presented good reliability and correlation with DEXA in COPD patients [34]. Despite the wide evaluation of those methods in COPD patients and healthy controls, there are no data in asthmatics, and further studies validating our results using DEXA are warranted.
In conclusion, in the present study we have shown that in a population of healthy smokers and patients with COPD and asthma without comorbidities, SRA is related to the presence of decreased FFMI that is comparable to that of GOLD stage IV COPD. The impact of this observation on asthma outcomes should be further investigated in large prospective studies.
Author Contributions
Conceived and designed the experiments: MM KIG KK. Performed the experiments: MM AIP AT. Analyzed the data: MM AIP AT ZD CH MS. Contributed reagents/materials/analysis tools: MM AIP AT ZD CH MS. Wrote the paper: MM KK. Gave the final approval: KK.
References
1. Heitmann BL, Erikson H, Ellsinger BM, Mikkelsen KL, Larsson B (2000) Mortality associated with body fat, fat-free mass and body mass index among 60-year-old swedish men-a 22-year follow-up. The study of men born in 1913. Int J Obes Relat Metab Disord 24: 33–37.
2. Bigaard J, Frederiksen K, Tjonneland A, Thomsen BL, Overvad K, et al. (2004) Body fat and fat-free mass and all-cause mortality. Obes Res 12: 1042–1049. 3. Wannamethee SG, Shaper AG, Whincup PH (2005) Body fat distribution, body
composition, and respiratory function in elderly men. Am J Clin Nutr 82: 996–1003.
4. Ochs-Balcom HM, Grant BJ, Muti P, Sempos CT, Freudenheim JL, et al. (2006) Pulmonary function and abdominal adiposity in the general population. Chest 129: 853–862.
5. Bottai M, Pistelli F, Di Pede F, Carrozzi L, Baldacci S, et al. (2002) Longitudinal changes of body mass index, spirometry and diffusion in a general population. Eur Respir J 20: 665–673.
6. Rabe KF, Hurd S, Anzueto A, Barnes PJ, Buist SA, et al. (2007) Global strategy for the diagnosis, management, and prevention of chronic obstructive pulmonary disease: GOLD executive summary. Am J Respir Crit Care Med 176: 532–555.
7. Bateman ED, Hurd SS, Barnes PJ, Bousquet J, Drazen JM, et al. (2008) Global strategy for asthma management and prevention: GINA executive summary. Eur Respir J 31: 143–178.
8. Harik-Khan RI, Fleg JL, Wise RA (2002) Body mass index and the risk of COPD. Chest 121: 370–376.
9. Beckett WS, Jacobs DR Jr., Yu X, Iribarren C, Williams OD (2001) Asthma is associated with weight gain in females but not males, independent of physical activity. Am J Respir Crit Care Med 164: 2045–2050.
10. Beuther DA, Sutherland ER (2007) Overweight, obesity, and incident asthma: a meta-analysis of prospective epidemiologic studies. Am J Respir Crit Care Med 175: 661–666.
11. Chiolero A, Faeh D, Paccaud F, Cornuz J (2008) Consequences of smoking for body weight, body fat distribution, and insulin resistance. Am J Clin Nutr 87: 801–809.
12. Landbo C, Prescott E, Lange P, Vestbo J, Almdal TP (1999) Prognostic value of nutritional status in chronic obstructive pulmonary disease. Am J Respir Crit Care Med 160: 1856–1861.
13. Vestbo J, Prescott E, Almdal T, Dahl M, Nordestgaard BG, et al. (2006) Body mass, fat-free body mass, and prognosis in patients with chronic obstructive pulmonary disease from a random population sample: findings from the Copenhagen City Heart Study. Am J Respir Crit Care Med 173: 79–83. 14. Slinde F, Gronberg A, Engstrom CP, Rossander-Hulthen L, Larsson S (2005)
Body composition by bioelectrical impedance predicts mortality in chronic obstructive pulmonary disease patients. Respir Med 99: 1004–1009. 15. Saint-Pierre P, Bourdin A, Chanez P, Daures JP, Godard P (2006) Are
overweight asthmatics more difficult to control? Allergy 61: 79–84.
16. Shore SA (2008) Obesity and asthma: possible mechanisms. J Allergy Clin Immunol 121: 1087–1093; quiz 1094–1085.
17. Pitsavos C, Milias GA, Panagiotakos DB, Xenaki D, Panagopoulos G, et al. (2006) Prevalence of self-reported hypertension and its relation to dietary habits, in adults; a nutrition & health survey in Greece. BMC Public Health 6: 206. 18. Milias GA, Panagiotakos DB, Pitsavos C, Xenaki D, Panagopoulos G, et al.
(2006) Prevalence of self-reported hypercholesterolaemia and its relation to dietary habits, in Greek adults; a national nutrition & health survey. Lipids Health Dis 5: 5.
19. Kyle UG, Bosaeus I, De Lorenzo AD, Deurenberg P, Elia M, et al. (2004) Bioelectrical impedance analysis–part I: review of principles and methods. Clin Nutr 23: 1226–1243.
20. Kyle UG, Bosaeus I, De Lorenzo AD, Deurenberg P, Elia M, et al. (2004) Bioelectrical impedance analysis-part II: utilization in clinical practice. Clin Nutr 23: 1430–1453.
21. (1995) Standardization of Spirometry, 1994 Update. American Thoracic Society. Am J Respir Crit Care Med 152: 1107–1136.
22. Holgate ST, Polosa R (2006) The mechanisms, diagnosis, and management of severe asthma in adults. Lancet 368: 780–793.
23. (2000) Proceedings of the ATS workshop on refractory asthma: current understanding, recommendations, and unanswered questions. American Tho-racic Society. Am J Respir Crit Care Med 162: 2341–2351.
24. Chandalia M, Abate N (2007) Metabolic complications of obesity: inflated or inflamed? J Diabetes Complications 21: 128–136.
25. Targowski T, Frank-Piskorska A, Jahnz-Rozyk K, Plusa T (2004) [Influence of chronic glucocorticosteroid therapy on fat free mass in women with severe bronchial asthma]. Pol Merkur Lekarski 17: 567–570.
26. Ischaki E, Papatheodorou G, Gaki E, Papa I, Koulouris N, et al. (2007) Body mass and fat-free mass indices in COPD: relation with variables expressing disease severity. Chest 132: 164–169.
27. (1999) Skeletal muscle dysfunction in chronic obstructive pulmonary disease. A statement of the American Thoracic Society and European Respiratory Society. Am J Respir Crit Care Med 159: S1–40.
28. Schols AM, Broekhuizen R, Weling-Scheepers CA, Wouters EF (2005) Body composition and mortality in chronic obstructive pulmonary disease. Am J Clin Nutr 82: 53–59.
29. Gronberg AM, Slinde F, Engstrom CP, Hulthen L, Larsson S (2005) Dietary problems in patients with severe chronic obstructive pulmonary disease. J Hum Nutr Diet 18: 445–452.
30. Garcia AL, Wagner K, Hothorn T, Koebnick C, Zunft HJ, et al. (2005) Improved prediction of body fat by measuring skinfold thickness, circumferenc-es, and bone breadths. Obes Res 13: 626–634.
31. Ketel IJ, Volman MN, Seidell JC, Stehouwer CD, Twisk JW, et al. (2007) Superiority of skinfold measurements and waist over waist-to-hip ratio for determination of body fat distribution in a population-based cohort of Caucasian Dutch adults. Eur J Endocrinol 156: 655–661.
32. Peterson MJ, Czerwinski SA, Siervogel RM (2003) Development and validation of skinfold-thickness prediction equations with a 4-compartment model. Am J Clin Nutr 77: 1186–1191.
33. Larsson I, Henning B, Lindroos AK, Naslund I, Sjostrom CD, et al. (2006) Optimized predictions of absolute and relative amounts of body fat from weight, height, other anthropometric predictors, and age 1. Am J Clin Nutr 83: 252–259.
34. Lerario MC, Sachs A, Lazaretti-Castro M, Saraiva LG, Jardim JR (2006) Body composition in patients with chronic obstructive pulmonary disease: which method to use in clinical practice? Br J Nutr 96: 86–92.
35. Schols AM, Wouters EF, Soeters PB, Westerterp KR (1991) Body composition by bioelectrical-impedance analysis compared with deuterium dilution and skinfold anthropometry in patients with chronic obstructive pulmonary disease. Am J Clin Nutr 53: 421–424.
36. Tzanakis N, Anagnostopoulou U, Filaditaki V, Christaki P, Siafakas N (2004) Prevalence of COPD in Greece. Chest 125: 892–900.
37. Roditis ML, Parlapani ES, Tzotzas T, Hassapidou M, Krassas GE (2009) Epidemiology and predisposing factors of obesity in Greece: from the Second World War until today. J Pediatr Endocrinol Metab 22: 389–405.
38. Koukoulis GN, Sakka C, Katsaros F, Goutou M, Tsirona S, et al. High rates of obesity prevalence in adults living in Central Greece: Data from the ARGOS Study. Hormones (Athens) 9: 253–262.
39. Miller A, Strauss BJ, Mol S, Kyoong A, Holmes PH, et al. (2009) Dual-energy X-ray absorptiometry is the method of choice to assess body composition in COPD. Respirology 14: 411–418.