2013 Nov.-Dec.;21(6):1240-7 DOI: 10.1590/0104-1169.3060.2360 www.eerp.usp.br/rlae
Copyright © 2013 Revista Latino-Americana de Enfermagem This is an Open Access article distributed under the terms of the Creative Commons Attribution Non-Commercial License (CC BY-NC).
This license lets others distribute, remix, tweak, and build upon your work non-commercially, and although their new works must also acknowledge you and be non-commercial, they don’t have to license their derivative works on the same terms.
Corresponding Author: Viviane Soares Rua Amazonas, 294 Centro
CEP: 75024-080, Anápolis, GO, Brasil E-mail: [email protected]
Viviane Soares
2Ivan Silveira de Avelar
2Sara Rosa de Sousa Andrade
2Marcus Fraga Vieira
3Maria Sebastiana Silva
31 Supported by Coordenação de Aperfeiçoamento de Pessoal de Nível Superior (CAPES), process # 1081360. 2 Doctoral students, Faculdade de Medicina, Universidade Federal de Goiás, Goiânia, GO, Brazil.
3 PhD, Associate Professor, Faculdade de Educação Física, Universidade Federal de Goiás, Goiânia, GO, Brazil.
Objective: to compare the body composition of patients undergoing hemodialysis with that
of healthy individuals using different methods. Method: cross-sectional study assessing male
individuals using anthropometric markers, electrical bioimpedance and vector analysis. Results:
the healthy individuals presented larger triceps skinfold and arm circumference (p<0.001).
The bioimpedance variables also presented significant higher values in this group. Significant
difference was found in the confidence interval of the vector analysis performed for both the
patients and healthy individuals (p<0.0001). The tolerance intervals showed that 55.20% of the
patients were dehydrated, 10.30% presented visible edema, and 34.50% were within normal
levels of hydration. Bioimpedance and vector analysis revealed that 52% of the patients presented
decreased cell mass while 14.00% presented increased cell mass. Conclusions: the differences
in the body composition of patients and healthy individuals were revealed through bioimpedance
and vector analysis but not through their measures of arm circumference and arm muscle area.
Descriptors: Anthropometry; Electric Impedance; Renal Dialysis.
Introduction
The number of studies addressing the body
composition of chronic renal patients undergoing
hemodialysis (HD) due to changes in fat tissue and
muscle metabolism, and consequently, presenting
water-electrolyte imbalances that pose the risk of
mortality and morbidities, has recently increased(1-2).
The methods commonly used to assess body
compartments are skinfold thickness, bioelectrical
impedance (BIA), and bioelectrical impedance vector
analysis (BIVA) for being simple, fast, reproducible and
less costly(3). The triceps skinfold associated with arm
circumference has been used to verify arm circumference
and muscle area, which are important parameters in
assessing the nutritional state of patients undergoing
HD(4). BIA is a method based on regression equations to
estimate one’s total body water, lean, fat and cell mass.
Some studies report that results may be overestimated
when BIA is employed in hemodialysis patients(3,5).
BIVA, on the other hand, based on the length of
vector impedance and on its phase angle, measured in
50hz, may be subject to impedance measuring error
and be affected by the patients’ physiological variability.
BIVA’s measurement variables are resistance (R) and
reactance (Xc), which are the same measures as BIA,
only that here they are normalized by height and plotted
as vectors in the RXc plane. The vector’s length relects
the individual’s level of hydration, so that the higher the
vector the lower the quantity of water and the greater the
resistance (R), while a larger phase angle is associated
with a better nutritional state(6). This technique
permits assessing the patient’s level of hydration and
distinguishing body tissues with greater contents of
water (muscles) and those with lower contents of
water (fat tissue, lungs and bones)(3). Reactance (Xc)
expresses the capacity of cell membranes to store
energy since they act as electrical capacitors when an
electrical current passes through. Cell membranes act as
conductors and cell content acts as dielectric material,
storing the charge when the current passes between
intra and extracellular compartments(3).
Studies on BIVA report advantages on the
monitoring and planning of therapy for HD patients
with water-electrolytes imbalance without the need to
make assumptions about one’s body composition(7). This
method is reliable to detect changes occurring in the
level of hydration and cell mass, as well as to indicate
survival in this population(8-10). Other studies indicate
BIVA has an excellent correlation with laboratory
parameters: albumin, normalized protein nitrogen
appearance (nPNA) and dialysis adequacy (Kt/V)(11).
Due to the importance of anthropometric methods
and bioelectrical impedance in the assessment of body
composition of different populations, our hypothesis in
this study was that the body composition of individuals
with chronic renal disease undergoing hemodialysis is
different from that of healthy individuals when measured
through skinfold, resistance, capacitance and phase
angle. Therefore, this study’s objective was to compare
the body composition of patients with chronic renal
disease undergoing hemodialysis with the composition
of healthy individuals through different methods usually
employed in clinical research.
Method
This cross-sectional and analytical study was
conducted with 47 male patients with chronic renal
disease cared for by a hemodialysis service in Goiania
(GO), Brazil. A total of 29 patients were included in
the study after applying the inclusion criteria: being 18
years old or older, under treatment for more than three
months, and having hypertension and/or diabetes
mellitus under control; and exclusion criteria: having
a chronic lung disease, severe cardiac disease, or
cognitive deicit. In order to compose the control group (CG), a stratiied randomization was performed of 40
individuals 18 years old or older, but in the same age
group, without signiicant differences in terms of weight,
height, and BMI, and without chronic lung disease or
severe heart disease. The Institutional Review Board
at the Federal University of Goiás approved the study
(No. 294/11). All the 29 male patients and 40 healthy
male individuals signed free and informed consent
forms according to Resolution 196/96, Brazilian
Council of Health.
An identiication form addressing the subjects’ age,
duration of hemodialysis, marital status, education,
income, cause of disease and smoking was completed.
Filizola scales with capacity for 150 kg together with
a SANNY portable stadiometer were used to collect
anthropometric data. Arm circumferences were
measured with an inextensible metrical tape and
the triceps skinfold thickness with a Lange caliper. A
monofrequency bioelectrical impedance device (50 kHz)
(Quantum II da RJL systems, CA, USA) with a tetrapolar
electrode system with accuracy of resistance and
reactance between 0-1000 ohms was used to analyze
Rev. Latino-Am. Enfermagem 2013 Nov.-Dec.;21(6): 1240-7.
All the procedures were performed concomitantly
with the routine laboratory exams. Hematocrit,
hemoglobin and Kt/V were used to characterize the
sample in clinical terms. Arm circumferences (AC) were
measured at the midpoint between the acromion and
olecranon. The following formula was used to compute
the arm muscle circumference (AMC) and arm muscle
area (AMA): AMC (mm) = AC – π(TSF) and AMA=
[AC - π(TSF)]²/4π. The TSF was clamped at a pressure
of 10 g/mm² of surface area contact(12). BMI was
calculated by dividing weight and height squared after
HD and classiied according to WHO(13). All the measures
were taken after the weekly intermediary hemodialysis
session and always on the upper arm opposed to the
arteriovenous istula. The average of the three measures
was used for the analysis.
Bioimpedance was performed with the patient
in supine position on a nonconductive surface with
limbs approximately 30 degrees apart. The patients
and healthy subjects were advised not to exercise
eight hours before and not to drink alcohol 12 hours
before the exam, not to apply any kind of body lotion,
and watch for spiking fever. BIA was taken between
20 and 30 min after the weekly intermediate dialysis
session. Electrodes were placed on the opposite site
of the vascular access on the dorsal hand region (one
between the head of the ulna and the radius and another
on the proximal phalanx of the third inger) and on the
dorsal foot region (one electrode between the medial
and lateral malleolus and another in the region of the
third metatarsal). Skin in these sites was cleaned with
alcohol. Three measurements were taken of R and Xc in
all patients and healthy individuals included in the study.
The highest value was used to calculate the phase angle
(PA) (Xc/R x 180º/π).
The estimates of total body water (TBW), fat
mass (FM), fat free mass (FFM) and phase angle (PA)
were obtained through software developed by RLJ
Systems, Quantum II (CA, USA). The estimate of
body cell mass (BCM) was obtained with the formula
[(TBW-EW)/0.732](14). The BIA’s components, R and
Xc, obtained from both CG and PG were analyzed
through vector impedance (BIVA), where the
components (R/H and Xc/H), normalized by height,
were plotted. These measures were dotted ellipse
shaped in the RXc plane both for the conidence and
tolerance intervals(9).
Statistical procedure. Data are expressed as
average, standard deviation and frequency. Independent
variables were: age and duration of hemodialysis while
dependent variables included: BMI, AC, AMC, TSF, R, Xc,
PA, BCM, FFM, and TBW. Normality of data was veriied by Shapiro-Wilk test. The t-test was used for independent
samples to compare the anthropometric variables and
the BIA variables of both groups. Associations of PA
and BCM with the anthropometric variables and body
composition of the PG were veriied using Person’s coeficient correlation. The coeficient of correlation
was also found between R/H and Xc/H. Vectors were
analyzed by Hotelling’s T-squared test and univariate
analysis (F test). The level of signiicance adopted was
p≤0.05. Data were analyzed in Statistical Package for
the Social Sciences (SPSS) and BIVA software 2002.
Results
The participants’ proiles show that 55% of the
PG were former smokers, 69% had an income below
ive times the minimum wage, 62% completed primary
school, 72% were married, and 52% were 60 years
old or younger. In the CG, 53% were former smokers,
65% had income below ive times the minimum wage,
45% completed primary school, 46% were married,
and 58% were 60 years old or younger. The groups
did not signiicantly differ in terms of age, height and
weight (Table 1).
The PG’s BMI indicated that 62% were within
expected values, 31% were pre-obese and 6.4%
presented level I obesity. In the CG, 83% were with
normal weights and 13% were pre-obese. The average
BMI was higher in the CG than in the PG, though
without signiicant differences. The clinical parameters
indicating anemia and dialysis adequacy are presented
in Table 1. The conidence intervals (CI) of hematocrit,
hemoglobin and dialysis adequacy were: 23.50-42.40%.,
7.80-14.50 mg/dL, 0.83-3.00 (Table 1), respectively.
In the anthropometric assessment, the groups’
triceps skinfold (TSF) (PG: CI between 9.42 – 22.9
mm; CG: CC between 13.38-37.94 mm) and arm
circumference (AC) (PG: CI between 25.31-32.65 cm;
CG: CI between 28.74-36.94 cm) presented signiicant differences (Table 2). The measures that relect muscle
mass, AMC and AMA, were higher in the CG, though
with no signiicant differences. The healthy individuals presented higher and signiicant values in relation to
BIA’s variables, resistance, reactance, and phase angle
when compared to patients. The CG also presented
higher average values of body mass index (BMI), fat
free mass (FFM) and total body water (TBW): 11.60%,
Table 1 - Demographic and clinical characteristics of the group of patients and the control group
Table 2 - Anthropometric characteristics and body composition (BIA) of the patient and the control groups
Figure 1 - (A) Conidence interval for vector bioelectrical impendence: Patient Group (dotted ellipsis) and Control
Group (black ellipsis). Statistical difference between the groups p< 0.001. (B) Interval of tolerance for percentiles
50%, 75% and 95% of the PG
* p≤0.05; †p<0.001
Group of Patients (n=29) Control Group (n=40) p
Age (years) 54.52±13.53 52.90±14.20 0.63
Weight (kg) 69.15±10.71 73.36±11.01 0.12
Height (m) 1.69±0.07 1.68±0.06 0.58
Body Mass Index (kg/m²) 24.22±3.75 25.94±3.69 0.06
Hemodialysis (months) 64.41±43.81 -
-Hematocrit (%) 33.70±4.26 -
-Hemoglobin (g/dL) 11.03±1.50 -
-Dialysis adequacy (Kt/V) 1.72±0.51 -
-Group of Patients (n=29) Control Group (n=40) p
Triceps skinfold (mm) 16.16±6.74 25.66±12.28 0.001*
Arm circumference (cm) 28.98±3.67 32.84±4.1 0.001*
Arm muscle circumference (cm) 23.91±3.12 24.78±5.81 0.50
Arm muscle area (m) 4560.51±1235.25 5079. 25±2293.10 0.30
Resistance (ohm) 587.10±87.89 482.37±49.03 0.001*
Reactance (Xc) (ohm) 64.48±15.34 52.20±8.01 0.01†
Phase angle (º) 6.30±1.35 6.83±0.83 0.05†
Body cell mass (kg) 28.96±3.41 32.32±3.55 0.001*
Fat free mass (kg) 48.80±6.72 54.42±6.30 0.01†
Total body water (L) 35.35±5.33 40.73±4.70 0.001*
The impedance vector analysis performed using
BIVA software 2002 indicated that the body composition
of patients was altered according to Picoli’s classiication
(1994)(9). Figure 1A presents the conidence interval
between R/H and Xc/H of the PG (black ellipsis) and of
the CG (dotted ellipsis). Hotelling’s T (T²=36.1) and F
test (F=17.8) show signiicant differences (p=0.0001) between groups. Figure 1B shows the intervals of
tolerance (50%, 75% and 95%) of the CG, which was
considered a reference population for the PG. In terms
of hydration, the tolerance intervals revealed that
55.20% of the patients were out of the upper ellipsis
with a larger axis indicating dehydration; 10.30% were
in the lower quadrant, which indicates visible edema;
while 34.50% presented normal hydration within the
ellipsis’ 75% and 95%. The BIA’s vector analysis shows
that 52% of the patients presented reduced cell mass,
while 14.00% presented increased cell mass.
60
50
40
30
20
10
0
0 100 200 300 400 500 600
R/H, Ohm/m
X c/H, Ohm/
m
A 70
60
50
40
30
20
10
0
0 100 200 300 400 500 600
R/H, Ohm/m
X c/H, Ohm/
m
B
700 CG
PG
Rev. Latino-Am. Enfermagem 2013 Nov.-Dec.;21(6): 1240-7.
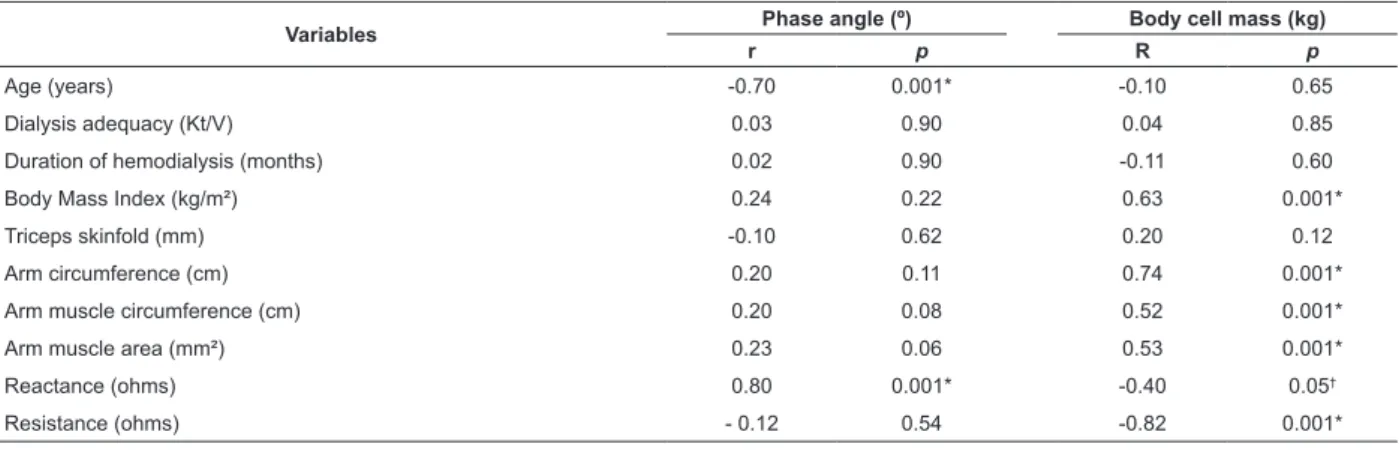
Table 3 - Correlation between Phase angle and Body cell mass, anthropometric markers and body composition
*p<0.001; †p≤0.05
The analysis of correlation indicates negative
and signiicant association between PA-age (r=-0.70,
p<0.001) and positive signiicant association between
PA-Xc (r=0.80, p<0.001). When BCM was correlated with
BMI (r =0.63, p<0.001), with AC (r=0.74, p<0.001),
with AMC (r=0.52, p<0.001), and with AMA (r=0.53,
p<0.001), associations were positive and signiicant
(Table 3).
Variables Phase angle (º) Body cell mass (kg)
r p R p
Age (years) -0.70 0.001* -0.10 0.65
Dialysis adequacy (Kt/V) 0.03 0.90 0.04 0.85
Duration of hemodialysis (months) 0.02 0.90 -0.11 0.60
Body Mass Index (kg/m²) 0.24 0.22 0.63 0.001*
Triceps skinfold (mm) -0.10 0.62 0.20 0.12
Arm circumference (cm) 0.20 0.11 0.74 0.001*
Arm muscle circumference (cm) 0.20 0.08 0.52 0.001*
Arm muscle area (mm²) 0.23 0.06 0.53 0.001*
Reactance (ohms) 0.80 0.001* -0.40 0.05†
Resistance (ohms) - 0.12 0.54 -0.82 0.001*
Discussion
The anthropometric measures along with BIA
and BIVA variables obtained from the chronic renal
patients undergoing hemodialysis and the healthy
individuals were signiicantly different. BIVA was a
unique method used to assess hydration and cell mass
and showed considerable variability of vectors for the
PG. Additionally, the anthropometric variables from the
patients submitted to hemodialysis were signiicantly
associated with body cell mass, (BCM) while no
association was found between these and the phase
angle (PA) (Table 3).
According to NKF (National Kidney Foundation)(15),
the anthropometric measures of patients undergoing
HD produce semi-quantitative estimates of body
components, provide information regarding the patients’
nutritional state and can also be compared to NHANES
II (National Health and Nutrition Examination Survey II)
or to data from healthy individuals. This study’s results
revealed signiicant differences for the triceps skinfold
(TSF) and arm circumference (AC), but not for the
arm muscle circumference (AMC) and arm muscle area
(AMA). It indicates that both groups present a similar
quantity of muscle tissue, though TSF, which is related
to fat tissue, was higher in the CG. It is also important
to note that the measure TSF in the PG was within the
expected considering the patients’ ages. The average
values found in the PG were similar to those found in
the literature(16), though only one study(17) presented the results stratiied by gender, which enabled a better
comparative analysis.
The principle of BIA is that body tissues provide
different oppositions to electric current passage(6).
Its integral components, resistance (R) and reactance
(Xc), are usually related to body water content and the
capacity of cells to store energy, respectively. Clinically,
R expresses the level of hydration and Xc relects the
nutritional state(3). Some studies, addressing chronic
renal patients undergoing HD, report R and Xc values
similar to those found in this study, 434.5-691 ohms
and 31-55 ohms, respectively(11,17). There is, however, a
study conducted with 58 Brazilian patients reporting R
above 700 ohms(16).
The Phase angle is a parameter that can be obtained
directly from BIA and does not depend on regression
equations to be estimated, which eliminates potential
sources of error(18). It is considered a useful tool in the
prognosis of renal patients(19) and its reference values,
according to age, have already been described in the
literature(20). In this study, 55.2% of the PG presented
PA below the expected, while 85% of the CG presented
values within the expected. PA is directly related to
cell membranes, which is represented by reactance.
PA values below the expected are consistent with
decreased reactance, cell death and rupture of selective
cell membranes, which suggest worse nutritional
age and PA was conirmed and is in agreement with other studies, though signiicant correlation with BMI
was not found. Individuals with higher BMI also present
a higher quantity of cells (muscle and fat cells) and their
results also relect higher PA. Additionally, PA can also
be considered a functional index and general health
indicator, especially as age advances(20).
The two groups presented similar demographic
characteristics and reliably characterize the differences
found in the body composition of patients with chronic
renal disease. Total body water (TBW), measured
using BIA, indicated the CG had a greater volume
of water compared to the PG. This information is
noteworthy since assessment was performed in the
weekly intermediary session and after therapy, which
usually takes from three to four hours and aims to
eliminate all the excess luid and urea, among other
substances, that were acquired between dialysis
sessions. BCM was lower in the PG indicating a smaller
reserve of muscle tissue, a fact that may be veriied
by the positive correlation with AC, AMC, AMA, and
BMI. BCM is clinically important because it facilitates
inding the appropriate “dry” weight and helps
identifying individuals at risk of malnutrition. Because
it is a parameter that indicates concentration of total
protein and intracellular water and is also considered
a metabolically active compartment, changes can
lead to reduced muscle tissue and dehydration in
addition to cardiovascular and respiratory alterations,
which in the long run can contribute to mortality
among these individuals(21). The greatest advantage
of using BCM is that it does not include extracellular
water by estimation, which is increased in individuals
with chronic renal disease, and frequently causes
overestimation of the nutritional value, that is, it may
falsely indicate hydration(21). These results can clinically
contribute to diet planning, both during intervention
and monitoring, aiming to improve patients’
nutritional state.
Vector analysis revealed that the PG vector
was longer and more inlected than the CG vector, in addition to signiicant differences in hydration and cell
mass (Figure 1). BIVA is a valuable tool for clinical use
given its safety, simple use, low cost and accuracy(5) and
can assist in the detection and monitoring of changes
in the body composition of HD patients. Monitoring the
hydration states of these patients contributes to the
control of PA, the severity of left ventricular hypertrophy
and residual renal function, which are risk factors for
mortality(22-23).
A study(9) veriied good sensitivity and speciicity for
the threshold of visible edema in HD patients in the low
portion of the ellipsis of tolerance of 75%. Five patients
were found in this study within this ellipsis with edema.
Even though the measures were taken after treatment,
many factors explain luid retention, such as increased luid intake, which limits the removal of overweight
during a single hemodialysis.
When data were plotted in the RXc graph, we noted
a large variation in most patients that remained out of
the ellipsis boundaries. Since BIA was not performed
before the HD session, analysis of these vectors’
behavior was not possible. Some factors, such as dialysis
adequacy, calculation of “dry” weight and duration of hemodialysis, can inluence water-electrolytes
balance and lead to changes in hydration, as observed
in this study(10).
Conclusions
This study revealed differences in the body
composition of patients and healthy individuals with
similar anthropometric characteristics (age, weight,
height and BMI). Anthropometry (AMC and TSF) failed
to establish differences in the measures of muscle
tissue between the two groups, unlike BIA and BIVA,
which safely reported differences. The results obtained
through vector analysis suggest this method can detect
changes in the body composition of HD patients and
favor monitoring of these patients in clinical practice.
Even though the bioimpedance parameters are not
the best markers for assessing body composition,
the method is reliable, practical and low costand
able to detect and assess changes in the level of
hydration and body cell mass of renal chronic patients
undergoing hemodialysis.
Study limitations
A limitation of this study is the fact that BIA
was performed only after the hemodialysis session.
If BIA had been performed before the HD session, it
could overestimate the patients’ level of hydration,
not consistent with their actual condition. Hence, an
analysis performed both before and after hemodialysis
with weekly or monthly monitoring would enable a
better clinical assessment of the patients’ hydration and
nutritional states. We also believe that vector analysis
pre and post BIA would help the clinical management
Rev. Latino-Am. Enfermagem 2013 Nov.-Dec.;21(6): 1240-7.
Another limiting factor that should be noted is the low
adherence of patients to the study and monitoring of
patients in longitudinal studies.
Even though not generalizable, this study’s results
are relevant because they were obtained from a
stratiied sample and can be used in meta-analyses to determine the levels of scientiic evidence and degree of
recommendation of BIA to clinically assess patients with
chronic renal disease undergoing hemodialysis.
We stress the need for more controlled studies
with a larger number of individuals, including studies
speciic for females, due to the histological and physiological differences of muscle ibers. Other
factors that should be addressed and controlled for in
studies on body composition are climate change and
seasonality of foods.
References
1. Beddhu S, Pappas LM, Ramkumar N, Samore
M. Effects of body size and body composition on
survival in hemodialysis patients. J Am Soc Nephrol.
2003;14(9):2366-72.
2. Wizemann V, Wabel P, Chamney P, Zaluska W, Moissl
U, Rode C, et al. The mortality risk of overhydration
in haemodialysis patients. Nephrol Dial Transplant.
2009;24(5):1574-79.
3. López-Gómez J. Evolución y aplicaciones de la
bioimpedancia en el manejo de la enfermedad renal
crónica. Nefrologia. 2011;31(6):630-4.
4. Frisancho AR. Triceps skin fold and upper arm muscle
size norms for assessment of nutrition status. Am J Clin
Nutrition. Oct 1974;27(10):1052-8.
5. Guldrís SC. Aplicaciones futuras de la bioimpedancia
vectorial (BIVA) en nefrología. Nefrología.
2011;31(6):635-43.
6. Eickemberg M, Oliveira CCd, Roriz AKC, Sampaio LR.
Bioimpedância elétrica e sua aplicação em avaliação
nutricional. Rev Nutrição. 2011;24:873-82.
7. Piccoli A, Rossi B, Pillon L, Bucciante G. Body fluid
overload and bioelectrical impedance analysis in renal
patients. Min Electrol Metabolism. 1996;22(1-3):76.
8. Agostini P, Calvert R, Subramanian H, Naidu B.
Is incentive spirometry effective following thoracic
surgery? Interactive Cardiovasc Thoracic Surg. 2008
Apr;7(2):297-300.
9. Piccoli A, Rossi B, Pillon L, Bucciante G. A new
method for monitoring body fluid variation by
bioimpedance analysis: the RXc graph. Kidney Int.
1994;46(2):534-9.
10. Piccoli A. Identification of operational clues to dry
weight prescription in hemodialysis using bioimpedance
vector analysis. Kidney Int. 1998;53(4):1036-43.
11. Mushnick R, Fein PA, Mittman N, Goel N,
Chattopadhyay J, Avram MM. Relationship of
bioelectrical impedance parameters to nutrition and
survival in peritoneal dialysis patients. Kidney Int.
2003;64:S53-S6.
12. Gibson RS. Principles of nutritional assessment.
USA: Oxford University Press; 2005.
13. World Health Organization. Obesity: Previning and managing the global epidemmic. Report of a WHO
consultation on obesity. Geneva; 1998.
14. Buchholz AC, McGillivray CF, Pencharz PB. Differences
in resting metabolic rate between paraplegic and
able-bodied subjects are explained by differences in body
composition. Am J Clin Nutrition. 2003;77(2):371-8.
15. National Kidney Foundation. Kidney Disease
Outcomes Quality Initiative. Clinical Practice Guidelines
for Chronic Kidney Disease: Evaluation, Classification,
and Stratification. Am J Kidney Dis. 2002;30(Suppl
1):1-226.
16. Kubrusly M, Oliveira CMC, Santos DCO, Mota RS,
Pereira ML. Análise comparativa entre a albumina pré-
e pós-dialise como indicadores do risco nutricional e
de morbimortalidade em hemodiálise. J Bras Nefrol.
2012;34:27-35.
17. Oliveira C, Kubrusly M, Mota RS, Silva CAB,
Choukroun G, Oliveira VN. The phase angle and mass
body cell as markers of nutritional status in hemodialysis
patients. J Renal Nutr. 2010;20(5):314-20.
18. Barbosa-Silva MCG, Barros AJD, Post CLA, Waitzberg
DL, Heymsfield SB. Can bioelectrical impedance
analysis identify malnutrition in preoperative nutrition
assessment? Nutrition. 2003;19(5):422-6.
19. Maggiore Q, Nigrelli S, Ciccarelli C, Grimaldi C, Rossi
GA, Michelassi C. Nutritional and prognostic correlates of
bioimpedance indexes in hemodialysis patients. Kidney
Int. 1996;50(6):2103-8.
20. Barbosa-Silva MCG, Barros AJD, Wang J, Heymsfield
SB, Pierson RN Jr. Bioelectrical impedance analysis:
population reference values for phase angle by age and
sex. Am J Clin Nutr. 2005;82(1):49-52.
21. Dumler F, Kilates C. Use of bioelectrical
impedance techniques for monitoring nutritional
status in patients on maintenance dialysis. J Renal
Nutr. 2000;10(3):116.
22. Machek P, Jirka T, Moissl U, Chamney P, Wabel P.
Guided optimization of fluid status in haemodialysis
Received: Dec. 13th 2012
Accepted: Aug. 21st 2013 23. Cheng LT, Chen W, Tang W, Wang T. Residual renal
function and volume control in peritoneal dialysis
patients. Nephron Clin Practice. 2006;104(1):c47-c54.
Erratum
Issue v21n6, page 1245
For
This study did not reveal differences in the body composition of patients and healthy individuals with similar anthropometric characteristics (age, weight, height and BMI).
Read