Integrated Features by Administering the Support
Vector Machine of Translational Initiations Sites
in Alternative Polymorphic Context
Nurul Arneida Husin1,2*, Nanna Suryana Herman1, Burairah Hussin1
1
Faculty of Information and Communication Technology Universiti Teknikal Malaysia Melaka (UTEM)
Durian Tunggal, Melaka, Malaysia
E-mails:[email protected], [email protected]
2
Genetics Laboratory, School of Science Monash University Sunway Campus Jalan Lagoon Selatan, Bandar Sunway 46150, Selangor Darul Ehsan, Malaysia E-mail:[email protected]
*
Corresponding author
Received: November 21, 2011 Accepted:April 6, 2012
Published: April 30, 2012
Abstract: Many algorithms and methods have been proposed for classification problems in
bioinformatics. In this study, the discriminative approach in particular support vector machines (SVM) is employed to recognize the studied TIS patterns. The applied discriminative approach is used to learn about some discriminant functions of samples that have been labelled as positive or negative. After learning, the discriminant functions are employed to decide whether a new sample is true or false. In this study, support vector machines (SVM) is employed to recognize the patterns for studied translational initiation sites in alternative weak context. The method has been optimized with the best parameters selected; c = 100, E = 10-6 and ex = 2 for non linear kernel function. Results show that with top 5 features and non linear kernel, the best prediction accuracy achieved is 95.8%. J48 algorithm is applied to compare with SVM with top 15 features and the results show a good prediction accuracy of 95.8%. This indicates that the top 5 features selected by the IGR method and that are performed by SVM are sufficient to use in the prediction of TIS in weak contexts.
Keywords: Kernel function, Algorithms, Non linear kernel, IGR method.
Introduction
Support Vector Machine (SVM) and kernel-based methods have been studied extensively to several of pattern classification problems. SVM are a set of supervised learning methods that analyse data and recognize patterns. The original SVM algorithm was invented by Vladimir Vapnik and his colleagues [2]. The theory behind SVMs is based on a transformation of data from the input space to a feature space [3]. Each instance in the training set contains one target value (i.e. the class labels) and several attributes (i.e. the features or observed variables). The goal of SVM is to produce a model (based on the training data) which predicts the target values of the test data given only the test data attributes.
set in fixed-length vector during the training process. Each example must have an associated binary label. The two different classes of data are termed positive and negative and the labels of the training examples are usually assigned a value of 1 or –1, respectively. If each vector contains m values, then the data will resides in an m-dimensional space called the input space. Once the transformation has been selected based on prior knowledge, a linear classification algorithm is used to find the hyperplane in the feature space that is going to classify the data [1, 5].
In the time of this research started, there is no study carried out on the applied SVM to TIS in weak or suboptimal context.
Materials and methods
The dataset
Two data sets are collected for this study. The first list of data set is provided by Dr. R. Sankararamakrishnan from Laboratory of Computational Biology, Indian Institute of Technology, India. It consists of 526 human mRNA sequences of Ref Seq which is originally extracted from Gen Bank NCBI database (Release 14).
The second data set is formed on EST data by self-extracting a number of well-characterized and annotated sequences from NCBI Gene bank database. The resulting set consists of 400 non-redundant EST data from human sequences. 200 sequences are extracted for negative samples while another 200 sequences for positive samples.
Feature generation
In this study, the amino acid patterns are applied and there will be 2×21k possible combination of κ-gram patterns. The frequency of κ-gram patterns is used as the value of this feature. In the framework of the new feature space, the initial nucleotides sequences need to be transformed to be able to interact with machine learning. The mRNA sequence containing ATG codon, a window is set for each ATG with the ATG in the center and 99 bases up-stream and 99 bases down-stream (excluding the ATG itself) aside. Amino acid sequences are converted into frequency sequence data under the description of the new features and are followed by the integration of a built classification model.
Each base is represented by a symbolic nucleotide; A, T, G, and C. This gives a total number of 201 positions in a weak context feature. The weak context of ATG is identified when pyrimidine base (T/C) is observed at positions –3 and A/T/C is observed at position +4 in translation regions. Four groups of features that are experimented are positional, Boolean, amino acid structure and properties.
Feature selection and integration
Information gain ratio (IGR) is employed to perform the feature selection tasks. The information gain ratio that is based on feature ranking measures the attributes with many values than those with few values. IGR solves the problems by introducing an extra term on how the features split the data. The Eqs. (1) and (2) demonstrate the features splitting process:
( , ) IG S A
2 1
( , )
d i
i
S S
SI S A log
S S
=
= −
∑
i, (2)
where Si are d subsets of examples resulting from partitioning S by the d-valued feature A. Since the SI term can be zero in some special cases, feature A is defined as
IGR (S, A) = IG (S, A) if SI (S, A) = 0.
For the most part, this improvement over IG proves significant in the present evaluation [10].
To achieve the goal to predict true functional sites, the next step is to integrate the selected features by a classification algorithm. The classification algorithm used in this study is support vector machine with linear, non-linear and radial basis kernel function. The purpose is to investigate which kernel best describes the prediction case study.
Data sequence transformation
In the sequence transformation, the frequency-grams for 20 amino acids are constructed in feature space generation. When κ = 1, namely the length of amino acid pattern is 1 bases long, there are 2×21*1 = 42. 1 gram pattern is generated for feature space. Therefore, there are 42 generated new features for amino acids patterns. The features from bio-knowledge are derived apart from the κ-gram patterns. These are based on the model of famous Kozak’s consensus matrix. The consensus motif from this matrix is GCC[ct]CCATG[atc] generated based on Kozak’s model, where (a) whether an A, T or C residue follow a true TIS, which indicates that a A/T/C appears in positions +4 of the original sequence windows; (b) a pyrimidines (C or T) tend to be found in 3 nucleotides upstream of a true TIS, which indicates that a C or T appears in positions -3 of the original sequence window. In stop codon feature, the frequencies of stop codon (3-grams: TAA, TAG, TGA) within 50 bases downstream and within 100 bases from the ATG is generated for each of the ATG window called stop50 and stop100 respectively.
Finally, 29 bio-knowledge patterns based on nucleotide positions, upstream ATG, stop codon, in frame ATG and chemical properties are constructed for whole datasets which are based on 7 Boolean features from nucleotide positions, stop codon, 2 from in frame ATG, upstream ATG and another 18 from chemical properties of amino acids. Chemical properties are taken into consideration to observe the chain of protein location within the amino acid sequence and to prove its function in an effective translation in a weak context. Each sample is a vector of 42 integers and 29 bio-knowledge, which sums up to a total of 71 numbers of features.
Significant features
Applying the information gain ratio feature evaluation method by 3-fold cross validation, the 15 features are selected according to their ranking. Table 1 shows the ranking positions of the 15 top ranked features based on IGR value.
Table 1. Features selected by IGR method
Feature Ranking
down_stop 1 up_3_[T] 2 up_–3_[C] 3 down_+4_[C] 4 down_hydrophilic 5 up_ambivalent 6 up_hydrophilic 7 down_acidic 8 up_internal 9 down_nonpolar 10 down_ambivalent 11 down_polar 12 down_basic 13 up_external 14 down_external 15
Fig. 1 Top charts for selected features
]
Environment for Knowledge Analysis” and written in Java as a multi-platform operating system programming language [9]. For target output comparison, confusion matrices and mean square error (MSE) and are used as the error function and performance value for the neural networks. They are defined as follows in Eqs. (3)-(5):
Sensitivity =
[
100 TP
TP+FN , (3)
Specificity =
[
]
100 TN
TN+FP , (4)
Accuracy =
[
]
100
TN TP
TP TN FP FN
+
+ + + , (5)
where TP is the number of true positive, TN is the number of true negative, FP is the number of false positive, and FN is the number of false negative.
True positive means pattern correctly assigned to ATG. True negative means pattern correctly assigned to non-ATG. False positive means pattern incorrectly assigned to ATG. False negative means pattern incorrectly assigned to non-ATG.
Results and discussion
To prove the effectiveness of this method as well as to recognize TIS with a very high accuracy, several steps are carried out on the selected dataset:
a. Conduct the computational cross validations in dataset I.
b. Select the best features and build the classification models in mRNA sequences of dataset I.
c. Build the classification models in dataset I via comparative accuracy.
d. Select and further compare the best kernel classifier with decision tree learning (J48). e. Test the built in model in experiment b to dataset II to obtain a testing accuracy.
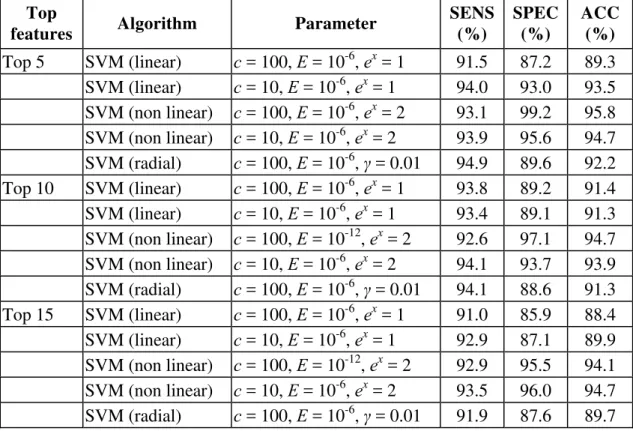
The 10-fold cross validation is applied to dataset I to get their prediction accuracy. Table 2 shows the results on the dataset I using the top features selected by information gain ratio.
The effectiveness of support vector machines on case studies is dependent on the selection of the kernel, the kernel’s parameter namely exponent value γ and soft margin parameter C. Best combinations of C and γ is often selected by a grid-search with exponentially growing sequences of C and γ as described in the equation below [4].
{
5 3 13 215}
2 , 2 , , 2 .
C∈ − − ... ;
{
15 13 1 23}
2− , 2− ,..., 2.
∈
γ (6)
draw the linear separation boundary in the transformed Euclidean feature space. Apart from that, the complexity of C will take effect on the computation time. For non linear kernel, the parameter for exponent value is 2.0. The parameter γ for the radial basis kernel is 0.01. Each combination of parameter choices is checked using cross validation (CV). The parameters with the best cross validation accuracy are picked as the best prediction model.
Table 2. Results on the dataset I using the top features selected by information gain ratio
Top
features Algorithm Parameter
SENS (%)
SPEC (%)
ACC (%)
Top 5 SVM (linear) c = 100, E = 10-6, ex = 1 91.5 87.2 89.3 SVM (linear) c = 10, E = 10-6, ex = 1 94.0 93.0 93.5 SVM (non linear) c = 100, E = 10-6, ex = 2 93.1 99.2 95.8 SVM (non linear) c = 10, E = 10-6, ex = 2 93.9 95.6 94.7 SVM (radial) c = 100, E = 10-6, γ = 0.01 94.9 89.6 92.2 Top 10 SVM (linear) c = 100, E = 10-6, ex = 1 93.8 89.2 91.4 SVM (linear) c = 10, E = 10-6, ex = 1 93.4 89.1 91.3 SVM (non linear) c = 100, E = 10-12, ex = 2 92.6 97.1 94.7 SVM (non linear) c = 10, E = 10-6, ex = 2 94.1 93.7 93.9 SVM (radial) c = 100, E = 10-6, γ = 0.01 94.1 88.6 91.3 Top 15 SVM (linear) c = 100, E = 10-6, ex = 1 91.0 85.9 88.4 SVM (linear) c = 10, E = 10-6, ex = 1 92.9 87.1 89.9 SVM (non linear) c = 100, E = 10-12, ex = 2 92.9 95.5 94.1 SVM (non linear) c = 10, E = 10-6, ex = 2 93.5 96.0 94.7 SVM (radial) c = 100, E = 10-6, γ = 0.01 91.9 87.6 89.7
The best prediction accuracy is achieved by using top 5 features selected with an information gain ratio of SVM non linear kernel at an accuracy of 95.8%, sensitivity of 93.1% and specificity of 99.2%. Note that there is no finding in previously reported results that had used the applied dataset with SVM classification method.
Comparison with decision tree learning (J48)
For comparison purposes, the classification method of decision tree (J48) is compared to the SVM with kernel function. Table 3 shows the prediction output.
Table 3. The results by 10 fold cross validations by decision tree learning on the dataset I with top 15 ranked features.
Data set
Algorith m
No correctly classified
No incorrectly
classified MSE
Accuracy (%)
I J48 504 22 0.1872 95.8
prediction accuracy on true ATG and false ATG with regards to their sensitivity (axis x) and specificity (axis y).
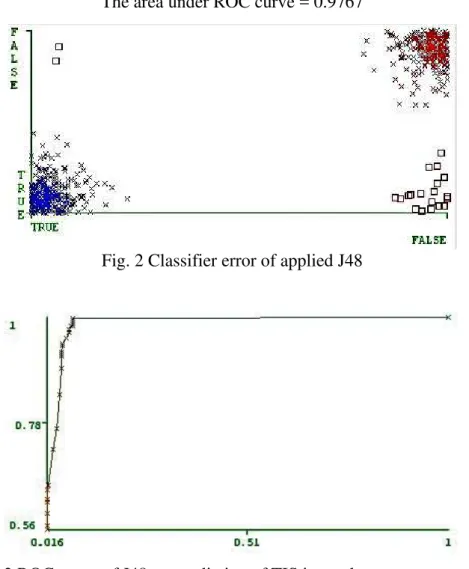
The area under ROC curve = 0.9767
Fig. 2 Classifier error of applied J48
Fig. 3 ROC curve of J48 on prediction of TIS in weak consensus context
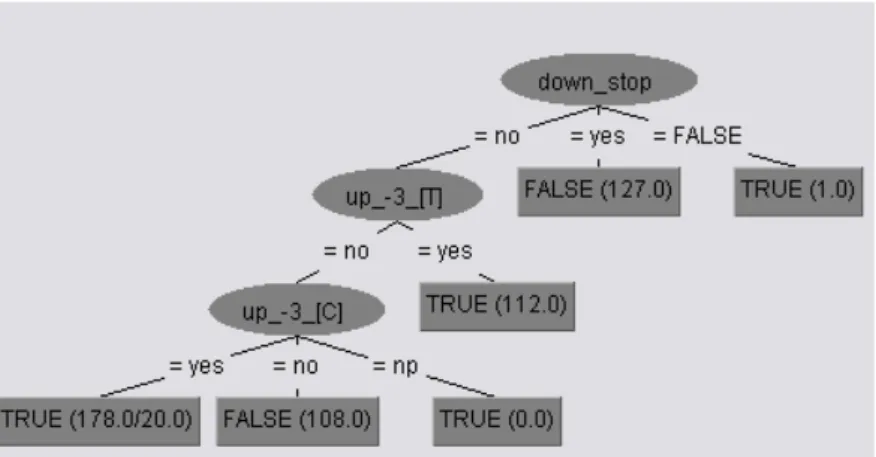
Decision trees can yield output comprehensive rules to disclose the essence of learning and predictions of TIS in weak context. Some interesting and biologically sensible rules with large coverage have been discovered:
Rule 1 : If down_stop = yes, then prediction is false ATG.
Rule 2 : If down_stop = no, up_–3_[T] = no, up_–3_[C] = no, then prediction is false ATG. Rule 3 : If down_stop = no, up_–3_[T] = yes, then prediction is true ATG.
Rule 4 : If down_stop = no, up_–3_[T] = no, up_–3_[C] = yes, then prediction is true ATG.
Fig. 4 An output tree for decision learning
Testing accuracy on EST sequences
In order to further evaluate the feasibility and robustness of our method, we tested the model built in experiment b to own prepared data (dataset II), which contains 400 EST sequences of Homo sapiens. These 200 sequences containing true TIS are used as a positive data in the experiment. Another 200 sequences containing false TIS are used as a negative data.
Using the linear kernel for testing, SVM provides an accuracy of 96.0%, which classified 384 corrected out of 400 instances in dataset II. Non-linear kernel with SVM predicted 351 correct out of 400 instances which brings a 88.0% of accuracy. While, when using radial kernel for testing, SVM gives 361 corrected prediction out of a total of 400 instances in dataset II.
Conclusion
Among three, non linear kernel outperforms the others in prediction accuracy and consistency. The best performance is shown by the non linear kernel with five top features selected by the IGR method. This indicates that a powerful SVM method can effectively find TIS in weak contexts if careful steps are taken to incorporate the significant biological knowledge into the selected kernel functions. In method comparison with SVM, J48 provides an easy, simple and not very sensitive to feature selection but it requires more involvement of features to recognise the signal.
Acknowledgement
The author is grateful to all lab members for discussion.
References
1. Collobert R., F. Sinz, J. Weston, L. Bottou (2006). Large Scale Transductive SVMs, Journal of Machine Learning Research, 7, 1687-1712.
2. Cortes C., V. Vapnik, (1995). Support Vector Networks, Machine Learning, 20, 273-297. 3. Cristianni N., J. S. Taylor (2000). An Introduction to Support Vector Machine,
Cambridge University Press.
6. Huang J., F. Wang, Y. Ou, M. Zhou (2009). A Semi-supervised SVM based Incorporation prior Biological Knowledge for Recognizing Translation Initiation Sites, IEEE World Congress on Computer Science and Information Engineering, 544-548. 7. Gao S., Y. Zhang (2009). Optimization of AdaBoost Algorithm by PSO and Its
Application in Translation Initiation Sites Prediction, Global Congress on Intelligent Systems IEEE, 564-568.
8. Liu H., H. Han, J. Li, L. Wong (2004). Using Amino Acid Patterns to Accurately Predict Translation Initiation Sites, In Silico Biology, 4(3), 255-269.
9. Hall M., E. Frank, G. Holmes, B. Pfahringer, P. Reutemann, I. H. Witten (2009). The WEKA Data Mining Software: An Update, SIGKDD Explorations, 11(1).
10. Tzanetakis G., G. Essl, P. Cook (2001). Automatic Musical Genre Classification of Audio Signals, Proceedings International Symposium on Music Information Retrieval (ISMIR), Bloomington, Indiana.
11. Zeng F., H. C. Yap, L. Wong (2002). Using Feature Generation and Feature Selection for Accurate Prediction of Translation Initiation Sites, Proceedings of 13th Workshop on Genome Informatics, Universal Academy Press, 192-200.
12. Zien A., G. Ratsch, S. Mika, B. Scholkopf, T. Lengauer, K. R. Muller (2000). Engineering Support Vector Machine Kernels that Recognize Translation Initiation Sites, Bioinformatics, 16(9), 799-807.
Mrs. Nurul Arneida Husin
E-mail: [email protected]
Nurul Arneida has received her B.Sc. in Biotechnology specialized in Molecular Biology from University Malaysia Sabah (UMS). Currently, she is working as a Senior Technical Officer in Genetics Laboratory at Monash University. Her current research interest is Data Mining and Predictive Analysis in Bioinformatics Research.
Prof. Nanna Suryana Herman, Ph.D.
E-mail: [email protected]
Prof. Madya Burairah Hussin, Ph.D.
E-mail: [email protected]
![Table 1. Features selected by IGR method Feature Ranking down_stop 1 up_3_[T] 2 up_–3_[C] 3 down_+4_[C] 4 down_hydrophilic 5 up_ambivalent 6 up_hydrophilic 7 down_acidic 8 up_internal 9 down_nonpolar 10 down_ambivalent 11 down_polar 12 down_b](https://thumb-eu.123doks.com/thumbv2/123dok_br/17257662.246115/4.892.107.787.344.957/features-selected-feature-hydrophilic-ambivalent-hydrophilic-nonpolar-ambivalent.webp)