www.biogeosciences.net/12/2861/2015/ doi:10.5194/bg-12-2861-2015
© Author(s) 2015. CC Attribution 3.0 License.
Biogeochemical indicators of peatland degradation –
a case study of a temperate bog in northern Germany
J. P. Krüger1, J. Leifeld2, S. Glatzel3, S. Szidat4, and C. Alewell1
1Environmental Geosciences, University of Basel, Bernoullistrasse 30, 4056 Basel, Switzerland
2Air Pollution/Climate Group, Agroscope Reckenholz-Tänikon ART, Reckenholzstrasse 191, 8046 Zürich, Switzerland 3Department of Geography and Regional Research – Geoecology, University of Vienna, Althanstrasse 14,
1090 Vienna, Austria
4Department of Chemistry and Biochemistry & Oeschger Centre for Climate Change Research, University of Bern,
Freiestrasse 3, 3012 Bern, Switzerland
Correspondence to:J. P. Krüger ([email protected])
Received: 1 October 2014 – Published in Biogeosciences Discuss.: 9 December 2014 Revised: 9 April 2015 – Accepted: 18 April 2015 – Published: 19 May 2015
Abstract. Organic soils in peatlands store a great propor-tion of the global soil carbon pool and can lose carbon via the atmosphere due to degradation. In Germany, most of the greenhouse gas (GHG) emissions from organic soils are at-tributed to sites managed as grassland. Here, we investigated a land use gradient from near-natural wetland (NW) to an ex-tensively managed (GE) to an inex-tensively managed grassland site (GI), all formed in the same bog complex in northern Germany. Vertical depth profiles ofδ13C,δ15N, ash content, C/N ratio and bulk density as well as radiocarbon ages were studied to identify peat degradation and to calculate carbon loss. At all sites, including the near-natural site,δ13C depth profiles indicate aerobic decomposition in the upper hori-zons. Depth profiles of δ15N differed significantly between sites with increasingδ15N values in the top soil layers paral-leling an increase in land use intensity owing to differences in peat decomposition and fertilizer application. At both grass-land sites, the ash content peaked within the first centime-tres. In the near-natural site, ash contents were highest in 10–60 cm depth. The ash profiles, not only at the managed grassland sites, but also at the near-natural site indicate that all sites were influenced by anthropogenic activities either currently or in the past, most likely due to drainage. Based on the enrichment of ash content and changes in bulk density, we calculated the total carbon loss from the sites since the peat-land was influenced by anthropogenic activities. Carbon loss at the sites increased in the following order: NW < GE < GI. Radiocarbon ages of peat in the topsoil of GE and GI were
hundreds of years, indicating the loss of younger peat mate-rial. In contrast, peat in the first centimetres of the NW was only a few decades old, indicating recent peat growth. It is likely that the NW site accumulates carbon today but was perturbed by anthropogenic activities in the past. Together, all biogeochemical parameters indicate a degradation of peat due to (i) conversion to grassland with historical drainage and (ii) land use intensification.
1 Introduction
In the temperate zone GHG emissions from peatlands under grassland use average 0.6 kg C m−2yr−1 for deeply
drained and 0.4 kg C m−2yr−1 for shallowly drained
peat-lands (IPCC, 2013). Ranked by land use intensity, inten-sively managed grasslands emit 2.8 kg CO2eqm−2yr−1and
extensively managed grasslands emit between 0.2 and 2.0 kg CO2eqm−2yr−1 (depending on the water table)
(Drösler et al., 2013). Near-natural bogs are almost climate-neutral, but dry bogs emit up to 1.0 kg CO2eqm−2yr−1
(Drösler et al., 2013).
To study soil degradation in different environments, sta-ble carbon and nitrogen isotopes are a useful tool (Schaub and Alewell, 2009; Alewell et al., 2011; Conen et al., 2013; Meusburger et al., 2013; Krüger et al., 2014). In two recent studies in the subarctic region, stable carbon isotope depth profiles were shown to be a meaningful indicator of peatland degradation as well as of the uplifting by permafrost (Alewell et al., 2011; Krüger et al., 2014).
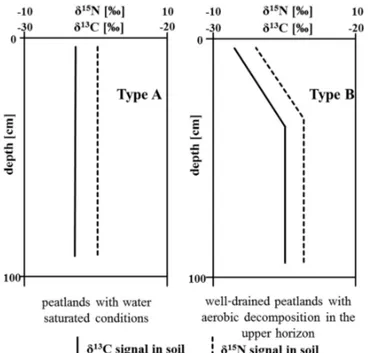
In a natural peatland with low decomposition rates, the δ13C signature is almost constant with depth because in water-saturated soils the oxygen availability is low, decom-position of organic material is reduced and therefore isotopic fractionation is small (Clymo and Bryant, 2008; Skrzypek et al., 2008; Alewell et al., 2011). However, under conditions of anaerobic decomposition,δ13C may slightly decrease with depth because substances such as lignin, which require aer-obic conditions for their decomposition, are relatively en-riched in13C (Benner et al., 1987; Alewell et al., 2011).
Un-der aerobic conditions, decomposers preferentially use the lighter12C for respiration. Hence, the heavier13C
accumu-lates in the remaining organic matter and theδ13C value in-creases with depth (Nadelhoffer and Fry, 1988; Ågren et al., 1996). Increasingδ13C values with depth are typical for well-drained or mineral soils (Nadelhoffer and Fry, 1988; Alewell et al., 2011). With a switch from anaerobic to aerobic condi-tions, peatland drainage is suggested to induce a change from a uniformδ13C depth profile to increasingδ13C values with depth (Fig. 1).
Because atmospheric N is the primary source of N in a nat-ural terrestrial ecosystem,δ15N values in bogs are assumed to scatter around 0 ‰ (Fig. 1; Jones et al., 2010; Broder et al., 2012). However, plant species in intact peatlands vary substantially in theirδ15N signature from−11.3 to+2.7 ‰ (Asada et al., 2005b), which could influence theδ15N signa-ture of the remaining peat material. A second source of vari-ability comes from nitrogen isotope fractionation during de-composition, leading to an enrichment of15N in the
remain-ing material and an increase in soil 15N with depth and age
(Nadelhoffer and Fry, 1988; Nadelhoffer et al., 1996). There-fore,δ15N values in oxic soils increase with depth (Fig. 1; Nadelhoffer et al., 1996; Kohzu et al., 2003). We hypothe-size that in drained and/or degraded peatlands, too, owing the above-mentioned processes,δ15N values increase with depth (Fig. 1). In intensively managed ecosystems, the application of mineral and/or organic fertilizer, with their different
iso-Figure 1.Theoretical concept ofδ13C andδ15N depth profiles in natural (left) and degraded (right) peatlands.
topic signals (Bateman and Kelly, 2007), additionally alters the stable nitrogen isotope signature in soil.
In natural peat profiles the radiocarbon signature shows an increasing age with depth (Shotyk et al., 1998) due to peat accumulation in the course of time. Owing to the loss of peat which has been accumulated in the last several hundreds or thousands of years, a degrading peatland, with a loss of the younger, more recently accumulated C of the upper layers to the atmosphere, changes the14C depth profile towards higher
ages near the peat surface.
The C/N ratio indicates the degree of the decomposition of the peat material (Malmer and Holm, 1984; Kuhry and Vitt, 1996). Peat that is only decomposed a little has larger C/N ratios, reflecting the former plant material, whereas the ratio becomes smaller in strongly decomposed peat owing to a preferential loss of C over N during microbial decomposi-tion.
A simple but reliable estimate of C loss from cultivated peatlands can be obtained based on differences in ash con-tent throughout the peat profile (Grønlund et al., 2008; Ro-giers et al., 2008; Leifeld et al., 2011a). These methods are based on the premise of the accumulation of mineral matter (or “ash”) with peat oxidation, i.e. preferential loss of organic vs. mineral matter. In a pristine state of a bog, where mineral input solely derives from the atmosphere, we assume a rela-tively homogeneous ash depth profile. Drainage induces peat oxidation and net CO2emission, leading to peat subsidence
not only C loss but also volumetric changes in the peat. It distinguishes between primary (settling) and secondary (ox-idation) subsidence of the peat after drainage (Ewing and Vepraskas, 2006).
The main goal of our study was to test whether stable isotopes of carbon and nitrogen can be used as indicators of peatland degradation along a gradient of land use and drainage intensity and whether we could estimate carbon loss a posteriori. We apply the above concepts to a typical and well-studied peatland complex, the Ahlen-Falkenberger peatland, in northern Germany. Our hypotheses are as fol-lows:
I. Theδ13C depth profile changes from a constant signal under near-natural conditions to increasingδ13C values with depth in degrading peatlands.
II. Higher decomposition of the peat in the degraded sites leads to an enrichment of15N values in the upper layers.
III. C losses are higher in the intensively managed com-pared to the extensively managed grassland.
Analysis of other indicators, such as radiocarbon age, ash content and C/N ratio, will be used for the validation of the interpretation of the stable isotope depth profiles.
2 Materials and methods 2.1 Site description
The study area is located in Lower Saxony, north-western Germany, close to the North Sea coast. The peat bog com-plex called Ahlen-Falkenberger peatland (53◦41′N, 8◦49′E)
is one of the largest peat bog complexes in northern Ger-many. The climate is humid Atlantic, with a mean annual precipitation of 925.7 mm and a mean annual temperature of 8.5◦C (reference period 1961–1990; German Weather
Ser-vice, 2010). Bog formation began at about 6000 years BP on a former fen area (Schneekloth, 1970). From the late 17th century onwards, peat was extracted at the edges of the bog. Drainage activities started at the beginning of the 20th century. In the middle of the 20th century, over 50 home-steads were established in the Ahlen-Falkenberger peatland and land use was intensified (Ahrendt, 2012). Industrial peat extraction at the Ahlen-Falkenberger peatland began in 1957 (Schneekloth, 1981) and was terminated in the 1990s, when a conservation area was established (Beckmann and Krahn, 1991; Beller et al., 1994). About 60 % of the remaining for-mer bog is currently used as grassland, and only a small area in the centre of the peat bog complex (approx. 5 %) was never drained or cultivated and remains as a natural peat bog today (Höper, 2007). In this area, vegetation is dominated by cross-leaved heath (Erica tetralix L.), flat-topped bog
moss (Sphagnum fallax(Klinggr.)) and common cotton grass
(Eriophorum angustifoliumHonck.). We consider this
near-natural wetland (NW) to be unmanaged. Further, we studied two areas of the former bog which are drained and today are managed as grassland: the extensive grassland (GE) is nei-ther fertilized nor manured and only cut once per year; the intensive grassland (GI) is cut four to five times per year and fertilized with mineral fertilizer and manure (see details for the years 2008/2009 in Beetz et al., 2013). Liming and cattle grazing was never performed on these sites. GI is drained by pipes as well as drainage ditches, whereas GE is only drained by ditches, which were closed in 2003/2004. At the NW site, the water table was around the soil surface with a variation of −10 to 5 cm in 2012 and fluctuated between the surface and 40 cm depth (GE) and between the surface and 80 cm depth (GI; Frank et al., 2014). Across the former bog complex, peat thicknesses range from 330 cm in cultivated to 515 cm in uncultivated, near-natural areas (Beetz et al., 2013). Recent GHG flux measurements at the Ahlen-Falkenberger peatland (July 2007– June 2009) indicate that site NW was C neu-tral in one year (−0.002 kg C m−2yr−1)and accumulated C in the next year (−0.124 kg C m−2yr−1; Beetz et al., 2013). The net ecosystem carbon balance at site GE was positive in one (0.088 kg C m−2yr−1)and negative in the following
year (−0.147 kg C m−2yr−1; Beetz et al., 2013). GI was a carbon source for both years with C loss of about 0.548 to 0.817 kg C m−2yr−1(Beetz et al., 2013).
2.2 Soil sampling and analyses
In November 2012, three peat cores per site were collected in the Ahlen-Falkenberger peatland at NW, GE and GI (n=3) (Fig. S1 in the Supplement). We took our cores close to the same locations from earlier studies by Beetz et al. (2013) and Frank et al. (2014). Peat samples were taken in the first 50 cm with a soil corer (Giddings Machine Company, US) and in deeper parts with a Russian peat corer (Eijkelkamp, Nether-lands) down to approximately 1 m. Cores were embedded in plastic shells, wrapped with plastic foil and transported di-rectly to the lab. Cores were cut into 2 cm sections and oven-dried at 40–50◦C for 72 h. All samples were ground and
ho-mogenized in a vibrating ball mill (MM 400, Retsch, Ger-many). Stable carbon and stable nitrogen isotopes as well as C and N content were measured by combined mass spec-trometry coupled to an SL elemental analyser (Integra2, Ser-con, UK). The C/N ratio represents the mass relationship between the carbon and nitrogen content of the bulk peat ma-terial. Stable carbon isotope ratios are reported asδ13C in per mill relative to the VPDB standard. Stable nitrogen isotope ratios are reported asδ15N in per mill relative to the atmo-spheric nitrogen standard. The analytical standard deviation is 0.15 and 0.1 % forδ15N andδ13C, respectively.
The ash content was determined by thermogravimetry (prepAsh, Precia, Switzerland), using 0.5–1.0 g sample ma-terial. Pre-drying at 130◦C was carried out to correct the dry
then heated to 600◦C in air until no significant mass change
(constant mass) could be measured (see detailed description of the method by Leifeld et al., 2011a). The material remain-ing after heatremain-ing is defined as the ash content of the sample.
2.3 Radiocarbon analyses
Radiocarbon (14C) analysis was performed with accelerator mass spectrometry (AMS) at the Laboratory for the Analy-sis of Radiocarbon with AMS (LARA) at the University of Bern (Szidat et al., 2014). At each site, three depths were se-lected for radiocarbon dating, and the14C content of samples
from these depths was measured for each individual core. Samples were selected after the evaluation of stable isotope and ash content depth profiles. Segments where stable iso-tope and ash contents clearly changed were selected for ra-diocarbon analysis. The ground and homogenized material was combusted, transformed into solid targets using auto-mated graphitization equipment (AGE; Nemec et al., 2010) and measured with the MIni CArbon DAting System MI-CADAS (Synal et al., 2007). Sample homogeneity and mea-surement reproducibility was proven by the double analysis of eight random samples, and general accuracy and precision had been reported earlier (Szidat et al., 2014).14C ages were
calibrated using the IntCal13 data set (Reimer et al., 2013). Samples with bomb signature were dated using the Bomb13 NH1 data set (Hua et al., 2013). Radiocarbon ages are pre-sented for each site and selected depth are given as means (n=3) with 1 SD in cal years AD or cal years BC. Results of the individual measurements are shown in Table S1 in the Supplement.
2.4 Calculation of carbon loss by the ash content and bulk density (combined method)
The integrated calculation of carbon loss of the peatland since the beginning of drainage is based on the simplified as-sumption that the ratio between carbon and ash content dur-ing the accumulation of peat is constant and that ash content before drainage is the same at all depths. After drainage, peat starts to oxidize and carbon is lost as CO2(Rogiers et al.,
2008). Additionally, we assume that the ash content in the deeper parts of the profile is not affected by drainage. Ash from the oxidized peat remains at the site and accumulates in the upper layer of the profile. Differences in soil properties of bulk density, ash content and organic C content between the topsoil and undisturbed subsoil can be used to infer pre-drainage soil thickness and C stocks. The mean ash content of the deeper parts of the profiles, where samples show no enrichment of ash, in our case below 80 cm depth, of each individual core was taken as a reference value (Leifeld et al., 2011a). The C loss was calculated separately for each core.
The method of Leifeld et al. (2014) combines two previ-ously published methods which were based on changes in bulk density (Leifeld et al., 2011b) and changes in ash
con-tent (Rogiers et al., 2008; Leifeld et al., 2011a) in peat pro-files. This so-called combined method (Leifeld et al., 2014) estimates the physical primary subsidence due to the loss of pore water and peat shrinkage and estimates the chemi-cal secondary subsidence due to the oxidative loss of organic matter.
The primary subsidenceSp (m) is calculated as follows
(Leifeld et al., 2014):
SP=PT0i−PTi, (1)
with
PT0i=BdOSi/BdOSr·PTi, (2)
where PT0i is the pre-drainage thickness of layer i (m), BdOSi is the organic-matter density in layer i, BdOSr is organic-matter density of the reference layer (g cm−3) and
PTi is the thickness of layeri(m) at the time of sampling. BdOS is calculated from the soil mass of per unit soil
vol-ume minus the ash mass and the ash volvol-ume of the same soil volume, assuming a specific density of ash particles of 2.65 g cm−3.
The secondary subsidenceSs is calculated from the
pre-drainage thickness ST0i (m) attributable to organic-matter oxidation (Leifeld et al., 2014):
ST0i=STi·Fashi/Fashr, (3)
with STi being the thickness of layer i (m), Fashi the ash concentration of layeri andFashr the ash concentration of
the reference layer.
Ss=ST0i−STi. (4)
Before drainage, any layer ST0i contained the same amount of carbon per soil volume as the contemporary undisturbed reference layers STrin the deeper soil profile. The amount of
soil carbon in any single layer Cdi(kg m−2) lost by oxidation is given as
Cdi =Ss·Cr/STr, (5)
with Cr being the soil carbon stock of the reference layer
(kg m−2), ST
r the thickness of the reference layer (m) and
Ss(m) the volumetric loss due to peat oxidation. Beside the
carbon loss, total peat subsidence (m) can be calculated by the combined method. Carbon losses since the peatland was drained are displayed as kg C m−2.
2.5 Statistical analyses
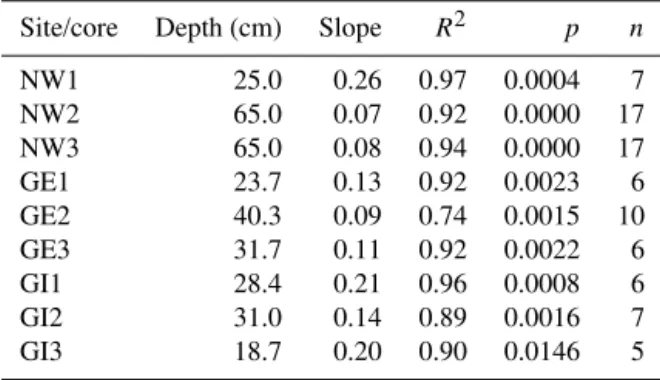
Spearman correlation analyses were used to identify the rela-tionship betweenδ13C,δ15N and C/N. Regression analysis ofδ13C and depth was carried out with the software R2.15.1. At each individual core,δ13C values against depth were used from the uppermost sample down untilδ13C reached a value below−25.0 ‰.
3 Results and discussion 3.1 Stable carbon isotopes
In both grassland soils, δ13C values increase from about −30.0 ‰ in the upper centimetres to about −25.0 ‰ in deeper layers (Fig. 2b, c). This increase inδ13C values with depth indicates aerobic conditions in the peat profile, as aer-obic decomposers selectively used the lighter isotope12C for
respiration, whereas the heavier 13C is enriched in the
re-maining organic material of the soil (Nadelhoffer and Fry, 1988; Ågren et al., 1996). Thisδ13C depth pattern was also found at site NW, indicating aerobic degradation (Fig. 2a). In general, natural peatlands are expected to show a uniform δ13C depth profile (Clymo and Bryant, 2008; Skrzypek et al., 2008) or a trend towards slightly lower values, caused by an enrichment of recalcitrant substances depleted in13C
(Ben-ner et al., 1987; Krull and Retallack, 2000; Alewell et al., 2011). The Suess effect could have contributed to the low δ13C values in the uppermost layer of the near-natural site, but the further increase in δ13C with depth is connected to peat material much older than the Suess effect and is very likely owing to aerobic decomposition of the peat. An in-crease in δ13C values with depth by about 4.0 to 5.0 ‰ is typical for well-drained mineral soils (Becker-Heidmann and Scharpenseel, 1986; Nadelhoffer and Fry, 1988) and is in ac-cordance with oxic grassland soils (Accoe et al., 2003).
In the upper layers of both grassland sites, depth profiles ofδ13C values are apparently compressed compared to NW (Fig. 2). A linear regression analysis withδ13C vs. depth re-veals a tendency towards steepest slopes of δ13C vs. depth at GI followed by GE and NW (Table 1). However, we do not regard this pattern as a quantitative indicator. Below the inversion at −25.0 ‰, δ13C values of all profiles remain more or less constant throughout the deeper profile, indi-cating low decomposition with limited fractionation (Clymo and Bryant, 2008).
3.2 Stable nitrogen isotopes
Theδ15N signal in peat soils is mainly driven by the follow-ing processes: vegetation input, decomposition, N deposition and fertilizer application. The δ15N values of a natural bog should be constant at around 0.0 ‰ because atmospheric N is the primary source of N (Jones et al., 2010; Broder et al., 2012).
Table 1.Slope, depth and coefficient of determination of regression
analyses betweenδ13C and depth until aδ13C value of−25.0 ‰ was reached in the depth profile. Three profiles of each site – near-natural (NW), extensively managed grassland (GE) and intensively managed grassland (GI) site – from the Ahlen-Falkenberger peat-land are presented. “n” refers to number of soil segments per site and replication included in the regression.
Site/core Depth (cm) Slope R2 p n
NW1 25.0 0.26 0.97 0.0004 7
NW2 65.0 0.07 0.92 0.0000 17
NW3 65.0 0.08 0.94 0.0000 17
GE1 23.7 0.13 0.92 0.0023 6
GE2 40.3 0.09 0.74 0.0015 10
GE3 31.7 0.11 0.92 0.0022 6
GI1 28.4 0.21 0.96 0.0008 6
GI2 31.0 0.14 0.89 0.0016 7
GI3 18.7 0.20 0.90 0.0146 5
At NW theδ15N values first increase and then decrease with depth (Fig. 3a). The inversion is located at ca. 20–40 cm depth, corresponding toδ15N values of−2.0 to−4.0 ‰. At the grassland sites, stable nitrogen isotopes decrease with depth in the first 20 cm of the soil and with no further clear trend in the deeper parts of the profile. In the first few cen-timetres of the GE profile,δ15N values are slightly positive and reach values of around−4.0 ‰ below 20 cm (Fig. 3b). At GIδ15N values are positive in the uppermost centimetres (up to 4.0 ‰) and decrease down to−10.5 ‰ in deeper lay-ers (Fig. 3c). Compared to GEδ15N is more variable at GI and reaches more negative values in the deeper part of the soil profile.
In natural peatlands, like NW, peat plant species show a wide range of δ15N values from below −11.0 to above +2.0 ‰ (Asada et al., 2005b), which may influence theδ15N values of the remaining peat material in the profile. Theδ15N depletion in the upper part of NW profiles may be assignable to the very lowδ15N values of the vegetation (Nordbakken et al., 2003; Bragazza et al., 2010). Sphagnum mosses are depleted in15N compared to atmospheric nitrogen and have
even lowerδ15N values in areas affected by agricultural ac-tivities (Bragazza et al., 2005). Incubation of peat mosses has shown a15N enrichment with time resulting in an
Figure 2.δ13C depth profiles at(a)the near-natural site (NW),(b)extensively used grassland site (GE) and(c)intensively used grassland
site (GI) at the Ahlen-Falkenberger peatland. Calibrated radiocarbon ages are displayed as mean calendar ages with 1 standard deviation (n=3) at their corresponding depth.
Figure 3.δ15N depth profiles at(a)the near-natural site (NW),(b)extensively used grassland site (GE) and(c)intensively used grassland
site (GI) at the Ahlen-Falkenberger peatland. Calibrated radiocarbon ages are displayed as mean calendar ages with 1 standard deviation (n=3) at their corresponding depth.
very lowδ15N values in wet (NH4)and dry (NH3)deposition (Bragazza et al., 2005).
δ15N depth profiles of our drained sites show a completely different depth pattern as hypothesized in our theoretical con-cept for drained peatlands (Fig. 1) and decrease rather than increase with depth (Fig. 3). Highδ15N of the topsoil in our grassland sites (Fig. 3) most likely indicates increased micro-bial activity, caused by drainage, in conjunction with effects from organic fertilizer application at GI. Decomposition is often linked to an enrichment of15N because of the
prefer-ential use of14N (Högberg, 1997; Novak et al., 1999; Kalbitz
et al., 2000). Increased microbial activity in the first centime-tres of the drained peatland leads to increased turnover of N, which results in an enrichment of15N (Kalbitz et al., 2000),
especially in the first 2–5 cm. It can therefore be postulated that the decomposition of peat material results in an enrich-ment of15N. This is one possible explanation for the higher
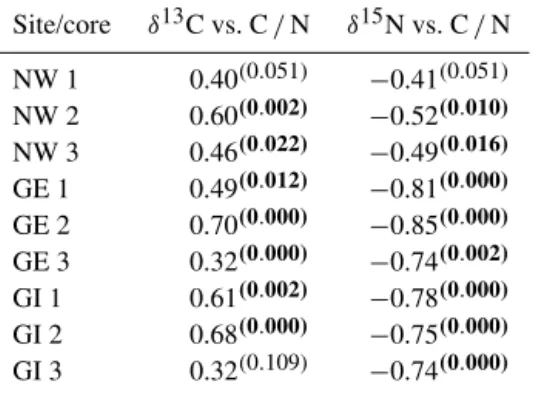
Table 2.Correlation coefficient andpvalue (p< 0.05 in boldface) betweenδ13C and C/N ratio as well as betweenδ15N and C/N ra-tio for the whole profile at the near-natural (NW), extensively man-aged grassland (GE) and intensively manman-aged grassland (GI) sites at the Ahlen-Falkenberger peatland.
Site/core δ13C vs. C/N δ15N vs. C/N
NW 1 0.40(0.051) −0.41(0.051)
NW 2 0.60(0.002) −0.52(0.010) NW 3 0.46(0.022) −0.49(0.016) GE 1 0.49(0.012) −0.81(0.000) GE 2 0.70(0.000) −0.85(0.000) GE 3 0.32(0.000) −0.74(0.002) GI 1 0.61(0.002) −0.78(0.000) GI 2 0.68(0.000) −0.75(0.000) GI 3 0.32(0.109) −0.74(0.000)
any effect at site NW. Organic fertilizer may also be enriched in15N (Watzka et al., 2006), which may contribute to higher δ15N values in the topsoil of GI. A study of nitrogen iso-topes from mineral and organic fertilizer demonstrated that organic fertilizer has a mean δ15N value of+8.5 ‰ (Bate-man and Kelly, 2007). However, GE, which does not receive any fertilizer, is also enriched in15N in the first centimetres
of the profile. We therefore assign the (smaller)15N
enrich-ment at GE to ongoing oxidative peat decomposition and the (stronger) 15N enrichment at GI to the combined effect of
peat decomposition and organic fertilizer applications.
3.3 Radiocarbon ages
Radiocarbon signatures from the upper peat layers (8–10 cm depth) of site NW indicate the presence of bomb carbon and organic matter fixed during the second half of the last cen-tury. This recent C accumulation of almost 1.0 kg C m−2in
approximately the last 50 years at NW is in accordance with the current GHG flux measurements (Beetz et al., 2013), showing that the bog has been sequestering carbon during recent years. In deeper parts (65–81 cm depth) of NW, mean peat ages range between 1328 and 1796 cal years AD. The small differences between the mean radiocarbon ages at 65 and 81 cm depth at NW represent an indicator for undis-turbed peat. They point to an average 16 cm of peat growth in approximately 62 years.
At both grassland sites, calibrated radiocarbon ages in the upper centimetres are much higher than at NW. This finding can be taken as an indicator for peat degradation and carbon loss. Drainage-induced carbon loss starts from the top, selec-tively removing younger peat and exposing older peat to the surface. We found > 500-year-old peat in the upper 14 cm at these sites. At 14 to 19 cm depth at GE and 27 to 34 cm depth at GI, the peat is almost 1000 and 1300 years old, respec-tively. Peat in deeper parts of the grassland profiles shows calibrated mean ages of 165 to 325 cal years AD and 313 to
34 cal years BC at GE and GI, respectively. The higher ages in the upper parts of the profile at GI indicate higher peat and C losses compared to the GE, when similar conditions in the peat profiles before onset of drainage are assumed. In com-parison to NW, peat in deeper parts of the two grassland sites is up to 1500 years older. The grassland sites have lost almost all peat that has accumulated in the last several centuries.
3.4 C/N ratio
At both grassland sites, C/N ratios are smaller in the up-per layers of the soil profile (Fig. S2), indicating strong mi-crobial transformation of the peat (Malmer and Holm, 1984; Kuhry and Vitt, 1996) and the possible influence of fertiliza-tion (GI). In most samples from NW and in deeper layers of GI and GE, C/N ratios are in the range considered typical for ombrotrophic peatlands (Kuhry and Vitt, 1996) and indi-cate low microbial activity.
3.5 Correlations between stable isotopes and soil C/N Decomposition affects both stableδ13C andδ15N by an en-richment of the heavier isotopes in the remaining soil organic matter as well as decreasing C/N ratio. A linear correlation between these parameters is expected if the material is in-fluenced by strong decomposition during peat formation or post-sedimentation (Wynn, 2007; Engel et al., 2010). How-ever, no correlation between the above-mentioned parame-ters will be found in well-preserved peat (Engel et al., 2010; Jones et al., 2010).
Stable isotopes and the C/N ratio correlate in a weakly positive way (r=0.40 to 0.60) and a weakly negative way (r= −0.41 to−0.52) at NW forδ13C andδ15N, respectively (see Table 2), indicating that the peat is not strongly decom-posed and/or that decomposition did not alter the original iso-tope signal (Sharma et al., 2005). Zaccone et al. (2011) also found a positive, albeit not significant correlation between δ13C and C/N in a well-preserved peat bog in the Swiss Jura mountains. At our grassland sites,δ13C and the C/N ratio correlate positively (r=0.32 to 0.70), andδ15N and the C/N ratio correlate negatively (r= −0.74 to−0.85), indi-cating that the peat is strongly decomposed.
3.6 Ash content and bulk density
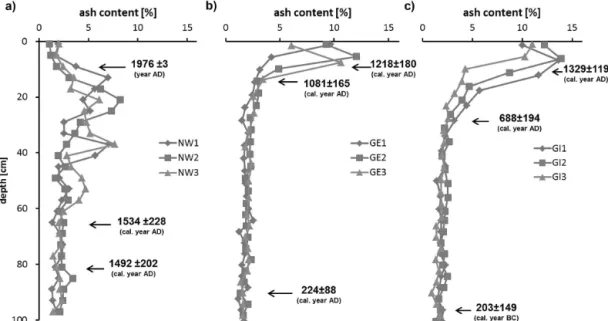
corre-Figure 4.Ash content depth profiles at(a)the near-natural site (NW),(b)extensively used grassland site (GE) and(c)intensively used
grassland site (GI) at the Ahlen-Falkenberger peatland. Calibrated radiocarbon ages are displayed as mean calendar ages with 1 standard deviation (n=3) at their corresponding depth.
Table 3.Biogeochemical parameters from the Ahlen-Falkenberger
peatland profiles as indicators of peatland degradation as well as peat and carbon loss.
Parameters Reliable indicator Quantification of for peat degradation? C loss possible?
δ13C yes no
δ15N yes no
Ash content yes∗ yes
14C age yes (yes)
C/N (yes) no
Bulk density (yes) (yes with ash content) Correlation betweenδ13C, yes no
δ15N and C/N
∗For bogs and assuming homogeneous atmospheric input.
sponds to the beginning of the first land use intensification in this peatland. Above and below this depth, the ash content is small, indicating less decomposed peat. High ash contents (Fig. 4b, c) and bulk densities (Fig. S3) in the first centime-tres of the profile at both grassland sites indicate peatland degradation and refer to recent and ongoing peat oxidation. In deeper layers of GE and GI, ash contents are constant and very low (Fig. 4) and are in the range of natural peatlands (Clymo, 1984) and also of deeper, undisturbed layers at NW.
3.7 Carbon loss
Carbon losses estimated by the combined method are high-est at GI, intermediate at GE and lowhigh-est at NW. The mean (±SD) C losses are 11.5 (±6.3), 18.8 (±2.8) and 42.9 (±10.9) kg C m−2 for NW, GE and GI, respectively. The C
loss at site NW may be attributed to the intensive drainage and peat extraction activities in the surrounding area in the last century, which may also have impaired the hydrology of this remaining bog. However, in recent years/decades, peat at NW has been accumulating C again (Beetz et al., 2013) and can therefore today be considered as a C sink. This is at-tributed to the current restoration activity within the context of the designation of a nature conservation area at this site with an accompanying increase in the water table (Beckmann and Krahn, 1991; Beller et al., 1994). The heath vegetation at NW, as is common for peat bogs in Germany, suggests a mild degradational stage (Ellenberg, 1954) with likely historical anthropogenic influences. The carbon loss of the grassland sites determined in this study is in accordance with higher measured GHG emissions at site GI than at site GE (Beetz et al., 2013). In general, the net GHG emission from exten-sively managed grasslands is smaller than from intenexten-sively managed grasslands, owing to a combination of smaller C exports and higher water tables (Drösler et al., 2013). The total carbon loss at these sites since the onset of drainage is comparable to drained peatlands in Switzerland under exten-sive management (Leifeld et al., 2011a).
3.8 Indicators of peatland degradation and quantification of C loss
All parameters (δ13C, δ15N, ash content, C/N ratio, bulk
Stable carbon isotope depth profiles indicate degradation at all sites at the peatland. At NW in the upper 10 cm and below 65 cm depth as well as in deeper parts of the grass-land sites,δ13C is constant with depth indicating natural peat. Stable nitrogen isotope, ash content and C/N ratio as well as bulk density depth profiles show a higher decomposition of the peat material in the upper part at the grassland sites as well as at 20–60 cm depth at NW. Theδ15N signal in the peat profiles is mainly driven by decomposition (GE and GI) and fertilizer application (GI). Radiocarbon ages andδ13C as well as ash content in the first centimetre of the NW depth profiles provide evidence for contemporary peat accumula-tion with young peat material formed in the last decades. Peat from topsoil segments of both grassland sites is much older than peat from deeper segments of the NW site. These data illustrate the consequences of peatland drainage that induces the loss of peat material which has been accumulated over the last centuries. The ash content in combination with bulk density and C content (combined method) gives reasonable estimates of C loss since the onset of drainage activities in this peatland.
Soil ash content and radiocarbon signatures have the po-tential to provide quantitative estimates of peatland carbon loss, whereas changes in stable isotope patterns and C/N ratios serve as qualitative indicators and support the under-standing of processes and mechanisms involved.
4 Conclusions
Depth profiles of different biogeochemical parameters to-gether provide a detailed insight into peatland formation and the effects of management on peat degradation.δ13C,δ15N, ash content, C/N ratio and bulk density as well as radio-carbon ages in peat depth profiles indicate degradation of all peatlands, but to very different degrees. Peat and C loss could be quantified by the combination of ash content and bulk den-sity and is supported by the radiocarbon ages.
I. Increasingδ13C values with depth indicate aerobic de-composition of the peat material at all sites.
II. At the near-natural site (NW), stable carbon isotope and ash content depth profiles as well as radiocarbon dat-ing indicate moderate degradation due to the drainage of the surrounding area in the past. Hence, also bogs con-sidered semi-natural were impaired by anthropogenic activities. Recent organic-matter accumulation, as indi-cated by the14C values, indicates the rehabilitation of
the peatland.
III. With the conversion to grassland, increasing peat de-composition and fertilizer application systematically al-ter theδ15N signature of the soil.
IV. Based on ash accumulation calculations, the three sites lost carbon in the following order: NW < GE < GI.
Higher losses under intensive management are sup-ported by (i) higher peat ages at this site and (ii) steeper slopes ofδ13C depth profiles.
The Supplement related to this article is available online at doi:10.5194/bg-12-2861-2015-supplement.
Acknowledgements. We would like to thank Sascha Beetz and
Katharina Krüger for support during field work. Thanks to Mark Rollog and Axel Birkholz for stable isotope analyses and Martin Zuber for ash content analyses. This work was supported financially by the Swiss National Science Foundation (SNF), project no. 200021-137569.
Edited by: Y. Kuzyakov
References
Accoe, F., Boeckx, P., Van Cleemput, O., and Hofman, G.: Relation-ship between soil organic C degradability and the evolution of the delta13C signature in profiles under permanent grassland, Rapid Commun. Mass Sp., 17, 2591–2596, doi:10.1002/rcm.1202, 2003.
Ågren, G. I., Bosatta, E., and Balesdent, J.: Isotope discrimination during decomposition of organic matter: A theoretical analysis, Soil Sci. Soc. Am. J., 60, 1121–1126, 1996.
Ahrendt, R.: Die Entdeckung des Ahlenmoores – Aneignungen einer Landschaft in der ersten Hälfte des 20. Jahrhunderts, Beiträge zur Geschichte und Kultur des Elbe-Weser-Raumes, Verlag des Landschaftsverband der ehemaligen Herzogtümer Bremen und Verden, Stade, 2012.
Alewell, C., Giesler, R., Klaminder, J., Leifeld, J., and Rollog, M.: Stable carbon isotopes as indicators for environmental change in palsa peats, Biogeosciences, 8, 1769–1778, doi:10.5194/bg-8-1769-2011, 2011.
Asada, T., Warner, B., and Aravena, R.: Effects of the early stage of decomposition on change in carbon and nitrogen isotopes in Sphagnumlitter, Journal of Plant Interactions, 1, 229–237, doi:10.1080/17429140601056766, 2005a.
Asada, T., Warner, B. G., and Aravena, R.: Nitrogen isotope signa-ture variability in plant species from open peatland, Aquat. Bot., 82, 297–307, doi:10.1016/j.aquabot.2005.05.005, 2005b. Asman, W. A. H., Sutton, M. A., and Schjørring, J. K.:
Ammo-nia: emission, atmospheric transport and deposition, New Phy-tol., 139, 27–48, 1998.
Bateman, A. S. and Kelly, S. D.: Fertilizer nitrogen iso-tope signatures, Isot. Environ. Health S., 43, 237–247, doi:10.1080/10256010701550732, 2007.
Becker-Heidmann, P. and Scharpenseel, H. W.: Thin layerδ13C and δ14C monitoring of “lessive” soil profiles, Radiocarbon, 28, 383– 390, 1986.
Beetz, S., Liebersbach, H., Glatzel, S., Jurasinski, G., Buczko, U., and Höper, H.: Effects of land use intensity on the full green-house gas balance in an Atlantic peat bog, Biogeosciences, 10, 1067–1082, doi:10.5194/bg-10-1067-2013, 2013.
Beller, J., Buchwald, C., and Döringshoff, J.: Pflege- und Entwick-lungsplan Halemer See und Dahlemer See mit Randzonen, End-bericht, edited by: BR Lüneburg AG„ Freiburg, 1994.
Benner, R., Fogel, M. L., Sprague, E. K., and Hodson, R. E.: De-pletion of 13-C in lignin and its implications for stable carbon isotope studies, Nature, 329, 708–710, 1987.
Bragazza, L., Limpens, J., Gerdol, R., Grosvernier, P., Hajek, M., Hajek, T., Hajkova, P., Hansen, I., Iacumin, P., Kutnar, L., Rydin, H., and Tahvanainen, T.: Nitrogen concentration and delta15N signature of ombrotrophic Sphagnum mosses at different N de-position levels in Europe, Glob. Change Biol., 11, 106–114, doi:10.1111/j.1365-2486.2004.00886.x, 2005.
Bragazza, L., Iacumin, P., Siffi, C., and Gerdol, R.: Seasonal vari-ation in nitrogen isotopic composition of bog plant litter during 3 years of field decomposition, Biol. Fert. Soils, 46, 877–881, doi:10.1007/s00374-010-0483-7, 2010.
Broder, T., Blodau, C., Biester, H., and Knorr, K. H.: Peat decom-position records in three pristine ombrotrophic bogs in south-ern Patagonia, Biogeosciences, 9, 1479–1491, doi:10.5194/bg-9-1479-2012, 2012.
Byrne, K. A., Chojnicki, B., Christensen, T. R., Drösler, M., Freibauer, A., Frolking, S., Lindroth, A., Mailhammer, J., Malmer, N., Selin, P., Turunen, J., Valentini, R., and Zetterberg, L.: EU Peatlands: current carbon stocks and trace gas fluxes, De-partment of Forest Science and Environment, Viterbo, Italy, 1– 58, 2004.
Clymo, R.: The limits to peat bog growth, Philos. T. R. Soc. B, 303, 605–654, 1984.
Clymo, R. S. and Bryant, C. L.: Diffusion and mass flow of dis-solved carbon dioxide, methane, and disdis-solved organic carbon in a 7-m deep raised peat bog, Geochim. Cosmochim. Ac., 72, 2048–2066, doi:10.1016/j.gca.2008.01.032, 2008.
Conen, F., Yakutin, M. V., Carle, N., and Alewell, C.: delta15N natural abundance may directly disclose perturbed soil when re-lated to C:N ratio, Rapid Commun. Mass Sp., 27, 1101–1104, doi:10.1002/rcm.6552, 2013.
Drösler, M., Freibauer, A., Christensen, T. R., and Friborg, T.: Ob-servations and Status of Peatland Greenhouse Gas Emissions in Europe, in: The Continental-Scale Greenhouse Gas Balance of Europe, edited by: Dolman, J., Valentini, R., and Freibauer, A., Springer, New York, 243–261, 2008.
Drösler, M., Adelmann, W., Augustin, J., Bergman, L., Beyer, C., Chojnicki, B., Förster, C., Freibauer, A., Giebels, M., Görlitz, S., Höper, H., Kantelhardt, J., Liebersbach, H., Hahn-Schöfl, M., Minke, M., Petschow, U., Pfadenhauer, J., Schaller, L., Schägner, P., Sommer, M., Thuille, A., and Werhan, M.: Klimaschutz durch Moorschutz, Schlussbericht des Vorhabens “Klimaschutz – Moornutzunsstrategien” 2006–2010, Freisingen, 2013. Ellenberg, H.: Naturgemäße Anbauplanung, Melioration und
Lan-despflege. Landwirtschaftliche Pflanzensoziologie III, Stuttgart, 109 pp., 1954.
Engel, Z., Skrzypek, G., Paul, D., Drzewicki, W., and Nývlt, D.: Sediment lithology and stable isotope composition of organic matter in a core from a cirque in the Krkonoše Mountains, Czech
Republic, J. Paleolimnol., 43, 609–624, doi:10.1007/s10933-009-9356-1, 2010.
Ewing, J. M. and Vepraskas, M. J.: Estimating primary and sec-ondary subsidence in an organic soil 15, 20, and 30 years after drainage, Wetlands, 26, 119–130, 2006.
Frank, S., Tiemeyer, B., Gelbrecht, J., and Freibauer, A.: High soil solution carbon and nitrogen concentrations in a drained At-lantic bog are reduced to natural levels by 10 years of rewetting, Biogeosciences, 11, 2309–2324, doi:10.5194/bg-11-2309-2014, 2014.
Grønlund, A., Hauge, A., Hovde, A., and Rasse, D. P.: Carbon loss estimates from cultivated peat soils in Norway: a compar-ison of three methods, Nutr. Cycl. Agroecosys., 81, 157–167, doi:10.1007/s10705-008-9171-5, 2008.
Högberg, P.: Tansley review No 95 – N-15 natural abun-dance in soil-plant systems, New Phytol., 137, 179–203, doi:10.1046/j.1469-8137.1997.00808.x, 1997.
Höper, H.: Freisetzung von Treibhausgasen aus deutschen Mooren, TELMA, 37, 85–116, 2007.
Hua, Q., Barbetti, M., and Rakowski, A. Z.: Atmospheric radio-carbon for the period 1950–2010, Radioradio-carbon, 55, 2059–2072, 2013.
IPCC: 2013 Supplement to the 2006 IPCC Guidlines for National Greenhosue Gas Inventories: Wetlands, 2013.
Jones, M. C., Peteet, D. M., and Sambrotto, R.: Late-glacial and Holoceneδ15N and δ13C variation from a Kenai Peninsula, Alaska peatland, Palaeogeography, Palaeoclimatology, Palaeoe-cology, 293, 132–143, doi:10.1016/j.palaeo.2010.05.007, 2010. Jungkunst, H. F., Krüger, J. P., Heitkamp, F., Erasmi, S., Fiedler, S.,
Glatzel, S., and Lal, R.: Accounting more precisely for peat and other soil carbon resources, in: Recarbonization of the biosphere – ecosystems and the global carbon cycle, edited by: Lal, R., Lorenz, K., Hüttl, R. F. J., Schneider, B. U., and von Braun, J., Springer, Amsterdam, Netherlands, 127–157, 2012.
Kalbitz, K., Geyer, S., and Gehre, M.: Land use impacts on the isotopic signature (C-13, C-14, N-15) of water-soluble ful-vic acids in a German fen area, Soil Sci., 165, 728–736, doi:10.1097/00010694-200009000-00006, 2000.
Kohzu, A., Matsui, K., Yamada, T., Sugimoto, A., and Fujita, N.: Significance of rooting depth in mire plants: evidence from nat-ural 15N abundance, Ecol. Res., 18, 257–266, 2003.
Krüger, J. P., Leifeld, J., and Alewell, C.: Degradation changes stable carbon isotope depth profiles in palsa peatlands, Biogeo-sciences, 11, 3369–3380, doi:10.5194/bg-11-3369-2014, 2014. Krull, E. S. and Retallack, G. J.:δ13C depth profiles from paleosols
across the Permian-Triassic boundary: Evidence for methane re-lease, Geol. Soc. Am. Bull., 112, 1459–1472, 2000.
Kuhry, P. and Vitt, D. H.: Fossil carbon/nitrogen ratios as a measure of peat decomposition, Ecology, 77, 271–275, 1996.
Leifeld, J., Gubler, L., and Grünig, A.: Organic matter losses from temperate ombrotrophic peatlands: an evaluation of the ash residue method, Plant Soil, 341, 349–361, doi:10.1007/s11104-010-0649-y, 2011a.
Leifeld, J., Müller, M., and Fuhrer, J.: Peatland subsidence and car-bon loss from drained temperate fens, Soil Use Manage., 27, 170–176, doi:10.1111/j.1475-2743.2011.00327.x, 2011b. Leifeld, J., Bader, C., Borraz, E., Hoffmann, M., Giebels, M.,
and flux budget approach, Biogeosciences Discuss., 11, 12341– 12373, doi:10.5194/bgd-11-12341-2014, 2014.
Maljanen, M., Hytonen, J., and Martikainen, P. J.: Fluxes of N2O, CH4and CO2on afforested boreal agricultural soils, Plant Soil, 231, 113–121, doi:10.1023/a:1010372914805, 2001.
Malmer, N. and Holm, E.: Variation in the C/N-quotient of peat in relation to decomposition rate and age determination with 210 Pb, Oikos, 171–182, 1984.
Meusburger, K., Mabit, L., Park, J.-H., Sandor, T., and Alewell, C.: Combined use of stable isotopes and fallout radionuclides as soil erosion indicators in a forested mountain site, South Korea, Biogeosciences, 10, 5627–5638, doi:10.5194/bg-10-5627-2013, 2013.
Nadelhoffer, K., Shaver, G., Fry, B., Giblin, A., Johnson, L., and McKane, R.: 15N natural abundances and N use by tundra plants, Oecologia, 107, 386–394, 1996.
Nadelhoffer, K. J. and Fry, B.: Controls on Natural Nitrogen-15 and Carbon-13 Abundances in Forest Soil Organic Matter, Soil Sci. Soc. Am. J., 52, 1633–1640, doi:10.2136/sssaj1988.03615995005200060024x, 1988. Nemec, M., Wacker, L., and Gaggeler, H.: Optimization of the
graphitization process at AGE-1, Radiocarbon, 52, 1380–1393, 2010.
Nordbakken, J., Ohlsen, M., and Högberg, P.: Boreal bog plants: nitrogen sources and uptake of recently deposited nitrogen, Env-iron. Pollut., 126, 191–200, doi:10.1016/s0269-7491(03)00194-5, 2003.
Novak, M., Buzek, F., and Adamova, M.: Vertical trends in
δ13C,δ15N andδ34S ratios in bulk Sphagnum peat, Soil Biol.
Biochem., 31, 1343–1346, 1999.
Reimer, P. J., Bard, E., Bayliss, A., Beck, J. W., Blackwell, P. G., Ramsey, C. B., Buck, C. E., Cheng, H., Edwards, R. L., Friedrich, M., Grootes, P. M., Guilderson, T. P., Haflidason, H., Hajdas, I., Hatte, C., Heaton, T. J., Hoffmann, D. L., Hogg, A. G., Hughen, K. A., Kaiser, K. F., Kromer, B., Manning, S. W., Niu, M., Reimer, R. W., Richards, D. A., Scott, E. M., Southon, J. R., Staff, R. A., Turney, C. S. M., and van der Plicht, J.: Intcal13 and Marine13 radiocarbon age calibration curves 0–50 000 years cal BP, Radiocarbon, 55, 1869–1887, 2013.
Rogiers, N., Conen, F., Furger, M., Stöckli, R., and Eugster, W.: Impact of past and present land-management on the C-balance of a grassland in the Swiss Alps, Glob. Change Biol., 14, 2613– 2625, doi:10.1111/j.1365-2486.2008.01680.x, 2008.
Schaub, M. and Alewell, C.: Stable carbon isotopes as an indica-tor for soil degradation in an alpine environment (Urseren Val-ley, Switzerland), Rapid Commun. Mass Sp., 23, 1499–1507, doi:10.1002/rcm.4030, 2009.
Schneekloth, H.: Das Ahlen–Falkenberger Moor – eine moorge-ologische Studie mit Beiträgen zur Altersfrage des Schwarz-/Weißtorfkontaktes und zur Stratigraphie des Küstenholozäns, Geologisches Jahrbuch, edited by: Lang, D. H., Hannover, 1970. Schneekloth, H.: Die Moore in Niedersachsen, in Bereich der Blät-ter NeumünsBlät-ter, Helgoland Emden und Lingen der Geologis-chen Karte der Bundesrepublik Deutschland (1:200000), Göt-tinger Tageblatt, Göttingen, 1981.
Sharma, S., Mora, G., Johnston, J. W., and Thompson, T. A.: Stable isotope ratios in swale sequences of Lake Supe-rior as indicators of climate and lake level fluctuations dur-ing the Late Holocene, Quaternary Sci. Rev., 24, 1941–1951, doi:10.1016/j.quascirev.2004.11.009, 2005.
Shotyk, W., Weiss, D., Appleby, P., Cheburkin, A., Frei, R., Gloor, M., Kramers, J., Reese, S., and Van Der Knaap, W.: History of atmospheric lead deposition since 12 370 14C yr BP from a peat bog, Jura Mountains, Switzerland, Science, 281, 1635– 1640, 1998.
Skrzypek, G., Paul, D., and Wojtun, B.: Stable isotope composition of plants and peat from Arctic mire and geothermal area in Ice-land, Polish Polar Res., 29, 365–376, 2008.
Synal, H.-A., Stocker, M., and Suter, M.: MICADAS: a new com-pact radiocarbon AMS system, Nuclear Instruments and Meth-ods in Physics Research Section B: Beam Interactions with Ma-terials and Atoms, 259, 7–13, 2007.
Szidat, S., Salazar, G. A., Vogel, E., Battaglia, M., Wacker, L., Synal, H.-A., and Türler, A.: 14C Analysis and Sample Preparation at the New Bern Laboratory for the Analysis of Radiocarbon with AMS (LARA), Radiocarbon, 56, 561–566, doi:10.2458/56.17457, 2014.
Watzka, M., Buchgraber, K., and Wanek, W.: Natural 15N abun-dance of plants and soils under different management practices in a montane grassland, Soil Biol. Biochem., 38, 1564–1576, doi:10.1016/j.soilbio.2005.11.007, 2006.
Wynn, J. G.: Carbon isotope fractionation during decomposition of organic matter in soils and paleosols: Implications for paleoe-cological interpretations of paleosols, Palaeogeogr. Palaeoecol., 251, 437–448, doi:10.1016/j.palaeo.2007.04.009, 2007. Yu, Z., Beilman, D. W., Frolking, S., MacDonald, G. M., Roulet, N.
T., Camil, P., and Charman, D. J.: Peatlands an Their Role in the Global Carbon Cycle, EOS, 92, 97–106, 2011.