www.ann-geophys.net/30/703/2012/ doi:10.5194/angeo-30-703-2012
© Author(s) 2012. CC Attribution 3.0 License.
Annales
Geophysicae
Communica
tes
A remarkable correlation between short period gravity waves and
semiannual oscillation of the zonal wind in the equatorial mesopause
region
N. Venkateswara Rao1, T. Tsuda1, and Y. Kawatani2
1Research Institute for Sustainable Humanosphere, Kyoto University, Uji, Japan 2Japan Agency for Marine-Earth Science and Technology, Yokohama, Japan
Correspondence to:N. Venkateswara Rao ([email protected])
Received: 10 January 2012 – Accepted: 5 April 2012 – Published: 19 April 2012
Abstract. The variability of zonal winds and the horizontal wind velocity variance of short period (20–120 min) gravity waves (GWs) in the equatorial mesopause region are stud-ied using medium frequency (MF) radar observations from Pameungpeuk (7.4◦
S, 107.4◦
E) during 2004–2010. The zonal winds display a distinct semiannual oscillation (called mesospheric semiannual oscillation, MSAO), with westward winds during equinoxes and eastward winds during solstices. Furthermore, the westward winds during March equinox are larger during 2008 and 2009. The short period GW vari-ance also shows a semiannual oscillation with enhvari-anced ac-tivity during equinoxes. A good correlation is observed be-tween the zonal winds and the short period GW variance from 2008–2010, with the winds being westward during the times of enhanced GW activity. Such a correlation, however, is less obvious during 2004–2006. The long period (10–20 h) GW variance, on the other hand, does not show such a corre-lation throughout the observation period.
Keywords. Meteorology and atmospheric dynamics (Mid-dle atmosphere dynamics; Waves and tides) – Radio science (Remote sensing)
1 Introduction
Gravity waves (GWs) generated in the lower atmosphere propagate upward and reach significant amplitudes by the time they reach the mesosphere and lower thermosphere (MLT) region. Consequently, they break/dissipate due to convective and dynamical instabilities, resulting in acceler-ation of the background wind and modificacceler-ation of the
ther-mal structure and general circulation in that region (Fritts and Alexander, 2003). Gravity waves can further propagate into the ionosphere and play an important role in the formation of quasi-periodic echoes in the E region (e.g. Venkateswara Rao et al., 2008) and equatorial plasma irregularities in the F region (e.g. Taori et al., 2011). The upward propagating grav-ity waves, before reaching the MLT region, undergo critical level interaction with background winds at various levels of the atmosphere, depending on the wave phase velocity rela-tive to the background winds, such as the Tropical Easterly Jet (TEJ), quasi-biennial oscillation (QBO) and stratopause semiannual oscillation (SSAO) in the stratosphere.
Zonal-mean zonal winds in the tropical mesosphere ex-hibit a prominent semiannual oscillation, with westward winds during equinoxes and eastward winds during solstices, called the mesospheric semiannual oscillation (MSAO) (Hi-rota, 1978). The MSAO has been studied through various ground and satellite-based wind and temperature measure-ments (Burrage et al., 1996; Garcia et al., 1997; Sridharan et al., 2007). These studies have shown that the westward phase of the MSAO is symmetric over the equator and the westward wind during the March equinox undergoes large inter-annual variability. The MSAO is considered to be wave-driven by model studies, including the effects of small-scale gravity waves, intermediate-scale Kelvin and inertia-gravity waves, diurnal tide deposition, as well as forcing due to meridional advection (Dunkerton, 1982; Lieberman and Hays, 1994; Sassi and Garcia, 1997; Richter and Garcia, 2006).
Gurubaran and Rajaram (2001) studied the mean winds, tides and GWs over Tirunelveli (8.7◦
N, 77.8◦
704 N. Venkateswara Rao et al.: Short period gravity waves and semiannual oscillation of the zonal wind
contributes to the variation of the strength of the time-mean westward flow. There also exist some long-term studies on the relation between the zonal winds and GW activity (Of-fermann et al., 2011; Hoffmann et al., 2011). A study by Hoffmann et al. (2011) shows that the trends in zonal wind at 75 km correlates with that of GW activity at altitudes above 80 km.
Different models consider different sources as drivers and tune to reproduce the observed MSAO; yet, the driving sources of this oscillation are not well-understood. Currently, there is considerable ambiguity on the driving sources of the MSAO. In this context, the present results will help in better understanding the MSAO and its relation to GWs.
2 Data
The MLT wind data used in this study were acquired us-ing a medium frequency (MF) radar located at Pameung-peuk (7.4◦
S, 107.4◦
E), Indonesia (Venkateswara Rao et al., 2011a, b). This radar operates at a frequency of 2.008 MHz with a peak power of 30 kW. The antenna array, consisting of three antennas arranged in an equilateral triangle, is used for both transmission and reception. This radar measures winds using the spaced antenna technique, in the height range of 78–98 km, with resolutions of 2 km in height and 2 min in time. The data acceptance rate is highest at∼88 km. In the present study, we use the Pameungpeuk MF radar data col-lected from April 2004 to December 2010. The radar was not in operation during 10 August 2004 to 6 November 2004, 7– 28 July 2005, and 13 February 2007 to 2 October 2007. Dur-ing 16 August 2006 to 16 January 2007, the data are sparse and hence not used for the present study.
The method of GW variance calculation is as follows. High resolution (1–2 min) horizontal wind data acquired by the MF radar are averaged to get 10 min interval data. Short data gaps in the 10 min time series were linearly interpolated. From this dataset, contributions from diurnal, semi-, ter-, and quarter-diurnal tides are removed (Venkateswara Rao et al., 2011b). Then, GW variance is calculated for three bands of periods (20–120 min, 2–10 h, 10–20 h). For calculating the GW variance in the short period band (20–120 min), a block of three hours (which contains 18 data points), sliding for-ward by one hour, is subjected to Butterworth high-pass filter (of order 5) with a cut off of 120 min. Variance is then calcu-lated from this filtered output and attributed to the middle of each three-hour interval. In this manner, we calculate short period GW variance for 24 h. Daily variance is calculated by averaging the hourly variances. For calculating the GW variance in 2–10 h and 10–20 h period bands, we use a data block of two days and subjected to band pass filter.
3 Results
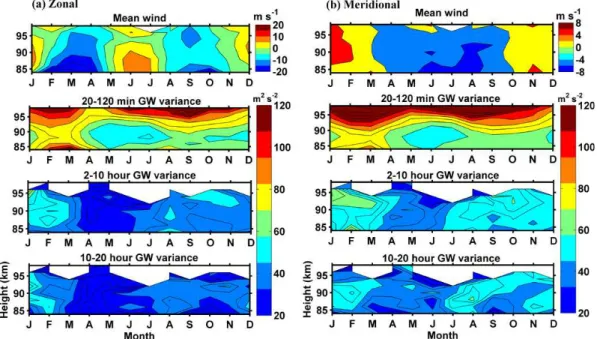
Six-year (2004–2006 and 2008–2010) composites (average at each month of all years) of monthly-averaged mean winds (top panel), GW variance in the 20–120 min band (second panel), in the 2–10 h band (third panel), and in the 10–20 h band (fourth panel) are shown in Fig. 1a and b for the zonal and the meridional components, respectively. The white space in Fig. 1a and b represents the data gaps due to lack of a sufficient number of data points to compute the six-year composite of GW variance. Accordingly, we will not discuss the winds and short period GW variance at higher altitudes and thus confine to altitudes<∼94 km. The zonal winds in Fig. 1a display a distinct semiannual oscillation, with west-ward winds during equinoxes and eastwest-ward winds during sol-stices. Furthermore, the peak westward winds around March equinox are larger than those around September equinox. The meridional winds in Fig. 1b show a clear annual oscilla-tion (AO), with southward winds from the middle of March to October and northward winds for the rest of the time.
The 20–120 min GW variance (second panel) in the zonal wind shows a semiannual oscillation, with primary enhance-ment during March equinox and secondary enhanceenhance-ment during September equinox. The 20–120 min GW variance in the meridional component also shows a similar variabil-ity, with the meridional variance being larger than the zonal component above ∼92–93 km. The zonal component of GW variance in 2–10 h band shows some seasonal variation, with less variance during the middle of March to July, com-pared to rest of the year. Largest variance is observed be-tween January and March. The meridional component also shows similar variation, except that the enhanced GW ac-tivity between January and March is little larger than that in the zonal component. The GW variance is also larger between July and December. The GW variance in 10–20 h band also shows similar seasonal variation to that of 2–10 h band, with enhanced variance during January–February in the zonal component and during January–March and July– December (changes with height) in the meridional compo-nent.
The zonal wind shows predominantly the SAO and the meridional wind shows the AO. Furthermore, the short pe-riod GW variance also shows the SAO, similar to zonal wind. Since the zonal wind and short period GW variance have sim-ilar seasonal variation, we will focus on the relation between the two in the present study, neglecting the meridional wind. Further, since the GW variance in each band is nearly simi-lar in both the zonal and the meridional components, we will compute a total GW variance in each band, by averaging the GW variance in the two components (u′2+v′2)/2.
Fig. 1.A six-year (2004–2006 and 2008–2010) composite of monthly- averaged mean winds (top panel), GW variance in the 20–120 min band (second panel), in the 2–10 h band (third panel), and in the 10–20 h band (fourth panel) for(a)zonal and(b)meridional components, respectively.
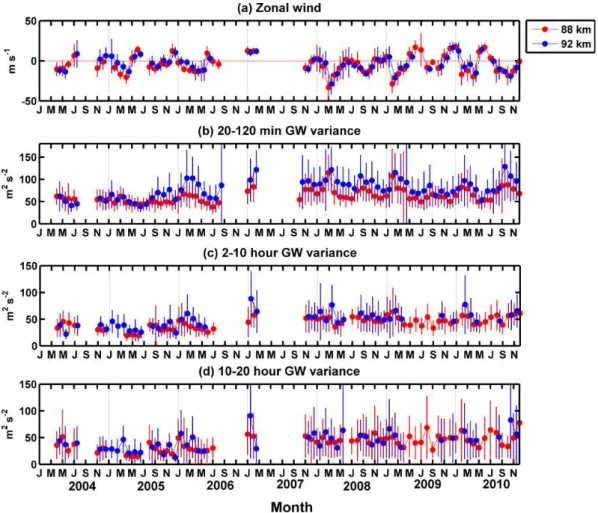
Note that, to increase clarity, the values at 92 km are shifted forward by 0.5 months. The vertical lines at each data point represent standard deviations for the monthly mean values. The zonal winds in Fig. 2a display a clear semiannual oscilla-tion in all years, with westward winds during equinoxes and eastward winds during solstices. Further, in each year the first westward cycle of the oscillation is generally stronger than the second one, except during 2010 where amplitudes of both the cycles are nearly equal. For eastward winds, both cycles have nearly equal amplitudes throughout the observa-tion period. While the peak westward winds are stronger than the peak eastward winds in 2008 and 2009, they are nearly equal in 2005 and 2010. In 2004, 2006 and 2007, the data are not sufficient to bring out this kind of variability. The standard deviation in monthly mean zonal winds is generally 4–10 m s−1and with a maximum of 20 m s−1.
The winds during 2008 show an anomalous behavior, be-ing westward for most of the time. Thus, the annual mean zonal wind during 2008 is more negative (−7.25 m s−1) than during 2009 (−0.79 m s−1) and 2010 (−3.73 m s−1). In 2005 also, the annual mean winds are westward (−4.2 m s−1). Al-though the semiannual oscillation is clearly observed during all three years, in 2008 the winds remain westward, despite the SAO.
Monthly mean short period (20–120 min) GW variance, shown in Fig. 2b, is less during 2004–2005 than in 2006 and 2008–2010. Further, during the 2008–2010 period, the GW variance shows distinct semiannual variation, with enhanced variance during equinoxes. From 2008 to 2009 the GW vari-ance shows an equinoxial asymmetry, with a larger varivari-ance
in February–March than in September–October. In 2010, however, the variance during September–October is slightly larger than during February–March. The large data gaps in 2004, 2006, and 2007 preclude comments about the semian-nual variability of GW activity in these years. The monthly mean errors are, in general, in the range of 20–60 m2s−2.
Figures 2c and d correspond to GW variance in 2–10 h and 10–20 h bands. The GW variance in 2–10 h band shows some enhancement in March equinox in 2006, and between 2008 and 2010. In the 2–10 h band, however, the seasonal vari-ation is less systematic, compared to the short period GW variances in Fig. 2b, with no enhancement in September– October. The GW variance in the 10–20 h band shows en-hancement during January 2006, January and August 2009, and July, February, August and December 2010. Although the total variance is shown here, individual variances of zonal and meridional components also show nearly similar behav-ior, as illustrated in Fig. 1.
The most interesting aspect in Fig. 2 is the relation be-tween the zonal winds (Fig. 2a) and the short period GW variance (Fig. 2b). During 2004–2006, the zonal winds and the GW variance do not show any systematic relation. During 2008–2010, however, there is a systematic relation between the two, with the winds becoming westward dur-ing the times of enhanced GW variance. Between 2008 and 2010, the short period GW variance (in Fig. 2b) dur-ing the March equinox at 88 km decreases, with a variance of 115 m2s−2in 2008 to 107 m2s−2in 2009 and 82 m2s−2
706 N. Venkateswara Rao et al.: Short period gravity waves and semiannual oscillation of the zonal wind
Fig. 2.Variability of the monthly mean(a)zonal wind,(b)20–120 min gravity wave variance,(c)2–10 h gravity wave variance, and(d)10–
20 h gravity wave variance between 2004 and 2010. The GW variance is a mean of zonal and meridional variances ((u′2+v′2)/2). The vertical lines represent the standard deviations of monthly mean values. The values at 92 km are shifted forward by 0.5 of a month.
of−33 m s−1in 2008 to−28 m s−1in 2009 and−19 m s−1 in 2010. The annual mean GW variance at 88 km is larger in 2008 (71 m2s−2) than in 2009 (65 m2s−2) and 2010
(69 m2s−2). Figure 2a shows that the annual mean zonal
winds are more westward in 2008 than in 2009 and 2010. Similar variability is observed at other heights also. Thus, associated with large GW variance in 2008, the winds are westward throughout the year. In 2010, the GW variance in two equinoxes is nearly equal (except at 92 km) and the peak westward winds are also nearly equal. Thus, in general, a one-to-one relationship can be noted between the short pe-riod GW variance and the zonal winds during 2008–2010, with the winds becoming westward during the times of GW enhancement. On the contrary, such a relationship between the short period GW variance and the zonal winds is not ob-served during 2004–2006 period. Further, the zonal winds and the GW variance are larger during 2008–2010 than dur-ing 2004–2006.
The relationship between the zonal winds and the short pe-riod GW variance can be more clearly quantified through a
correlative analysis, shown in Fig. 3a and b for 2004–2006 and 2008–2010, respectively. Here, we used the monthly mean values of zonal wind and the GW variance for heights of 88 km, 90 km, and 92 km. Note that the correlations men-tioned here are significant with 95 % confidence level. Dur-ing 2004–2006 (Fig. 3a) the overall correlation coefficient (R) is−0.3 and thus not much correlation is observed be-tween the zonal winds and the short period GW variance. However, during 2008–2010 (Fig. 3b) the zonal winds corre-late well with the short period GW variance with a correla-tion coefficient (R) of−0.7. Furthermore, correlation coef-ficients (r) between the two are also calculated for each year during 2008–2010 and shown in Fig. 3b. From the straight line in Fig. 3b, we can note that 1 m s−1change in the zonal
wind corresponds to about 2.12 m2s−2 change in the GW
Fig. 3.Scatter plot between zonal winds and the short period gravity wave variance ((u′2+v′2)/2) for(a)2004–2006, and(b)2008–2010. Correlation coefficients for individual years (r) and overall correlation coefficients (R) are shown.
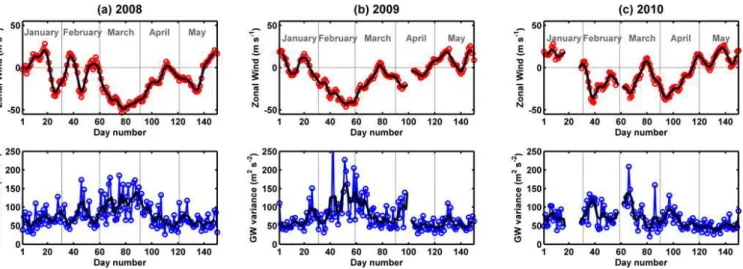
Fig. 4. Variability of the zonal wind (top panels) and short period (20–120 min) gravity wave variance ((u′2+v′2)/2) (bottom panels) in
(a)2008,(b)2009, and(c)2010 at 88 km. Thick solid lines correspond to the 5-day running mean.
during the times of less GW activity. Further analysis (not shown here) shows that the zonal winds weakly correlate with the 2–10 h GW variance (R= −0.2 during 2004–2006 and R= −0.3 during 2008–2010) and they show no sig-nificant correlation with 10–20 h period GW variance. The meridional winds, on the other hand, do not show any signif-icant correlation with GWs in all three bands.
To demonstrate the relation between the zonal winds and the short period (20–120 min) GW variance on a shorter time scale, we show smaller segments of the data in Fig. 4. Fig-ures 4a, b and c show the zonal winds (top panels) and the short period GW variance (20–120 min) (bottom panels) for the first 1–150 days in 2008, 2009, and 2010, respectively for 88 km. Corresponding months are mentioned in the top panel. The thick solid line in each panel represents 5-day running mean. From these figures, the tendency for winds being westward during the times of enhanced GW variance
708 N. Venkateswara Rao et al.: Short period gravity waves and semiannual oscillation of the zonal wind
ofRare possibly due to the fact that the GW variance shows many short-term fluctuations or that the zonal wind is af-fected by forcing due to residual circulation.
4 Discussion
Zonal winds in the equatorial mesopause region over Pame-ungpeuk show a marked semiannual oscillation, with west-ward winds during equinoxes and eastwest-ward winds during solstices. In 2005, 2008, and 2009, it is clearly observed that the first westward cycle is stronger than the second one. These results are in agreement with previous observa-tions (Garcia et al., 1997; Sridharan et al., 2007). In 2010, however, the amplitude of two westward cycles is nearly equal. The present observations also illustrate that in 2008 the zonal winds show an anomalous behavior, in the sense that the winds are westward throughout the year (annual mean−7 m s−1).
Previous studies have shown that the enhanced westward wind during March equinox was repeated, with an interval of 1–3 years with considerable inter-annual variability. During 1993, 1995 and 1997, this interval was found to be similar to that of stratospheric QBO (SQBO) and referred to as the mesospheric QBO (MQBO) (Burrage et al., 1996; Baldwin et al., 2001; Sridharan et al., 2007; Ratnam et al., 2008). However, this so-called MQBO was not observed for sev-eral years after 2002 (Sridharan et al., 2007). In the present study also, the large enhancement in the westward winds is observed only during 2008 and 2009.
The short period (20–120 min) GW variance also shows a clear semiannual variability with peak variance during equinoxes. While the first peak is stronger than the second in 2008 and 2009, the second peak is slightly stronger than the first in 2010. The longer (2–10 h, 10–20 h) period GW vari-ance, on the other hand, does not show pronounced seasonal variability. This can be explained considering that the short period GWs have large phase velocities compared to the long period ones (Fritts and Alexander, 2003) and hence they are less susceptible to the critical level filtering by the underlying wind systems and can easily reach MLT heights. Previous observations from low-latitudes also showed a SAO of the GW activity, with enhancements during equinoxes (Antonita et al., 2008; Clemesha et al., 2009).
The most important result in this study is the correlation between the zonal winds and the short period GW variance during 2008–2010, with winds becoming westward during the times of enhanced GW variance. Although the GW vari-ance alone cannot tell whether wave-mean flow interaction is taking place or not (which requires divergence of momentum flux), here we try to understand what causes such a good cor-relation between the two, considering that the GWs are con-tributing to the MSAO. Alexander et al. (2008) have shown that the GW variance in the troposphere has a seasonal vari-ation, with the variance being more during equinoxes and
less during solstices. Thus, more GWs are generated during equinoxes and less during solstices. We also presume that the GWs are always generated in pairs, with eastward and west-ward propagations. These GWs, while propagating upwest-ward, undergo critical level filtering at various levels of the atmo-sphere. Due to the weak westward winds throughout the year in the tropical troposphere over Indonesian sector, only the westward propagating GWs that have phase speeds greater than the tropospheric winds and all the eastward propagating GWs reach the SSAO heights. The SSAO is characterized by eastward winds during equinoxes and westward winds during solstices (e.g. Dunkerton, 1982; Garcia et al., 1997). Hence, during equinoxes (solstices) the eastward (westward) prop-agating GWs will be filtered by the SSAO and hence more westward (eastward) propagating GWs will reach the MLT region. Since, at the source region, more GWs are gener-ated during equinoxes and less during solstices, the west-ward propagating GWs that reach the MLT region during the equinoxes dominate over the eastward propagating GWs during solstices. Considering that these westward propagat-ing GWs contribute westward momentum to the zonal wind, the correlation between the zonal winds and the GWs and large westward winds during equinoxes (shown in Fig. 2a) can be understood to some extent. Further, filtering effect by the SQBO and altitudinal shift of MSAO may lead to inter-annual variability of the westward winds.
There exist some studies on the relation between the zonal winds at a single location with those at other location of similar latitude or those of zonal mean zonal winds (Isoda et al., 2004; Xu et al., 2009). Isoda et al. (2004) studied the intraseasonal oscillation (ISO) of the zonal wind in the MLT region with periods of 20–100 days at Pontianak (0◦
N, 109◦
E) and Christmas Island (2◦ N, 157◦
W) and found that the phase of the ISO is nearly similar at the two sites, in spite of 90◦
separation between them. Xu et al. (2009) compared the time mean zonal winds observed by a me-teor radar on Maui (20.75◦
N, 156.43◦
W) with the zonal-mean zonal winds at 20◦
the zonal-mean zonal winds. Interestingly, there is no such relationship between the winds and the GW variance dur-ing 2004–2006 period. Along with the short period GWs, the other possible drivers such as intermediate-scale Kelvin and inertia GWs, meridional advection, diurnal tide deposi-tion, and GW-tidal interactions and their relative contribu-tions need to be considered.
Modeling studies in the troposphere showed that short spa-tial and temporal scales of the westward propagating GWs are generated more compared to the eastward propagating GWs (Horinouchi and Yoden, 1998; Kawatani et al., 2010). Thus, temporal and spatial scales of the GWs interacting with background winds in the MSAO region may be smaller in the westward wind shear phase, leading to larger westward winds during the times of short period GW enhancement. In other words, there could be eastward forcing from longer period and longer horizontal wavelength GWs during sol-stices. Thus, we anticipate that there are more short period GWs during the westward phase of the wind. The large GW variance during the equinoxes in the short period band (in Fig. 2b) and reduction in the seasonal contrast with increas-ing GW period (in Fig. 2c and d) support this assumption.
5 Conclusions
Zonal winds in the equatorial MLT region over Pameung-peuk (7.4◦S, 107.4◦E) show a distinct semiannual oscilla-tion, with westward winds during equinoxes and eastward winds during solstices. The variance associated with the short period (20–120 min) GWs, which is considered as a proxy for GW activity, also shows semiannual variability, with enhancements during equinoxes. The most important result in this study is the close relationship between the zonal winds and the short period GW variance, with the winds be-ing westward durbe-ing the times of enhanced GW activity dur-ing 2008–2010. This relationship exists on monthly mean values and daily values as well. For monthly mean val-ues, 1 m s−1change in the zonal wind corresponds to about
2.12 m2s−2change in the GW variance. The correlation
be-tween the zonal winds and the short period GW variance is less during 2004–2006 than during 2008–2010. The variance associated with longer period (2–10 h and 10–20 h) GWs, on the other hand, does not show much seasonal variation and hence does not correlate well with zonal winds.
Thus, the correlation between the zonal winds and the short period GW variance in the present paper is impressive and its clear understanding requires various experiments with multiple instruments and long-term observations. Though many questions remain about what causes such a remarkable correlation between the two, our results open a new perspec-tive for investigating the global relation between zonal winds and GWs. Furthermore, these results will also help to im-prove the general circulation models, by incorporating the
contribution from the short period GWs to better reproduce the observed MSAO.
Acknowledgements. The work of N. Venkateswara Rao was sup-ported by the Japan Society for the Promotion of Science (JSPS) foundation (ID No: P09232). We thank S. Miyahara for his help-ful comments on the original manuscript. We also thank Den-nis Riggin for helpful discussions and careful reading of the revised manuscript. The Pameungpeuk MF radar is operated as a collabora-tive project between RISH and LAPAN. This study was supported in part by the Japanese Ministry of Education, Culture, Sports, Sci-ence and Technology (MEXT) through Grants-in-Aid for Scientific Research (19403009 and 22253006).
Topical Editor C. Jacobi thanks one anonymous referee for her/his help in evaluating this paper.
References
Alexander, S. P., Tsuda, T., Shibagaki, Y., and Kozu, T.: Seasonal gravity wave activity observed with the Equatorial Atmosphere Radar and its relation to rainfall information from the Tropical Rainfall Measuring Mission, J. Geophys. Res., 113, D02104, doi:10.1029/2007JD008777, 2008.
Antonita, T. M., Ramkumar, G., Kumar, K. K., and Deepa, V.: Meteor wind radar observations of gravity wave mo-mentum fluxes and their forcing toward the Mesospheric Semiannual Oscillation, J. Geophys. Res., 113, D10115, doi:10.1029/2007JD009089, 2008.
Baldwin, M. P., Gray, L. J., Dunkerton, T. J., Hamilton, K., Haynes, P. H., Randel, W. J., Holton, J. R., Alexander, M. J., Hirota, I., Horinouchi, T., Jones, D. B. A., Kinnersley, J. S., Marquardt, C., Sato, K., and Takahashi, M.: The quasi-biennial oscillation, Rev. Geophys., 39, 179–229, 2001.
Burrage, M. D., Vincent, R. A., Mayr, H. G., Skinner, W. R., Arnold, N. F., and Hays, P. B.: Long-term variability in the equatorial middle atmosphere zonal wind, J. Geophys. Res., 101, 12847–12854, doi:10.1029/96JD00575, 1996.
Clemesha, B. R., Batista, P. P., Buriti da Costa, R. A., and Schuch, N.: Seasonal variations in gravity wave activity at three locations in Brazil, Ann. Geophys., 27, 1059–1065, doi:10.5194/angeo-27-1059-2009, 2009.
Dunkerton, T. J.: Theory of the Mesopause Semiannual Oscillation, J. Atmos. Sci., 39, 2681–2690, 1982.
Fritts, D. C. and Alexander, M. J.: Gravity wave dynamics and effects in the middle atmosphere, Rev. Geophys., 41, 1003, doi:10.1029/2001RG000106, 2003.
Garcia, R., Dunkerton, T., Lieberman, R., and Vincent, R.: Clima-tology of the semiannual oscillation of the tropical middle atmo-sphere, J. Geophys. Res., 102, 26019–26032, 1997.
Gurubaran, S. and Rajaram, R.: Mean winds, tides, and gravity waves during the westward phase of the mesopause semiannual oscillation (MSAO), J. Geophys. Res., 106, 31817–31824, 2001. Hirota, I.: Equatorial Waves in the Upper Stratosphere and Meso-sphere in Relation to the Semiannual Oscillation of the Zonal Wind, J. Atmos. Sci., 35, 714–722, 1978.
710 N. Venkateswara Rao et al.: Short period gravity waves and semiannual oscillation of the zonal wind
Horinouchi, T. and Yoden, S.: Wave–mean flow interaction associ-ated with a QBO-like oscillation simulassoci-ated in a simplified GCM, J. Atmos. Sci., 55, 502–526, 1998.
Isoda, F., Tsuda, T., Nakamura, T., Vincent, R. A., Reid, I. M., Achmad, E., Sadewo, A., and Nuryanto, A.: Intraseasonal os-cillations of the zonal wind near the mesopause observed with medium-frequency and meteor radars in the tropics, J. Geophys. Res., 109, D21108, doi:10.1029/2003JD003378, 2004.
Kawatani, Y., Watanabe, S., Sato, K., Dunkerton, T. J., Miyahara, S., Takahashi, M.: The Roles of Equatorial Trapped Waves and Internal Inertia–Gravity Waves in Driving the Quasi-Biennial Oscillation. Part I: Zonal Mean Wave Forcing, J. Atmos. Sci., 67, 963–980, doi:10.1175/2009JAS3222.1, 2010.
Lieberman, R. S. and Hays, P. B.: An Estimate of the Momentum Deposition in the Lower Thermosphere by the Observed Diurnal Tide, J. Atmos. Sci., 51, 3094–3105, 1994.
Offermann, D., Wintel, J., Kalicinsky, C., Knieling, P., Koppmann, R., and Steinbrecht, W.: Long-term development of short-period gravity waves in middle Europe, J. Geophys. Res., 116, D00P07, doi:10.1029/2010JD015544, 2011.
Ratnam, M. V., Kumar, G. K., Murthy, B. V. K., Patra, A. K., Rao, V. V. M. J., Rao, S. V. B., Kumar, K. K., and Ramkumar, G.: Long-term variability of the low latitude mesospheric SAO and QBO and their relation with stratospheric QBO, Geophys. Res. Lett., 35, L21809, doi:10.1029/2008GL035390, 2008.
Richter, J. H. and Garcia, R. R.: On the forcing of the Meso-spheric Semi-Annual Oscillation in the Whole Atmosphere Community Climate Model, Geophys. Res. Lett., 33, L01806, doi:10.1029/2005GL024378, 2006.
Sassi, F. and Garcia, R. R.: The Role of Equatorial Waves Forced by Convection in the Tropical Semiannual Oscillation, J. Atmos. Sci., 54, 1925–1942, 1997.
Sridharan, S., Tsuda, T., and Gurubaran, S.: Radar observations of long-term variability of mesosphere and lower thermosphere winds over Tirunelveli (8.7◦N, 77.8◦E), J. Geophys. Res., 112, D23105, doi:10.1029/2007JD008669, 2007.
Taori, A., Patra, A. K., and Joshi, L. M.: Gravity wave seeding of equatorial plasma bubbles: An investigation with simultaneous F region,E region, and middle atmospheric measurements, J. Geophys. Res., 116, A05310, doi:10.1029/2010JA016229, 2011. Tsuda, T., Nishida, M., Rocken, C., and Ware, R.: A Global Mor-phology of Gravity Wave Activity in the Stratosphere Revealed by the GPS Occultation Data (GPS/MET), J. Geophys. Res., 105, 7257–7273, 2000.
Venkateswara Rao, N., Patra, A. K., and Rao, S. V. B.: Some new aspects of low-latitude E-region QP echoes revealed by Gadanki radar: Are they due to KelvHelmholtz in-stability or gravity waves?, J. Geophys. Res., 113, A03309, doi:10.1029/2007JA012574, 2008.
Venkateswara Rao, N., Shibagaki, Y., and Tsuda, T.: Diurnal variation of short-period (20–120 min) gravity waves in the equatorial Mesosphere and Lower Thermosphere and its rela-tion to deep tropical convecrela-tion, Ann. Geophys., 29, 623–629, doi:10.5194/angeo-29-623-2011, 2011a.
Venkateswara Rao, N., Tsuda, T., Gurubaran, S., Miyoshi, Y., and Fujiwara, H.: On the occurrence and variability of the terdiur-nal tide in the equatorial mesosphere and lower thermosphere and a comparison with the Kyushu-GCM, J. Geophys. Res., 116, D02117, doi:10.1029/2010JD014529, 2011b.