química
Volume 35, número 4, 2010 Artigo/ArticleArtigo/ArticleSYNTHESIS, CHARACTERIZATION AND THERMAL
BEHAVIOUR OF SOLID
2-METHOXYCINNAMYLIDENEPYRUVATE OF SOME
BIVALENT METAL IONS IN CO2 AND N2 ATMOSPHERES
1 2 3 4*
C. T. de Carvalho , A. B. Siqueira , E. Y. Ionashiro , M. Ionashiro 1
Universidade Federal da Grande Dourados, CEP 79.804-970, Dourados, MS, Brazil.
2
Universidade Federal de Mato Grosso, CEP 78698-000, Barra do Garças, MT, , Brazil
3
Instituto de Química, UFG, CEP 74001-979, Goiania, GO, Brazil.
4
Instituto de Química, UNESP, CP 355, CEP 14801-970, Araraquara, SP, Brazil
Abstract:
Keywords: .
Solid State M-2-MeO-CP compounds, where M stands for bivalent metals (Mn, Fe, Co, Ni, Cu and Zn) and 2-MeO-CP is 2-methoxycinnamylidenepyruvate, were synthesized. Simultaneous thermogravimetry and differential thermal analysis (TG-DTA), differential scanning calorimetry (DSC), elemental analysis and complexometry were used to establish the stoichiometry and to study the thermal behaviour of these
compounds in CO and N atmospheres. The results were consistent with the general formula: M(L) ·H O. In 2 2 2 2
both atmospheres (CO , N ) the thermal decomposition occurs in consecutive steps which are characteristic of 2 2
each compound. For CO atmosphere the final residues were: Mn O , Fe O , Co O , NiO, Cu O and ZnO, while 2 3 4 3 4 3 4 2
under N atmosphere the thermal decomposition is still observed at 1000 º C.2
bivalent metals, 2-methoxycinnamylidenepyruvate, thermal behaviour, CO N2, 2
Introduction
Several metal-ion complexes of
phenyl-subs-tituted derivatives of cinnamylidenepyruvate, C H -6 5
-(CH) -COCOO (CP), have been investigated in 4
aqueous solutions [1-2] and in the solid state [3-11]. These works reported the thermodynamic stability
(â1), and spectroscopic parameters (å1max, ëmax) in
aqueous solutions associated with 1:1 complex species. The works also report the synthesis and investigation of the compounds in the solid state by means of thermogravimetry, differential thermal analysis (DTA), differential scanning calorimetry (DSC), and other methods of analysis.Establishment of the stoichiometry and the details of the thermal
decomposition were the main purpose of the studies. H o w e v e r, t h e t h e r m a l b e h a v i o u r o f 2 -methoxycinnamylidenepyruvate of Mn(II), Fe(II),
Co(II), Ni(II), Cu(II) and Zn(II) in CO and N 2 2
atmospheres have not been reported.
In this paper, the objective of the present research was to prepare sodium2-methoxycinnamy-lidenepyruvate and 2-methoxycinnamylidenepyru-vate of some bivalent metal ions in the solid state and too investigated by means of complexometry, elemental analysis, simultaneous thermogravimetry and differential thermal analysis (TG-DTA) and differential scanning calorimetry (DSC). The results allowed us to acquire information concerning the
56
Artigo Article
Experimental
The 2-methoxycinnamaldehyde, (CH O-3
C H -(CH) -CHO) 96% pure predominantly trans, 6 4 2
was obtained from Aldrich and sodium pyruvate
(H C-CO-COONa) 99% pure was obtained from 3
Sigma.
Sodium 2-methoxycinnamylidenepyruvate (Na-2-MeO-CP) and its corresponding acid were both synthesized following the same procedure as descri-bed in literature [12], with some modifications, which were as follows: an aqueous solution of sodium pyruvate (1.5g per 10 mL) was added dropwise with continuos stirring to a methanolic solution of 2-methoxycinnamaldehyde (2.0g per 50mL). Five millilitres of an aqueous sodium hydroxide solution
-1
1.25 mol. L was added slowly while the reacting system was stirred and cooled in an ice bath. The rate of addition of alkali was regulated so that the temperature remained between 5 and 9 ºC. The system was stirred at ambient temperature (~28 ºC) for about 5h. To the pale yellow solution was added dropwise with continuous stirring with a glass rod, twenty millilitres of chilled
-1
concentrated (12 mol.L ) hydrochloric acid. The system was left to stand for ca. 16h in a freezer (-6 ºC) and the yellow orange precipitate (impure 2-methoxycinnamylidenepyruvic acid) was filtered, washed with distilled water to remove most of the unreacted aldehyde and secondary products and dried on Whatman nº 41 filter paper. The aqueous suspensi-on of the impure acid was dissolved with 5 mL of
-1 aqueous sodium hydroxide solution 2 mol L and filtered on Whatman nº 44 filter paper. The yellow solution was stirred with a glass rod and added slowly
-1
20 mL of chilled concentrated (12 mol L ) hydrochlo-ric acid and left to stand for ca. 16h in freezer (-6ºC). The orange precipitate of 2-methoxycinnamy-lidenepyruvic acid was filtered and washed with distilled water until elimination of chloride ions and dried on Whatman nº 41 filter paper and kept in desiccators over anhydrous calcium chloride.
-1 Aqueous solution of Na-MeO-CP 0.1 mol L was prepared from aqueous 2-MeO-HCP suspension by treatment with sodium hydroxide solution 0.1 mol
-1
L ., whose pH were adjusted around 8. Aqueous solutions of the bivalent metal ions were prepared by dissolving of the chlorides.
The solid-state compounds were prepared by slowly adding the solution of the ligand to the respective metal chloride under continuous stirring
until total precipitation of the metal ions. To avoid oxidation of Mn(II) and Fe(II), all their solutions as well as the water employed for washing their precipitates were purged with nitrogen gas. The precipitates were washed with distilled water until the chloride ions were totally eliminated. This was then filtered through and dried on Whatman nº 42 filter paper and kept in desiccators over anhydrous calcium chloride.
For the compounds in the solid state, TG curves were used to determine the hydration water, ligand and metal contents. The metal ions were also determined by complexometric tritration with standard EDTA solution [13, 14] after igniting the compounds to their respective oxides and then dissolving them in hydrochloric acid solution.
Carbon and hydrogen contents were determi-ned by microanalytical procedures, with an EA 1110 CHNS-O Elemental Analyzer from CE instruments.
Simultaneous TG-DTA and DSC curves were obtained with two thermal analysis systems, model SDT 2960 and DSC Q10, both from TA Instruments.
-1 The purge gas was CO2 flow of 100 mL min for the
-1
TG-DTA and 50 mL min for the DSC. A heating rate -1
of 20 ºC min for the TG-DTA and DSC, with samples weighing about 5 mg for the TG-DTA and 2 mg for the DSC. Alumina and aluminium crucibles, the latter with perforated covers, were used for the TG-DTA and the DSC, respectively.
Results and Discussion
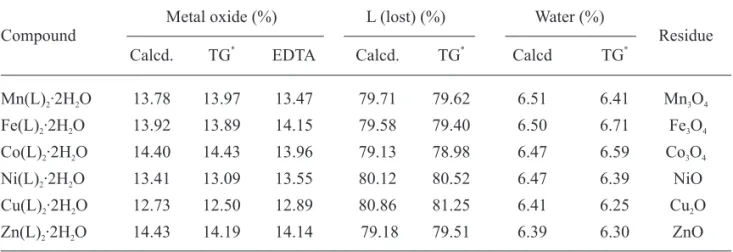
The analytical and thermoalytical (TG) results of the synthesized compounds are shown in Table 1. These results permitted to establish the stoichiometry of the compounds, which is in
agreement with the general formula M(L) .nH O, 2 2
where M represents bivalent Mn, Fe, Co, Ni, Cu and Zn, L is 2-methoxycinnamylidene pyruvate and n=2.
TG-DTA
The simultaneous TG-DTA curves of the
compounds in CO and N atmospheres are shown in 2 2
* *
Fig. 1 in CO (a - f) and N (a - f ), respectively. These 2 2
curves show mass losses in three (Fe), four (Mn, Co,
Zn) and five (Cu, Ni) steps in CO atmosphere and 2
three (Co, Ni), four (Mn, Fe, Zn) and five (Cu) steps
in N atmosphere. In both atmospheres a great 2
similarity is observed in the TG-DTA curves up to the second (Fe, Co), third (Mn, Ni, Zn) and four (Cu)
steps. This similarity suggests that as much in CO as 2
in N atmospheres the thermal decomposition 2
mechanism for each compound must be the same.
The TG curve in N atmosphere also shows that the 2
mass loss are still being observed up to 1000 ºC, in all the compounds.
The thermal behaviour of the compounds is heavily dependent on the nature of the metal ion and so the features of each of these compounds are discussed individually
Table 1. Analytical and thermoanalytical (TG) data for M(L)2.nH2O, where M = metal and L: 2-methoxycinnamylidenepyruvate.
Metal oxide (%) L (lost) (%) Water (%)
Compound Residue
* * *
Calcd. TG EDTA Calcd. TG Calcd TG
Mn(L) ·2H O2 2 13.78 13.97 13.47 79.71 79.62 6.51 6.41 Mn O3 4
Fe(L) ·2H O2 2 13.92 13.89 14.15 79.58 79.40 6.50 6.71 Fe O3 4
Co(L) ·2H O2 2 14.40 14.43 13.96 79.13 78.98 6.47 6.59 Co O3 4
Ni(L) ·2H O2 2 13.41 13.09 13.55 80.12 80.52 6.47 6.39 NiO
Cu(L) ·2H O2 2 12.73 12.50 12.89 80.86 81.25 6.41 6.25 Cu O2
Zn(L) ·2H O2 2 14.43 14.19 14.14 79.18 79.51 6.39 6.30 ZnO
*
2 0 0 4 0 0 6 0 0 8 0 0 1 0 0 0 1 2 0 0
( a )
( b )
( c )
( d )
( e )
Ä
m(%)
T e m p e r a tu r e /º C
( f )
2 0 0 4 0 0 6 0 0 8 0 0 1 0 0 0
( a * )
( b * )
( c * )
( d * )
( e * )
( f * )
T e m p e r a t u r e / º C
Ä
m(%)
*
Figure 1. TG-DTA curves of the compounds in CO and N : (a, a*) Mn(L) ·2H O (m = 4,94mg; 5,04 mg *), 2 2 2 2
(b,b*) Fe(L) ·2H O (m = 5,07 mg;5.08mg*), (c,c*) Co(L) ·2H O (m =5.13mg; 5,14mg*), (d,d*) Ni(L) ·2H O 2 2 2 2 2 2
(m = 5,00mg; 5,12mg*), (e,e*) Cu(L) ·2H O (m = 4.88mg; 5,13mg*) and (f,f*) Zn(L) ·2H O 2 2 2 2
58
Artigo Article
Manganese compound. The simultaneous
TG-DTA curves in CO and N atmospheres are shown in 2 2
*
Fig. 1 (a, a ). The first mass loss observed between 50 –
145 ºC (CO ) and 50 – 140 ºC (N ) corresponding to the 2 2
endothermic peak at 135 ºC (CO ) and 130 (N ) is 2 2
attributed to dehydration with loss of 2 H O (Calcd. = 2
6.51%, TG = 6.41% (CO ), 6,65% (N )). For the CO 2 2 2
atmosphere, the thermal decomposition of the anhydrous compound occurs in three steps between 145 – 220 ºC, 220 – 555 ºC and 555 – 580 ºC, with losses of 4.64, 37.82 and 37.16% respectively, corresponding to the indicium of exothermic event at 210 ºC and a large endothermic peak at 835 ºC, with
formation of Mn O , as final residue (Calc = 13.78%, 3 4
TG = 13.97%). For the N atmosphere, the thermal 2
decomposition also occurs in three steps between 140 – 220 ºC, 220 – 565 ºC and 565 ºC – 1000 ºC, with losses of 5.12, 38.92 and 5.51%, respectively, corresponding to the exothermic peak at 210 ºC and small endothermic peak at 895 ºC.
Iron Compound. The simultaneous TG-DTA
curves in CO and N atmospheres are shown in Fig. 1 2 2
(b, b*). The first mass loss that occurs between 50 – 155 ºC, corresponding to the endothermic peak at 150 ºC, in both atmospheres is attributed to
dehydra-tion with loss of 2H O (Calc. = 6.50 %, TG = 6.71 % 2
(CO ), 6.65 % (N )) The thermal decomposition of 2 2
the anhydrous compound in CO atmosphere occurs 2
in two steps between 155 º - 540 ºC and 540 – 730 ºC, with losses of 45.99 and 33.41% respectively, corresponding to the endothermic peak at 700 ºC,
with formation of Fe O , as final residue (Calc. = 3 4
13.92 %, TG = 13.92 %, 13.89 %). For the N 2
atmosphere, the TG-DTA curves show mass losses in three steps between 155 – 500 ºC, 500 – 690 ºC and 690 – 1000 ºC, with losses of 46.47 %, 9.10 % and 5.14%, respectively, corresponding to the indicium of exothermic event at 220 ºC and endothermic peaks at 650 and 750 ºC.
Cobalt compound. The simultaneous
TG-DTA curves in CO2 and N atmospheres are shown in 2
Fig.1 (c, c*). The first mass loss that occurs between 50 – 165 ºC, corresponding to the endothermic peak at 160 ºC in both atmospheres is attributed to
dehydration with loss of 2 H O. (Calcd. = 6.47%, TG 2
= 6.59% (CO ), 6.32% (N )). The thermal decompo-2 2
sition of the anhydrous compound in CO atmosphe-2
re occurs in two steps between 165 – 510 ºC and 510 – 640 ºC, with losses of 43.37 and 38.55%, respecti-vely, corresponding to the endothermic peak 620 ºC, with formation of a mixture of Co and CoO. The mass gain of 2.94% between 640 – 800 ºC is attributed to
the oxidation of Co and CoO to Co O , as final 3 4
residue (Calcd. = 14.40%, TG = 14.43%). In N 2
atmosphere, the thermal decomposition of the anhydrous compound occurs in two steps between 165 – 610 ºC and 610 – 1000 ºC, with losses of 50.56 % and 4.81 % respectively, corresponding to the endothermic peak at 850 ºC.
Nickel compound. The simultaneous
TG-DTA curves in CO and N atmospheres are shown in 2 2
Fig. 1 (d, d*). The first mass loss observed between 50 – 170 ºC, corresponding to the endothermic peak at 165 ºC, in both atmospheres is ascribed to
dehydra-tion with loss of 2 H O (Calcd. = 6.47 %, TG = 6.39 % 2
(CO ), 6.50 % (N ). The thermal decomposition of 2 2
the anhydrous compound in CO atmosphere occurs 2
in three steps between 170 – 210 ºC, 210 - 450 ºC and 450 – 640 ºC, with losses of 5.38, 53.70 and 24.10 % respectively, corresponding to the endothermic peaks at 340 and 600 ºC, with formation of a mixture of Ni and NiO. The mass gain of 1.67 % between 640 – 980 ºC corresponding to the exothermic peak at 940 ºC is attributed to the oxidation of Ni to NiO, as final residue (Calcd. = 14.41 %, TG = 13.09 %). The
thermal decomposition in N atmosphere occurs in 2
three steps between 170 – 210 ºC, 210 -430 ºC and 430 – 1000 ºC, with losses of 6.07, 53.69 and 7.66 %, respectively, corresponding to the endothermic peak at 340 ºC.
Copper compound. The simultaneous
TG-DTA curves in CO and N atmospheres are shown in 2 2
Fig.1 (e, e*). The first mass loss that occurs between 50 – 130 ºC, corresponding to the endothermic peak at 125 ºC, in both atmospheres is attributed to
dehydration with loss of 2H O (Calcd. = 6.41 %, TG 2
= 6.25 % (CO ), 6.22 (N )). In CO atmosphere, the 2 2 2
anhydrous compound shows mass losses in four steps between 130 – 180 ºC, 180 – 240 ºC, 240 – 545 ºC and 545 – 1035 ºC, with losses of 5.66, 13.14, 35.73 and 26.72 %, respectively, corresponding to the exothermic peaks at 175 ºC, 235 ºC and
endother-mic peaks at 870, 990 ºC, with formation of Cu O, as 2
final residue (Calcd. = 12.73 %, TG = 12.50 %). The
thermal decomposition in N atmosphere also occurs 2
in four steps between 130 – 190 ºC, 190 – 245 ºC, 245 – 515 ºC and 515 – 1000 ºC, with losses of 5.35, 13.39, 37.20 and 4.29 %, respectively, corresponding to the exothermic peaks at 185 ºC and 240 ºC.
Zinc compound. The simultaneous TG-DTA
curves in CO and N atmospheres are shown in Fig.1 2 2
(f, f*). The first mass loss between 50 – 140 ºC, corresponding to the endothermic peak at 130 ºC, in both atmospheres is attributed dehydration with loss of
59
First step Second step Third step Fourth step Fifth step Compound
CO2 N2 CO2 N2 CO2 N2 CO2 N2 CO2 N2
Mn(L) ·2H O2 2 è/ºC 50 - 145 50 -140 145 - 220 140 - 220 220 - 555 220 - 565 555 - 880 565 – 1000 -
-Äm/% 6.41 6.65 4.64 5.12 37.82 38.98 37.16 5.51 -
-Peak/ºC 135 130 - - - - 835 895 -
-Fe(L) ·2H O2 2 è/ºC 50 - 155 50 -155 155 - 540 155 - 500 540 – 730 500 – 690 - 690 – 1000 -
-Äm/% 6.71 6.65 46.47 46.47 33.41 9.1 - 5.14 -
-Peak/ºC 150 150 - - 700 650 - 750 -
-Co(L) ·2H O2 2 è/ºC 50 - 165 50 - 165 165 - 610 165 - 610 510 – 640 610 - 1000 640 – 800 - -
-*
Äm/% 6.59 6.32 50.56 50.56 38.55 4.81 2.94 - -
-Peak/ºC 160 160 - - 620 850 - - -
-Ni(L) ·2H O2 2 è/ºC 50 - 170 50 - 170 170 - 210 170 - 210 210 – 450 210 – 430 450 – 640 430 – 1000 640 – 980
-*
Äm/% 6.39 6.50 6.07 6.07 53.70 53.69 24.10 7.66 1.67
-Peak/ºC 165 165 - - 340 340 600 - 900
-Cu(L) ·2H2OO2 è/ºC 50 - 130 50 -130 130 - 190 130 - 190 190 – 245 190 – 245 240 – 545 245 – 515 545 – 1035 515 - 1000
Äm/% 6.25 6.22 5.35 5.35 13.39 13.39 35.73 37.20 26.72(CuO))) 4.29
Peak/ºC 125 125 - - 225 225 - - 870, 990
-Zn(L) ·2H O2 2 è/ºC 50 - 140 50 - 140 140 -215 140 – 215 215 – 510 215 – 510 500 – 985 510 – 985 -
-Äm/% 6.30 6.28 5.42 5.42 39.53 39.53 34.65 19.50 -
-Peak/ºC 130 130 - - - - 950 950 -
60
Artigo Article
2 H O (Calc. = 6.39 % (CO ), 6.28 % (N )). The thermal 2 2 2
decomposition of the anhydrous compound in CO2
atmosphere occurs in three steps between 140 – 205 ºC, 205 – 500 ºC and 500 – 985 ºC, with losses of 5.10, 39.76 and 34.65%, respectively, corresponding to the exothermic peak at 200 ºC and an endothermic peak at 950 ºC, with formation of ZnO, as final residue (Calc. =
14.43%, TG = 14.19%). In N atmosphere, the thermal 2
decomposition of the anhydrous compound also occurs in three steps between 140 – 215 ºC, 215 – 510 ºC and 510 – 1000 ºC, with losses of 5.42, 39.53 and 19.50 %, respectively, corresponding to the exother-mic peak at 210 ºC and an endotherexother-mic peak at 950 ºC.
The formation of the respective oxides:
Mn O , Fe O , Co O , NiO, Cu O and ZnO in CO 3 4 3 4 3 4 2 2
atmosphere. For N atmosphere the TG-DTA curves 2
show that the thermal decomposition are still being observed up to 1000 ºC, thus do not allowing to verify which oxides are formed, since only 65.4 % (Mn), 78.2 % (Fe), 72.1 % (Co), 8.51 % (Ni), 76.0 % (Cu) and 82.4 % (Zn) of these compounds were lost, when compared with the mass losses of the TG-DTA
curves obtained in CO atmosphere.2
DSC
The DSC curves of the compounds in CO and 2
N atmospheres are shown in Figs. 2. These curves 2
show endothermic and exothermic peaks that all are in agreement with the mass losses observed in the TG-DTA curves up to 600 ºC.
The endothermic peak in the range 130 - 170 ºC in both atmospheres is assigned to the dehydration which occurs in a single step. The dehydration
enthalpies found for these compounds in CO and N2 2
atmospheres were: 116.6; 110.8 (Mn), 113.0; 108.9 (Fe), 124.8; 114.5(Co), 119.2; 111.1 (Ni), 91.8; 87.4
-1
(Cu) and 116.2; 116.6 (Zn) kJ mol , respectively. The exothermic peak observed in both atmos-pheres (except for copper) at 209 ºC (Mn), 213 ºC (Fe), 222 ºC (Co), 285 ºC (Ni) and 200 ºC (Zn), correspon-ding to the first mass loss of the anhydrous compound, is probably due to the descarboxylation process. For the copper compound two sharps exothermic peaks at 177 ºC and 238 ºC in both atmospheres corresponding to the first two mass losses of the anhydrous compound is probably due to the descarboxylation process and
* *
Figure 2. DSC curves of the compounds in CO and N : (a,a ) Mn(L) ·2H O (m = 2.22 mg; 2.24 mg*), (b,b*) 2 2 2 2
Fe(L) ·2H O (m = 2.12 mg; 2.29 mg*), (c,c*) Co(L) ·2H O (m = 2.29 mg, 2,29 mg*), (d,d*) Ni(L) ·2H O ( m = 2 2 2 2 2 2
2.46 mg, 2.24 mg*), (e,e*) Cu(L) ·2H O (m = 2.22 mg; 2,48 mg* ) and (f,f*)Zn(L) ·2H O (m = 2.18mg, 2 2 2 2
2.25mg*). L= 2-methoxycinnamylidenepyruvate.
loss of the methoxy group, respectively (Calcd. = 18.86 %, TG = 18.80 %). The profile of the exothermic peak at 238 ºC, suggest that this step the mass loss is accompanied by a physical phenomenon.
The small endo or exothermic peaks observed above 240 ºC (Mn, Zn), 260 ºC (Fe, Co, Cu) and 320 ºC (Ni) in both atmospheres up to 550 ºC and no observed in the DTA curves, suggest that in this step endo and exothermic events must occur simultane-ously, where the net heat produce only small endo or exothermic peaks or no thermal events.
Conclusion
From TG curves (CO ), and complexometry 2
results, a general formula could be established for these compounds in the solid state, which are in
agreement which M(L) ·2H O.2 2
For CO2 atmosphere the final thermal decomposition occurs at temperature below 1000 ºC
with formation of the respective oxide: Mn O , Fe O , 3 4 3 4
Co O , NiO, Cu O and ZnO. For N atmosphere the 3 4 2 2
mass loss is still being observed up to 1000 ºC. The TG-DTA and DSC curves provided information concerning the thermal behaviour and
thermal decomposition of these compounds in CO 2
and N atmospheres, which are characteristic of each 2
compound.
Acknowledgements
The authors thank FAPESP, CNPQ and CAPES and Foundations (Brazil) for financial support.
Resumo: Compostos M-2-MeO-CP foram sintetizados no estado sólido, onde M representa os metais bivalentes (Mn(II), Fe(II), Co(II), Ni(II), Cu(II) e Zn(II)) e 2-MeO-CP é o 2-metoxicinamalpiruvato. Para estabelecer a estequiometria e estudar o comportamento térmico desses compostos foram utilizadas termogravimetria, análise térmica diferencial simultânea (TG-DTA), calorimetria exploratória diferencial (DSC), análise elementar e complexometria com EDTA. Os resultados foram concordantes com a fórmula
geral: M(L) ·H O. Em ambas as atmosferas a decomposição térmica ocorre em etapas consecutivas e é 2 2
característica de cada composto. Em atmosfera de CO os resíduos finais foram: Mn O , Fe O , Co O , NiO, 2 3 4 3 4 3 4
Cu O e ZnO, enquanto que em atmosfera de N a decomposição térmica ainda é observada até 1000 ºC.2 2
References
[1] O. S. Siqueira, C. B. Melios, M. Ionashiro, M. de Moraes and M. Molina, J. Alloys compd., 225 (1995) 267. [2] N. C. S. Pereira, C. B. Melios, R. N. Marques, O. S. Siqueira, M. de Moraes, M. Molina and M. Ionashiro, J. Alloys Compd., 249 (1997) 94.
[3] E. Schnitzler, C. B. Melios and M. Ionashiro, An. Assoc. Bras. Quim., 47(4) (1998) 326.
[4] J. D. S. de Oliveira, M. I. G. Leles, L. M. D' Assunção, C. B. Melios and M. Ionashiro, J. Braz. Chem. Soc., 10(3) (1999) 209.
[5] M. I. G. Leles, E. Schnitzler, M. A. S. Carvalho Filho, N. S. Fernandes, C. B. Melios and M. Ionashiro, An. Assoc. Bras. Quim., 48(1) (1999) 37.
[6] M. I. G. Leles, C. B. Melios, L. M. D' Assunção and M. Ionashiro, Ecl. Quim., 24 (1999) 29.
[7] E. Schnitzler, C. B. Melios, M. I. G. Leles and M. Ionashiro, Ecl. Quim., 25 (2000) 31.
[8] W. Costa, E. Schnitzler, C. B. Melios and M. Ionashiro, An. Assoc. Bras. Quim., 49(3) (2000) 147.
[9] E. Schnitzler, C. B. Melios and M. Ionashiro, J. Therm. Anal. Cal., 70 (2002) 581.
[10] J. D. S. de Oliveira, F. L. Fertonani, C. B. Melios and M. Ionashiro, Ecl. Quim., 27 (2002) 11.
[11] E. Schnitzler, M. Lazzarotto, M. A. S. Carvalho filho and M. Ionashiro, Ecl. Quim., 27 (2002) 41.
[12] G. Bannach, E. Schnitzler, O. Treu Filho, V. H. S. Utuni and M. Ionashiro, J. Therm. Anal. Cal., 83(1) (2006) 233.
[13] H. A. Flaschka, EDTA Tritrations, Pergamon Press, Oxford, 1964.
[14] C. N. de Oliveira, M. Ionashiro and C. A. F. Graner, Ecl. Quim. 10 (1985) 7.
[15] G. Socrates, Infrared Characteristic Group
Frequen-nd
cies, 2 ed. Wiley, New York, 1994, pp. 91 and 236 – 237. [16] R. M. Silverstein, F.X. Webster, Spectrometric
th
Identification of Organic Compounds, 6 ed., Wiley, New York, 1998, pp. 92, 93, 96 and 97.
[17] F. A. Cotton, in: J. Lewis, R. G. Wilkius (Eds), The Infrared Spectra of Transition Metal Complexes In Modern Coordination chemistry, Interscience, New York, 1960, p. 379-386.