Printed in Brazil - ©2005 Sociedade Brasileira de Química 0103 - 5053 $6.00+0.00
Article
* e-mail: [email protected]
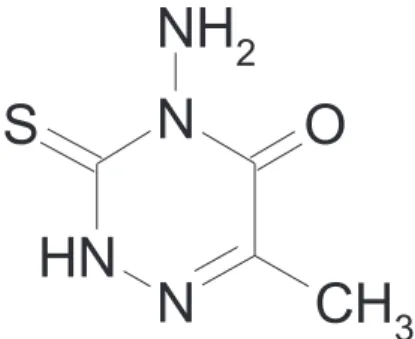
Synthesis of 4-Amino-6-methyl-1,2,4-triazin-5-one-3-thione and its Application in Construction
of a Highly Copper(II) Ion-Selective Electrochemical Sensor
Hassan Ali Zamani*,a, Ghadier Rajabzadeha, Ali Firouza and Ali Asghar Ariaii-Rad a
a
Department of Chemistry, Quchan branch, Islamic Azad University, Quchan, Iran
Um sensor altamente seletivo para Cu(II) usando 4-amino-6- metil-1,2,4-triazina-5-ona-3-tiona (AMTOT) como material seletivo, foi desenvolvido utilizando uma membrana de PVC. O eletrodo exibe um intervalo dinâmico linear entre 1,0×10⁻¹ e 1,0×10⁻⁶ mol L-1, com resposta Nernsteniana de 29,3 ± 0,6 mV por década e um limite de detecção de 6,2×10⁻⁷ mol L-1. A resposta do eletrodo é independente do pH, no intervalo entre 2,5 e 7,0. O sensor possui a vantagem de apresentar um tempo de condicionamento pequeno, uma rápida velocidade de resposta (< 20 s) e especialmente, uma boa seletividade frente a metais pesados e de transição, e a alguns cátions mono, di e trivalentes. O eletrodo pode ser usado por até 9 semanas sem consideráveis divergências de potencial. O eletrodo proposto foi aplicado com sucesso na determinação de cobre em águas de descarte, oriundas de plantas eletroquímicas de cobre e como eletrodo indicador na titulação potenciométrica de íons Ca(II) com EDTA.
A highly Cu(II) ion-selective PVC membrane sensor based on 4-Amino-6-methyl-1,2,4-triazin-5-one-3-thione (AMTOT) as an excellent sensing material was developed. The electrode exhibits a linear dynamic range between 1.0×10⁻¹ and 1.0×10⁻⁶ mol L-1, with a near Nernstian slope of 29.3 ± 0.6 mV per decade and a detection limit of 6.2×10⁻⁷ mol L-1. The sensor response is independent of the pH of the solution in the pH range of 2.5 – 7.0. The sensor possesses the advantages of short conditioning time, fast response time (<20 s), and especially, very good selectivity towards transition and heavy metal, and some mono, di and trivalent cations. The electrode can be used for at least 9 weeks without any considerable divergence in the potentials. The proposed electrode was successfully applied to the determination of copper in wastewater of copper electroplating samples and as an indicator electrode in potentiometric titration of Ca(II) ions with EDTA.
Keywords: potentiometry, copper sensor, PVC membrane, 4-amino-6-methyl-1,2,4-triazin-5-one-3-thione
Introduction
During the last decade, there has been a renewed resurgence in developing potentiometric membrane electrodes as devices for rapid, accurate, low cost and non destructive analysis of different samples with small volume samples.
Due to the necessary need for selective copper measurements in many copmplex biological systems,1,2
geochemical,3 environmental, medicinal and industrial
samples,4 the search for new selective and sensitive
PVC-membrane electrodes for its quick measurement is still a challenging goal.1,5 A wide variety of neutral carriers,
including small size thia-substituted crown ethers,6,7
benzo-substituted macrocyclic diamides,8 anthraquinone
derivatives,9 acyclic neutral ligands with dithiocarbamate
groups,10,11 and with nitrogen atoms,12 hydroxamate
derivatives,13 aza-thioether crowns,14 calix[4]arenas,15
naphthol derivatives,16 and Schiff’s bases,17-22 have been
used as carriers in the construction of copper(II) ion selective membrane electrodes. However, most of these copper sensors have problems such as: (i) narrow working concentration range, (ii) high detection limit and (iii) strong interfering effect of cations as follow Fe3+, Co2+,
Ni2+, Hg2+, Ag2+, Sr2+, Na+, Cs+ and K+.
We have recently reported a number of highly selective and sensitive membrane sensors for various metal ions.23-25
Experimental
Reagents
Reagent grade 2-nitrophenyl octyl ether (NPOE), dibutyl phthalate (DBP), benzyl acetate (BA), nitrobenzene (NB), sodium tetraphenyl borate (NaTPB), tetrahydrofuran (THF) and high relative molecular weight PVC were purchased from Merck and Aldrich, used as received. The nitrate and chloride salts of all cations used (all from Merck and Aldrich) were of the highest purity available and used without any further purification except for vacuum drying over P2O5. Triply distilled de-ionized water was used throughout.
Synthesis of AMTOT
Thiocarbohydrazide (2.65 g, 25mmol) dissolved in 70 mL water at 60 oC. Sodium pyruvate (2.75 g, 25mmol) was
added to the solution and heated for 1h. After cooling, the reaction mixture was acidified using acetic acid and the resultant precipitate was recrystallized in hot water to afford the title compound. Yield : 3.5 g (89%); mp: 180 oC; 1H NMR δ (d
6-DMSO): 13.04 (s, 1H, NH, exchangeable
with D2O), 6.93 (s, 2H, NH2, exchangeable with D2O), 2.1 (s, 3H, CH3); IR (KBr) νmax/ cm-1: 3300 (NH
2 stretch.,
H-bond), 3200 (NH2 stretch., free), 3100 (ring NH stretch.), 1720 (C=O stretch.), 1580 (NH2 bend, asym.), 1530 (NH2 bend., sym.), 1400 (ring deform.), 1380 (CH3 bend., asym.), 1300, 1210, 760, 720, 500 (ring deform.); MS, m/z (%): 158 (1, M+), 157 (6.1), 155 (100), 100 (20), 86 (32), 74
(44), 44 (20.7).
Electrode preparation
The general procedure to prepare the PVC membrane was to mix thoroughly 30 mg of powdered PVC, 63.5 mg of NPOE and 4.5 mg of NaTPB in 5 mL THF. To this solution were added 2 mg of AMTOT and mixed well. The resulting mixture was transferred into a glass dish of 2 cm diameter.
A Pyrex tube (5 mm o.d.) was dipped into the mixture for about 5 s, so that a nontransparent membrane (about 0.3 mm thickness) is formed. The tube was then pulled out from the mixture and kept at room temperature for at least 12 h. The tube was then filled with internal filling solution (1.0 ×10⁻³ mol L-1 copper nitrate). The electrode was finally
conditioned for 24 h by soaking in a 1.0 × 10⁻² mol L-1
Cu(NO3)2 .9,14,16,18 A silver/silver chloride electrode was used
as an internal reference electrode. For a comparative study, a membrane containing no active component was also prepared. The ratio of different membrane ingredients, concentration of equilibrating solution and the time of contact were optimized to provide membranes, which result in reproducible, noiseless and stable potentials.
The emf measurements
All emf measurements were carried out with the following assembly:
Ag–AgCl | internal solution, 1.0×10⁻³ mol L-1 Cu(NO 3)2
| PVC membrane | sample solution | Hg–Hg2Cl2, KC1 (satd.) A Corning ion analyzer 250 pH/mV meter was used for the potential measurements at 25.0 oC. The emf
observations were made relative to a double-junction saturated calomel electrode (SCE, Philips) with the chamber filled with an ammonium nitrate solution.
Procedure of complexation study
Conductivity measurements were carried out with a Metrohm 660 conductivity meter. A dip-type conductivity cell made of platinum black, with a cell constant of 0.83 cm-1 was used. In all measurements, the cell was
thermostated at the desired temperature 25.0 oC using a
Phywe immersion thermostat. In typical experiments, 25 mL of a cation nitrate solution (1.0 × 10⁻⁴ mol L-1 ) was
placed in water jacketed cell equipped with magnetic stirrer and connected to the thermostat circulaing water at the desired temperature. In order to keep the electrolyte concentration constant during the titration, both the starting solution and titrant had the same cation concentration. Then, a known amount of the AMTOT (1.0 × 10⁻² mol L-1) solution was added in a stepwise manner
using a calibrated micropipette. The conductance of the solution was measured after each addition. Addition of the AMTOT was continued until the desired AMTOT-to-cation mole ratio was achieved. The 1:1 binding of the cations with AMTOT can be expressed by the following equilibrium:
(1)
The corresponding equilibrium constant, Kf, is given by
(2)
where [MLn+], [Mn+], [L] and f represent the equilibrium
molar concentration of complexes, free cation, free AMTOT and the activity coefficient of the species indicated, respectively. Under the dilute condition we used, the activity coefficient of the uncharged ligand, f(L) can be reasonably assumed as unity.26 The use of Debye–Hückel
limiting law of 1:1 electrolytes,27 lead to the conclusion
that f(Mn+) ≈ f(MLn+) , so the activity coefficient in equation (2) is canceled out. Thus, the complex formation constant in term of the molar conductance, Λ, can be expressed as:28
(3)
Where
(4)
Here, ΛM is the molar conductance of the cation before addition of AMTOT, ΛML the molar conductance of the complexed, Λobs the molar conductance of the solution during titration,
CL the analytical concentration of the AMTOT added, and
CM the analytical concentration of the cation salt. The complex formation constant, Kf and the molar conductance of the complex, ΛML, were obtained by computer fitting of equations (3) and (4) to the molar conductance-mole ratio data using a nonlinear least-squares program KINFIT.29
Results and Discussion
Complexation of AMTOT with some cations in acetonitrile
In primary experiments, interaction of AMTOT (with one nitrogen, one oxygen and one sulfur donor atom) with a number of metal ions was investigated in acetonitrile solution by conductometric method, and the results showed that, in all cases, the ligand to cation mole ratio is 1. The formation constants (Kf) of the resulting 1:1 complexes was evaluated by the computer fitting of the molar conductance-mole ratio data to appropriate equations and the results are summarized in Table 1. The obtained formation constants, revealed that AMTOT could be used as an excellent ion carrier for preparation of a selective Cu(II) membrane sensor.
Response of the sensors based on AMTOT to Cu(II) ions
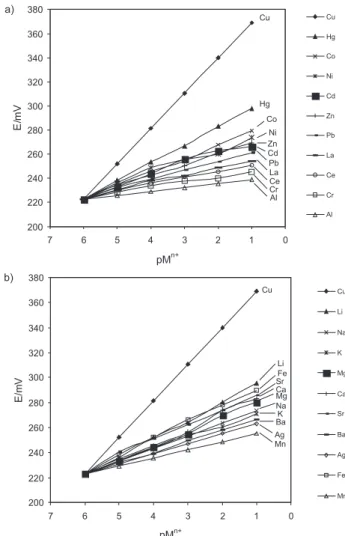
In next experiment, AMTOT was used as a neutral ion carrier to prepare a number of membrane sensors for some metal ions and their potential responses were measured,
and the results are shown in Figure 2a and 2b. It can be seen that the membrane based on AMTOT displays a Nernstian response to the concentration of Cu(II) ions in a wide concentration range.
Effect of membrane composition on the potential response of the Cu(II) sensor based on AMTOT
Since the sensitivity and selectivity obtained for a given ionophore depend significantly on the membrane ingredients, the nature of solvent mediator and additive
Table 1. The formation constants of AMTOT __ Mn+ complexes
Cation log Kf Cation log Kf
Cu2+ 04.12 ± 0.16 Cr3+ 2.26 ± 0.03
Hg2+ 03.22 ± 0.04 Fe3+ 2.18 ± 0.12
Co2+ 02.31 ± 0.03 Pb2+ 2.33 ± 0.07
Ni2+ 2.65 ± 0.1 Al3+ < 2
Cd2+ 02.54 ± 0.05 Ag+ < 2
Sr2+ 02.89 ± 0.02 La3+ 2.62 ± 0.08
Mn2+ < 2 Ce3+ 2.46 ± 0.05
Zn2+ < 2 K+ 2.24 ± 0.06
Figure 2. Potential responses of various ion-selective electrodes
used.30-40 We investigated the influences of membrane
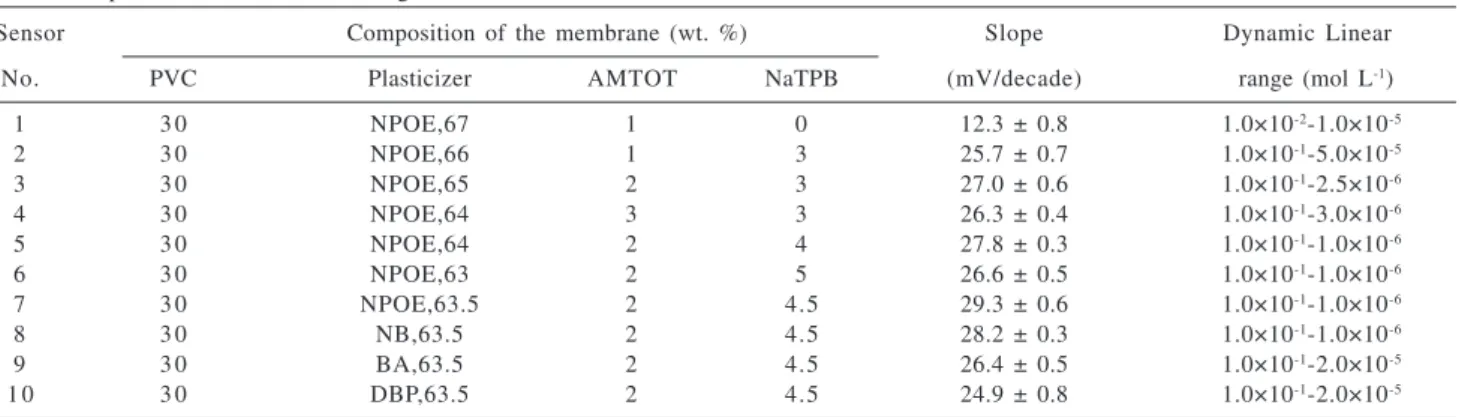
compositions on the potential responses of the Cu(II) sensor. The results are summarized in Table 2. It can be seen that increasing the amount of ionophore, up to a value of 2%, in the presence of 4.5% NaTPB, and 63.5% of polar solvent (NPOE) results in the best sensitivity. It is well known that the presence of lipophilic anions in a cation-selective membranes based on neutral carrier not only diminishes the ohmic resistance and enhances the response behavior and selectivity but also, in cases where the extraction capability is poor, increases the sensitivity of the membrane electrodes.40-44 However, the
membranes with the composition of 30% PVC, 2% AMTOT, 4.5% NaTPB, and 63.5% NPOE show a Nernstian potential response.
Calibration graph and statistical data
The potential response of the proposed sensor based on AMTOT (composition no. 7) at varying concentrations of copper ions shows a linear response to the concentration of copper ions in the range 1.0 ×10⁻⁶-1.0 × 10⁻¹ mol L-1
(Figure 3). The slope of calibration graph was 29.3 ± 0.6 mV per decade of the concentration of copper ions. The limit of detection of the sensor, as determined from the intersection of the two extrapolated segments of the calibration graph is 6.2 × 10⁻⁷ mol L-1. The standard
deviation of eight replicate measurements is ± 0.5 mV. The proposed PVC-based membrane sensor could be used for at least nine weeks (using one hour per day, and then, washed and dried). After this time, the slope of the electrode reduces (from 29.3 to 27.6 mV per decade).
Life-time study
For evaluation of stability and lifetime of the proposed membrane sensor, four same electrodes were chosen and tested over a period of 12 weeks. During this period, the
electrodes were used over extended period of time (one hour per day).45-47 After 9 weeks, a slight gradual decrease in the
slopes (from 29.3 to 27.6 mV per decade) was observed.
Effect of pH on the response of the electrode
In order to study the effect of pH on the performance of the sensor, the potentials were determined in the pH range of 1.5-10.0 (the pH was adjusted by using concentrated NaOH or HCl) at two concentrations (1.0 × 10⁻² and 1.0 ×
10-3 mol L-1) of Cu2+ and the results are depicted in Figure
4a and 4b. As seen, the potential response of the sensor remains constant in the pH range of 2.5-7.0. At lower pH than 2.5, an increasing in potential was observed. This is due to the response of the membrane to hydronium ion (protonation of nitrogen atoms in acidic media). At higher pH values than 7.0, a decreasing in potential, due to the
Table 2. Optimization of membrane ingredients
Sensor Composition of the membrane (wt. %) Slope Dynamic Linear
No. PVC Plasticizer AMTOT NaTPB (mV/decade) range (mol L-1)
1 3 0 NPOE,67 1 0 12.3 ± 0.8 1.0×10⁻²-1.0×10⁻⁵
2 3 0 NPOE,66 1 3 25.7 ± 0.7 1.0×10⁻¹-5.0×10⁻⁵
3 3 0 NPOE,65 2 3 27.0 ± 0.6 1.0×10⁻¹-2.5×10⁻⁶
4 3 0 NPOE,64 3 3 26.3 ± 0.4 1.0×10⁻¹-3.0×10⁻⁶
5 3 0 NPOE,64 2 4 27.8 ± 0.3 1.0×10⁻¹-1.0×10⁻⁶
6 3 0 NPOE,63 2 5 26.6 ± 0.5 1.0×10⁻¹-1.0×10⁻⁶
7 3 0 NPOE,63.5 2 4.5 29.3 ± 0.6 1.0×10⁻¹-1.0×10⁻⁶
8 3 0 NB,63.5 2 4.5 28.2 ± 0.3 1.0×10⁻¹-1.0×10⁻⁶
9 3 0 BA,63.5 2 4.5 26.4 ± 0.5 1.0×10⁻¹-2.0×10⁻⁵
1 0 3 0 DBP,63.5 2 4.5 24.9 ± 0.8 1.0×10⁻¹-2.0×10⁻⁵
Figure 3. Calibration curve of the copper electrode based on AMTOT
formation of insoluble of copper hydroxide, was observed.
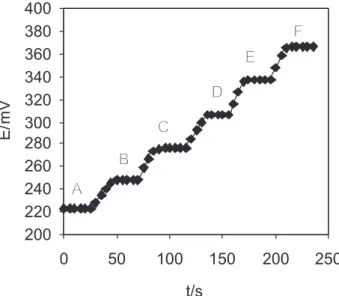
Dynamic response time of the Cu(II) sensor
Dynamic response time is an important factor for any ion-selective electrode. In this study, the practical response time of the proposed sensor was recorded by changing the concentration of copper ion in a series of solution, in the range of 1.0 × 10⁻⁶ to 1.0 × 10⁻¹ mol L-1, and the results are
shown in Figure 5. As can be seen from Figure 5, in the whole concentration range the sensor reaches its equilibrium response, very fast (<20 s).
Selectivity of the Cu(II) electrode
The influence of interfering ions on the response behavior of any ion-selective sensor is usually described in terms of selectivity coefficients, Ksel. In this work, we
determined selectivity coefficients with matched potential method (MPM).48-52 According to this method, a specified
activity (concentration) of primary ions (A, 5.0 × 10⁻⁵ mol
L-1 of copper ions) is added to a reference solution (1.0 ×
10-6 mol L-1 of copper ion) and the potential is measured.
In a separate experiment, interfering ions (B, 1.0 × 10⁻¹ mol
L-1) are successively added to an identical reference
solution, until the measured potential matches the one obtained before adding primary ions. The matched potential method selectivity coefficient, KMPM, is then
given by the resulting primary ion to interfering ion activity (concentration) ratio, KMPM = a
A/aB.
The resulting potentiometric selectivity coefficients values are summarized in Table 3. As it is immediately obvious, for all diverse ions used, the selectivity coefficients of the electrode are in the order of 8.5 × 10⁻³ or smaller,
indicating they would not significantly disturb the functioning of the Cu(II) selective membrane sensor. It is also worth noticing that the response of the Cu(II) sensor was found to be insensitive to the nature of the anions used.
Figure 5. Dynamic response time of the copper electrode for step
changes in the concentration of Cu2+ : A) 1.0 × 10⁻⁶ mol L-1, B) 1.0 ×
10-5 mol L-1, C) 1.0 × 10⁻⁴ mol L-1, D) 1.0 × 10⁻³ mol L-1, E) 1.0 × 10 -2 mol L-1, F) 1.0 × 10⁻¹ mol L-1.
Table 3. Selectivity coefficients of various interfering ions
Ions K M
C P U
M
2 + ,B Ions K M
C P U
M 2 + ,B
Hg2+ 8.5×10⁻³ Mn2+ 8.6×10⁻⁴
Co2+ 4.1×10⁻³ Fe3+ 8.2×10⁻³
Ni2+ 2.2×10⁻³ Ag+ 2.1×10⁻³
Cd2+ 5.0×10⁻³ Li+ 8.5×10⁻³
Zn2+ 2.3×10⁻³ Na+ 7.9×10⁻³
Pb2+ 1.4×10⁻³ K+ 6.5×10⁻³
La3+ 8.7×10⁻⁴ Mg2+ 6.7×10⁻³
Ce3+ 7.6×10⁻⁴ Ca2+ 7.6×10⁻³
Cr3+ 5.4×10⁻⁴ Sr2+ 6.4×10⁻³
Al3+ 3.3×10⁻⁴ Ba2+ 2.5×10⁻³
Figure 4. The effect of the pH of the test solutions (1.0 × 10⁻² mol
L-1 and 1.0 × 10⁻³ mol L-1) on the potential response of the copper
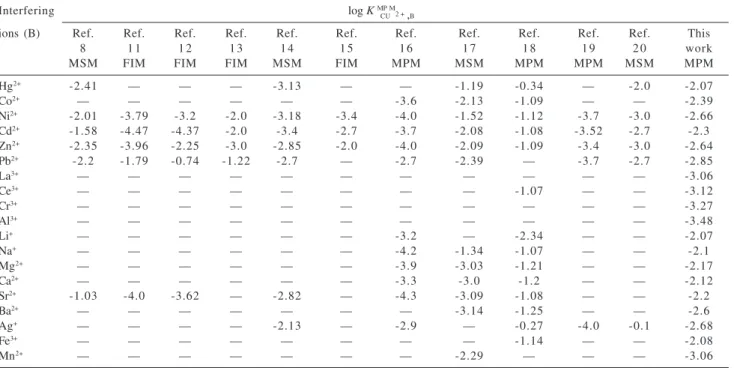
Table 4 compared the selectivity coefficients of the Cu(II) sensor with those of the best previously Cu(II) electrodes reported in the literature by other researchers.8,11-20 As it is
obvious, the selectivity coefficients of the electrode for majority of cations, that tested is superior respect with the best previously reported copper sensor.
Analytical application
The proposed Cu2+ ion-selective electrode was found
to work well under the laboratory conditions. It was successfully applied to the determination of copper from industrial samples. With the use of the membrane sensor’s calibration curve, the copper content in the sample solution obtained from triplicate measurement with electrode (21.3 ± 0.6 μg mL-1) was found to be in satisfactory agreement
with that determination by atomic absorbtion spectrometry (21.1 ± 0.4 μg mL-1). It was also used as an indicator
electrode in titration of 1.0 × 10⁻⁴ mol L-1 solution of copper
ions with a standard 1.0 × 10⁻² mol L-1 EDTA and the
resulting titration curve is shown in Figure 6. As can be seen from Figure 6, the sensor can monitor the amount of copper ions.
Acknowledgements
The authors express their appreciation to the Research Council of the University of Quchan for the financial support of this work.
References
1. Marstone, H. R.; Physiol. Rev. 1952, 32, 56.
2. Dadfarnia, S.; Shamsipur, M.; J. Membr. Sci. 1992, 75, 61. 3. Mason, B.; Principles of Geochemistry, Wiley: New York,1971. 4. Greenwood, N. M.; Earnshaw, A.; Chemistry of Elements,
Pergamon Press: New York,1984.
5. Janata, J.; Jasowicz, M.; DeVaney, D. M.; Anal. Chem.1994, 66, 207R.
6. Kamata, S.; Yamasaki, Y.; Higo, M.; Bhale, A.; Fukanaga, Y.; Analyst 1988, 113, 45.
Table 4. Comparison of the selectivity coefficients of different Cu(II) electrodes
Interfering log K M
C P U
M 2 + ,B
ions (B) Ref. Ref. Ref. Ref. Ref. Ref. Ref. Ref. Ref. Ref. Ref. This
8 1 1 1 2 1 3 1 4 1 5 1 6 1 7 1 8 1 9 2 0 work
MSM FIM FIM FIM MSM FIM MPM MSM MPM MPM MSM MPM
Hg2+ -2.41 — — — -3.13 — — -1.19 -0.34 — -2.0 -2.07
Co2+ — — — — — — -3.6 -2.13 -1.09 — — -2.39
Ni2+ -2.01 -3.79 -3.2 -2.0 -3.18 -3.4 -4.0 -1.52 -1.12 -3.7 -3.0 -2.66
Cd2+ -1.58 -4.47 -4.37 -2.0 -3.4 -2.7 -3.7 -2.08 -1.08 -3.52 -2.7 -2.3
Zn2+ -2.35 -3.96 -2.25 -3.0 -2.85 -2.0 -4.0 -2.09 -1.09 -3.4 -3.0 -2.64
Pb2+ -2.2 -1.79 -0.74 -1.22 -2.7 — -2.7 -2.39 — -3.7 -2.7 -2.85
La3+ — — — — — — — — — — — -3.06
Ce3+ — — — — — — — — -1.07 — — -3.12
Cr3+ — — — — — — — — — — — -3.27
Al3+ — — — — — — — — — — — -3.48
Li+ — — — — — — -3.2 — -2.34 — — -2.07
Na+ — — — — — — -4.2 -1.34 -1.07 — — -2.1
Mg2+ — — — — — — -3.9 -3.03 -1.21 — — -2.17
Ca2+ — — — — — — -3.3 -3.0 -1.2 — — -2.12
Sr2+ -1.03 -4.0 -3.62 — -2.82 — -4.3 -3.09 -1.08 — — -2.2
Ba2+ — — — — — — — -3.14 -1.25 — — -2.6
Ag+ — — — — -2.13 — -2.9 — -0.27 -4.0 -0.1 -2.68
Fe3+ — — — — — — — — -1.14 — — -2.08
Mn2+ — — — — — — — -2.29 — — — -3.06
Figure 6. Potentiometric titration curve of 25.0 mL 1.0 × 10⁻⁴ mol
7. Casabo, J.; Mestres, L.; Esciche, L.; Texidore, F.; Perez-Jimenez, C.; J. Chem. Soc. Dalton Trans. 1991, 1961.
8. Shamsipur, M.; Rouhani, S.; Ganjali, M. R.; Eshghi, H.; Sharghi, H.; Microchem. J.1999, 63, 202.
9. Shamsipur, M.; Avanes, A.; Javanbakht, M.; Ganjali, M. R.; Sharghi, H.; Anal. Sci. 2002, 18, 875.
10. Kamata, S.; Bhale, A.; Funkanaga, Y.; Murata, H.; Anal. Chem. 1989, 60, 2464.
11. Kamata, S.; Murata, H.; Kubo, Y.; Bhale, A.; Analyst 1989, 114, 1029.
12. Brzozka, Z.; Analyst 1988, 113, 1803.
13. Shvedene, N. V.; Sheina, N. M.; Silasie, G. V.; J. Anal. Chem. USSR1991, 46, 252.
14. Shamsipur, M.; Javanbakht, M.; Mousavi, M. F.; Ganjali, M. R.; Lippolis, V.; Garau, A.; Tei, L.; Talanta2001, 55, 1047. 15. Cobben, P. L. H. M.; Egherink, R. J. M.; Bomer, J. B.; Bergveld,
P.; Verboom, W.; Reinhoudt, D. N.; J. Am. Chem. Soc.1992, 114, 10573.
16. Ganjali, M. R.; Golmohammadi, M.; Yousefi, M.; Norouzi, P.; Salavati-Niasari, M.; Javanbakht, M.; Anal. Sci. 2003, 19, 223.
17. Alizadeh, N.; Ershad, S.; Naeimi, H.; Sharghi, H.; Shamsipur, M.; Fresenius J. Anal. Chem. 1999, 365, 511.
18. Singh, L. P.; Bhatnagar, J. M.; Talanta 2004, 64, 313. 19. Ganjali, M. R.; Emami, M.; Salavati-Niasari, M.; Bull. Korean
Chem. Soc. 2002, 23, 1394. 20. Ren K.; Talanta 1989, 36, 767.
21. Poursaberi, T.; Hajiagha-Babaei, L.; Yousefi, M.; Rouhani, S.; Shamsipur, M.; Kargar-Razi, M.; Moghimi, A.; Aghabozorg, H.; Ganjali, M. R.; Electroanalysis 2001, 13, 1513. 22. Gupta, K. C.; D’Arc, M. J.; Sens. Actuators B 2000, 62, 171. 23. Ganjali, M. R.; Zamani, H. A.; Norouzi, P.; Adib, M.; Accedy,
M.; Acta Chim. Slov., submitted.
24. Ganjali, M. R.; Zamani, H. A.; Norouzi, P.; Adib, M.; Accedy, M.; SENSORS, submitted.
25. Ganjali, M. R.; Zamani, H. A.; Norouzi, P.; Adib, M.; Rezapour, M.; Accedy, M.; Bull. Korean Chem. Soc. 2005, 26, 579. 26. Tawarah, K. M.; Mizyed, S. A.; J. Solution Chem. 1989, 18,
387.
27. Debye, P.; Huckel, E.; Phys. Z.1928, 24, 305. 28. Takeda, Y.; Bull. Chem. Soc. Jpn. 1983, 56, 866. 29. Nicely, V. A.; Dye, J. I.; J. Chem. Educ. 1971, 48, 443. 30. Amarchand, S.; Menon, S. K.; Agrawal, Y. K.; Electroanalysis
2000, 12, 522.
31. Ganjali, M. R.; Daftari, A.; Rezapour, M.; Poursaberi, T.; Haghgoo, S.; Talanta 2003, 59, 613.
32. Shamsipur, M.; Yousefi, M.; Hosseini, M.; Ganjali, M. R.; Anal. Chem.2002, 74, 5538.
33. Ganjali, M. R.; Kiani-Anbouhi, R.; Shamsipur, M.; Poursaberi, T.; Salavati-Niasari, M.; Talebpour, Z.; Emami, M.; Electroanalysis 2004, 16, 1002.
34. Ganjali, M. R.; Qomi, M.; Daftari, A.; Nourozi, P.; Salavati-Niasari, M.; Rabbani, M.; Sens. Actuators B 2004, 98, 92. 35. Gupta, V. K.; Jain, S.; Chandra, S.; Anal. Chim. Acta 2003,
486, 199.
36. Mittal, S. K.; Kumar, S. K. A.; Sharma, H. K.; Talanta 2004, 62, 801.
37. Ganjali, M. R.; Pourjavid, M. R.; Rezapour, M.; Haghgoo, S.; Sens. Actuators B 2003, 89, 21.
38. Ganjali, M. R.; Rezapour, M.; Pourjavid, M. R.; Salavati-Niasari, M.; Poursaberi, T.; Anal. Lett. 2003, 36, 881. 39. Rosatzin, T.; Bakker, E.; Suzuki, Y.; Simon, W.; Anal. Chim.
Acta 1993, 280, 197.
40. Ammann, E.; Pretsch, E.; Simon, W.; Lindner, E.; Bezegh, A.; Pungor, E.; Anal. Chim. Acta 1985, 171, 119.
41. Huster, M.; Gehring, P. M.; Morf, W. E.; Simon, W.; Anal. Chem. 1990, 63, 1330.
42. Bakker, E.; Buhlmann, P.; Pretsch, E.; Chem. Rev. 1997, 97, 3083.
43. Ganjali, M. R.; Emami, M.; Salavati-Niasari, M.; Bull. Korean Chem. Soc. 2002, 23, 1394.
44. Eugster, R.; Gehrig, P. M.; Morf, W. E.; Spichiger, U. E.; Simon, W.; Anal. Chem. 1991, 63, 2285.
45. Ganjali, M. R.; Ghorbani, M.; Norouzi, P.; Daftari, A.; Faal-Rastegar, M.; Moghimi, A.; Sens. Actuators B 2004, 100, 315. 46. Ganjali, M. R.; Emami, M.; Rezapour, M.; Shamsipur, M.; Maddah, B.; Salavati-Niasari, M.; Hosseini, M.; Talebpoui, Z.; Anal. Chim Acta 2003, 495, 51.
47. Ganjali, M. R.; Hosseini, M.; Basiripour, F.; Javanbakht, M.; Hashemi, O. R.; Faal-Rastegar, M.; Shamsipur, M.; Bachanen, G. W.; Anal. Chim. Acta 2002, 464, 181.
48. Umezawa, Y.; Umezawa, K.; Sato, H.; Pure Appl. Chem.1995, 67, 507.
49. Bakker, E.; Electroanalysis 1997, 9, 7.
50. Bakker, E.; Pretsch, E.; Buhlmann, P.; Anal. Chem.2000, 72, 1127.
51. Tohda, K.; Dragoe, D.; Shibata, M.; Umezawa, Y.; Anal. Sci. 2001, 17, 733.
52. Umezawa, Y.; Buhlmann, P.; Umezawa, K.; Tohda, K.; Amemiya, S.; Pure Appl. Chem.2000, 72, 1851.
Received: January 30, 2005