A
AnnaalleelleeUUnniivveerrssiittăăţţiii iddiin nOOrraaddeeaa,, SSeerriiaa GGeeooggrraaffiiee Year XXXXVV, no. 22//22001155 (December), pp. 115577--116677
ISSN 11222211--11227733, E-ISSN 22006655--33440099 Article no. 225522110033--667711
http://istgeorelint.uoradea.ro/Reviste/Anale/anale.htm
THE USAGE OF TECHNOLOGIES IN TERRESTRIAL
MEASUREMENTS FOR HAZARD MAPS
D
Daann VVEELLEE
„Babeş-Bolyai” University Cluj-Napoca, Faculty of Geography, Department of Physical and Technical Geography, Clinicilor 5-7 Cluj-Napoca, Romania, e-mail: [email protected]
M
Miirrcceeaa AALLEEXXEE
„Babeş-Bolyai” University Cluj-Napoca, Faculty of Geography, Department of Physical and Technical Geography, Clinicilor 5-7 Cluj-Napoca, Romania, e-mail: [email protected]
I
Iooaann SSTTOOIIAANN
National Center of Cartography,
1A Expoziției Blvd., Sector 1, Bucharest, e-mail: [email protected]
Abstract: In the context of natural phenomena (earthquakes, floods, landslides etc.) bring economical and social prejudices year by year, watching on them and taking decisions becomes mandatory for reducing the material and human lives loss. Making hazard maps represents a tool used on wide global scale but also particularly in our country. This paper work has the purpose to reveal the interests of certain authors related to the usage of the new technologies of terrestrial measurements (GPS technologies, photogrammetry, cartography and of remote sensing) in order to make these hazard maps.
Key words: terrestrial measurements, risk, hazard maps, management.
* * * * * *
INTRODUCTION
Hazard maps are digital maps scaled 1:25 000 to 1:50 000, representing wide areas at local level purposed to determine high risk zones for earthquakes, floods, landslides, fires etc. In this work paper we are only giving attention to hazard maps for floods and landslides. Starting with hazard maps, risk maps are realized at higher scale (1:5 000-1:10 000) which are even more complete and they allow a detailed analysis of the loss evaluation and they can also be used for obtaining building permission and making general and local urbanism drafts.
Digital maps designed for hazard and risk maps control are generally made of graphical data basis (the digital map itself) which is being attached the attributes basis structured on connected areas regarding the general features of places situated in the area zones affected by natural hazards such as earthquakes, landslides, floods and also those ones of potential areas (Stoian, 2006; Stoian, 2007). This way, the content of these maps starts to be shaped and it has the following structure (figure 1).
Figure 1. Digital map support for hazard map making
Figure 2. The digital map representing the relief in the Municipality of Cluj-Napoca
- geographical localizing, natural area, geomorphologic data, hydrographical network; - dynamical parameters of the land, geological features;
- territorial structure, categories of usage;
- localities affected by natural risks contented by law 575/ 2001;
- hydro technical works which can affect the pass regimen; - works of landed improvement;
- works regarding the communications and transport networks for road traffic, railway traffic and maritime traffic;
- works of crossing river’s inflows.
Categories and the structure of buildings, highness regimen, construction materials. The representation of the relief which has a great importance for hazard maps it’s made of level curves or by representing the digital pattern of the land / yard (figure 2).
The methodologies of usage for data acquiring regarding plotting of hazard and risk maps were based on classical and modern tools, starting with GPS technologies for making the support system within the geodesic datum adopted (Krasovski - 1942 ellipsoid, protection system Stereo 70, Marea Neagră 1975 altitude system, 1990 edition) technologies of making ortophotos based on photogrammetric flights made between 2005-2010 and satellite multispectral recordings, for analysis and interpretation.
THE CONTENT OF HAZARD MAPS
In the very present phase of editing hazard maps for floods there are used recorded information and data from credible and pertinent sources whose goal is to localize the areas which are likely to be flooded only by highlighting the localities which had been affected, depending on the type of flooding and also the physical and valuable loss made on different levels (Prăvălie & Costache, 2013). The data referring to the hydrographical county network, the features of hydrometrical stations located on the main rivers are extremely important for estimation and authenticity regarding the flooding management and also for treating and checking mathematical patterns related to hydraulics calculations and managing wide waters (Bălteanu & Alexe, 2001).
Also, watching the hydrographical network has an important role in the following are: - the analysis of hydro basinal already existing systems and of those which are proposed to
be realized;
- technical issues of local committees for defending against floods and for emergency situations;
- technical data of the defending plan belonging to habitational areas.
The data quantum given to hydrometrical stations can be assimilated only for the localities situated in the proximity of the stations. The data regarding flooding curves for various probabilities crossed along the river’s pan studied to bound floodable areas are made and approved by MMGA, ANAR in conformity with the attachments, responsibilities and competences given by law and they can be fulfilled after delivery.
The features of lithology geological stereotypes, which are added to those of geomorphological type and their climacteric particularities, lead, talking about certain variable dimensioned domains, high values of slipping probabilities, which leads to their circumscription in a group of lands exposed to hazards, to landslides (Coșarcă et al., 2006).
For example, in conformity with „Guide regarding macro zoning of Romanian territory from the view point of landslides risks, 1999” the landslides from Cluj county are, generally, to be considered in the short depth category 1 to 5 m, rarely in the superficial (less than 1 m) and deep (5 to 20 m) categories, mainly progressive, in areas with highlighted and regressive slopes in the versants that limit the mellows reactivated or primary. So that the following layers and features had been proposed (table 1).
In order to give examples for the meaning of extracting information from attribute base, we chose the period most affected by floods, in Cluj, year 2002. The main features of the hydrometrical stations located on the county’s rivers relevant for the chosen period, are shown in table 2.
through value estimation and geographical distribution of the risk coefficients Ka-Kh (table 3) and
by mentioning the group of potential (low, average, high) to establish the probability level of slips, which would lead to identify, localize, and bound the areas which are exposed to the slipping hazard. Finally, there have been made measure proposals to prevent and reduce the effects of landslides, as the Law 575/ 2001 regarding the Plan of national territory management- the 5th section, natural risk areas- asks.
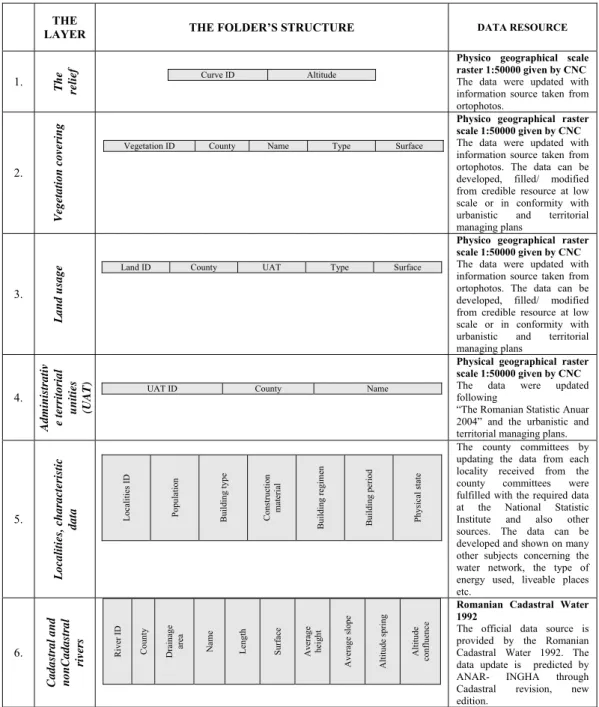
Table 1. Database for hazard mapping
THE
LAYER THE FOLDER’S STRUCTURE DATA RESOURCE
1. The
relief
Curve ID Altitude
Physico geographical scale raster 1:50000 given by CNC The data were updated with information source taken from ortophotos.
2.
Vegetation covering
Vegetation ID County Name Type Surface
Physico geographical raster scale 1:50000 given by CNC The data were updated with information source taken from ortophotos. The data can be developed, filled/ modified from credible resource at low scale or in conformity with urbanistic and territorial managing plans
3.
Land usage
Land ID County UAT Type Surface
Physico geographical raster scale 1:50000 given by CNC The data were updated with information source taken from ortophotos. The data can be developed, filled/ modified from credible resource at low scale or in conformity with urbanistic and territorial managing plans
4.
Adm
inistrativ
e territorial
unities (UAT)
UAT ID County Name
Physical geographical raster scale 1:50000 given by CNC The data were updated following
“The Romanian Statistic Anuar 2004” and the urbanistic and territorial managing plans.
5. Localities, charact eristic data Loc alitie s I D Population
Building type Construction
ma te ria l Building r egime n
Building period P
hysi
cal
st
at
e
The county committees by updating the data from each locality received from the county committees were fulfilled with the required data at the National Statistic Institute and also other sources. The data can be developed and shown on many other subjects concerning the water network, the type of energy used, liveable places etc. 6. Cadastr al and nonCadastr al
rivers R
iver ID County
Drainage
area Name
Length Su
rface Averag e height Averag e sl ope Altitude spr ing Altitude confluenc e
Romanian Cadastral Water 1992
7.
Already m
ade
and to be done
flutes
Channel ID County Drainage ar
ea
Name Length Type Sta
te
Physical geographical raster
scale 1:50000 provided by
CNC with certain mentions of County Committees through ANIF and SGA.
8.
Artificial and natural lakes
Lake ID County
Drai nage ar ea Name Volume NNR S u rface Usage
Romanian Cadastral water 1992 edition. The official data resource which works in the present represents The Romanian Cadastral Water 1992 edition. It is predicted the data update by ANAR – INHGA, through the Cadastral revision, new edition.
9.
H
idrotechnical and
managing works existing in
the construction a
rea
Work ID
County Drai
nage ar
ea
River Type Length
Obje
ctive
Physical geographical raster
scale 1:50000 provided by
CNGCFT information taken from Hydrographical space managing drafts, shown by MMGA-ANAR. There had been made certain formalities regarding the inclusion of data contented by GIS data edited in 2005 under the ANAR watching, regarding the main hydrotechnical works with updated information.
10
Roads and r
a ilway s Roa d I D County Name
Category Type Material
Technical from Counties committees
There have been made certain formalities to MTCT and AND in order to gain the viability state of the roads. The data can be fulfilled during the projection and building of the reabilitation of the roads and main roads network and also the ones of the dates provided by the Cadastral roads which is going to be made by AND. Table 2. Characteristic data of hydrometric stations (Cluj County)
2002 CLUJ
17 localities
Iara, Aghireșu, Baciu, Valea Ierii, Căpușu Mare, Mărișel, Măguri Răcătău, Beliș, Chiuiești, Mociu, Cluj-Napoca,
Vânători, Ciucea,
Mărgău, Călățele, Săcuieu, Băișoara
06.03-09.03.2002 Blast
4-30. 07.2002
Spils from the slopes, hail, wind
01.08-15.08
Flow of pr. Visag, discharge from the versants
- 314 houses and adds on establishments
- 7 social objective - 152,3 km DJ + DC
- 37 arches and footbridges - 400 ha infield - 7 hydrotechnycal constructions
To quantify the hazards dued to landslides, have been followed the following purposes (Olaru et al., 2009):
- calculating the coefficients of influence and drawing thematically maps using GIS;
- calculating the medium hazard coefficient and plotting the hazard map for slipping by over putting the thematical maps in GIS.
Table 3. Mentioning the coefficients which have a contribution to the risk evaluation for landslides (Dordea, 2007)
Symbol Criteria
The potential of landslides
LOW MEDIUM HIGH The probability of landslides and the risk coefficient
Practically
zero Reduced Medium
Medium-high High Very high
0 <0.10 0.10-0.30 0.31-0.50 0.51-0.80 >0.80
Ka Lithologycal
Cliffy bolds, massive, compacts or broken
Most of the depositions which are part of the covering rock formations (diluvial, colluvial and proluvial deposits) and from the layering rocks category pelitic stratified rocks, such argillite, clays and marly limestones, chalk, metamorphic rocks, especially epizone schists and less mid-zone schists, strongly alterated and exfoliated, certain magmatic segregation strongly alterated etc.)
Unconsolidated detrital sedimentary rocks - necimen-tion, such as clays, clays fat saturated soft plastic - plastic consistent with swelling and large contractions, montmorillonite clays, the power-nic expansive, dust and sand sized loose, able submersible sata, breccias salt etc.
Kb
Horizontal relief plan, affected by crummy erosion, vales that form the hydrographical network being in an advanced maturity stage
Mound relief, specific to piedmonts and elevated plane areas spited by hydrographical areas next to vales which have a certain maturity stage, bounded by medium sized and generally medium or small dips versants
Relief characteristic of zones of hilly and mountainous, heavily affected by a dense network of young valleys high slopes, valleys The majority of the Sub-vente (direction parallel to the layers).
Kc Structural
massive rocks structures of magmatic segregation origin, layered sedimentary rocks, with horizontal layers, metamorphic rocks
covered by horizontal layers
Most folded and faulted geological structures are affected by cleavage and cracks diapir structures, areas that mark the top blades sariaj
Geological structures characteristic geosynclines areas in flysch and molasses formations of marginal basins, layered geological structures, strongly folded and deployed affected by a dense network of cleavage, fissures and stratified.
Kd Hydrologic
and climatical
Generally arid areas with low average rainfall. Flows spilled into the river valley whose watersheds extend the hilly and mountainous areas generally controlled by precipitations. The prevailing riverbeds sedimentation processes, lateral erosion occurring only during floods.
Moderate precipitation amounts. The main river valleys reached the stage of maturity while their tributaries are still in youth stage. During floods there is both vertical and lateral erosion. Important depositions of solid flow.
Precipitation of long-term slow, with high infiltration of water into the stone. At rains fast speeds drain solids transport flow. Predominance mine vertical erosion.
low hydraulic gradients. Filtration forces are feeble. The free level of groundwater is situated deep down in the ground.
flow. Filtration forces can influence the slope values Groundwater level generally lies less than 5 meters
under high hydraulic gradients. At the base of the slopes, sometimes in verse, the springs of water. There is a slope to the surface flow inside their developing filtrate forces that may contribute to the onset of ground nuts-books.
Kf Seismic Earthquake intensity of on MSK scale less than 6 Earthquake intensity of 6-7 degree Seismical intensity higher than 7
Kg Silvan
Arboreal vegetation coverage more than 80%. Deciduous forests with grand trees.
Arboreal vegetation coverage sticks between 20% and 80%. Deciduous and coniferous trees of various ages and sizes.
Arboreal vegetation coverage lower than 20%
Kh Anthropic
On the slopes there are not great construction executed, water accumulations are missing
On the slopes are built certain works (roads and railway platforms, coastal channels, careers). With limited extension and proper slope protection
Slopes affected by a huge water pipe network and sewerage, roads, railways, canals coast, careers, overloading them in the upper deposits landfill constructions. Lakes that wet bottom slopes.
MODERN TECHNOLOGIES USED FOR IDENTIFYING AND BOUNDING THE HAZARD AND RISK AREAS OF THE NATURAL PHENOMENA
Technologies based on sensors which are used in photogrammetry and remote sensing, are one of the most proper means operational available used in order to find out digital dates to represent the relief (Alexe & Holobâcă, 2003). They offer flexibility to the patterning process and bounding the altimetry data, ensuring the necessary precision and realizing a high automatising level based on few quality parameters, results and final costs, very closed to their optime value (Ionescu, 2004; Zăvoianu, 1999).
Using altimetric data extracted from the satellite images for identifying and bounding the zones of hazard and risk of natural phenomena, represents the capacities and bounding of the photometrical analytical and digital technology and also the changes which follows as a result due to the new digital cameras coming, specific elements which define the superior ascendent evolution and dynamics of this technology and its usage in the context of identifying hazard and risk zones of natural phenomena.
An aerial image defines a perspective view upon the land, as this is seen from upside, view which is also known under the name of orthogonal. If the image of the photogram is taken exactly vertical, for example taken a photo with a camera which has the optical axe on the same position as the vertical direction of the place, the higher planimetric details will have on the photogram image a different scale compared to the one of details located to a lower altitude reported it the sea level (Linder, 2003).
Figure 3. Getting rectified images (orthorectification)
Figure 4. Plotting hazard map for floods- the digital model of the land
belong to certain keepers and also other asymmetrical planimetrical details, which do not appear on the images taken while flying and there are not practically plotted stereophotogrammetrical but based on measuring angles and distances, realized using topographic technologies (Coșarcă et al., 2006).
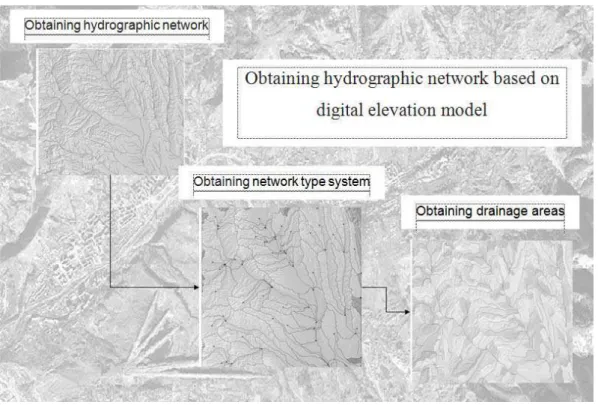
Figure 5. Obtaining hydrographical networks by working with satellite images
So, because the administrative bounds and also lot limits belonging to different owners are not visible on aerial or satellite images for their plotting are always used the topographic upheavals. All these requiring of the topographic plotting can be satisfied through stereophotogrammetry or combinated with digital altitude data produced by IFSAR (Interferometric Synthetic Aperture Radar) equipment or the ones belonging to LIDAR (figure 4).
In this way another good example is the one of obtaining the hydrographical network (figure 5) obtained by the aero walked LIDAR ad also through digital data which came through sonar equipment (Mihai, 2009; Stoian et al., 2005).
To the file containing data obtained through digital pattern it is added the data vectorial kit composed by localities, roads, railways. Using the determination functions of the running off and those of followings based on digital values from the digital models it can be anticipated the flow and length of a flood, of a bad weather and also the places, localities or the communication ways (figure 6).
CONCLUSIONS
Hazard maps ensure conditions of minimum acceptable risk based on some watching strategies of phenomena producing survival conditions for the population and the protection of the environment, in which the cartographical draft, to be more specific making thematical digital maps, based on calculating risks items and especially the integration of a very large informational volume included in the informatical geographical systems (GIS).
The maps gain these way analytical and practical features, growing their social usage side apart from those of scientifical and practical importance, being usually named as land’s mathematical patterns.
The patterns are used in order to study real or abstract physical phenomena, to create real and precise images of the reality but especially to create a virtual prototype, which describes the structure and the habit of natural phenomena in different conditions.
The interest for plotting risk maps on international level and national level, lately, has become bigger and bigger. Hazard maps are defined as being maps which indicates year by year the probability of natural phenomena apparition: earthquakes, floods, landslides.
Evaluating the potential of producing hazard is strongly linked by giving a certain frequency of observed apparitions based on the main features, which mainly depend on the data base quantity, on their quality, the data quantum, which implies a high degree of precision and detailing of the characteristic areas of hazard maps.
REFERENCES
Alexe M., Holobâcă I.H. (2003), Câteva consideraţii privind utilizarea teledecţiei în studiul inundaţiilor, Analele Universității din Oradea, Seria Geografie, tom XIII, p. 35-39, Oradea.
Bălteanu D., Alexe Rădița (2001), Hazarde naturale şi antropogene, Editura Corint, Bucureşti.
Coşarcă C., Onose D., Savu A., Negrilă A. (2006), Geometrical Expertise and Dimensional Control of the Construction to the Hydrotechnics Buildings, RevCAD nr. 8, p. 9-16, Alba Iulia.
Dordea D. (2007), Hărţi de risc la alunecări de teren. Studiu de caz – (Comuna Valea Lungă, Judeţul Alba), Proiect Envibucharestmap – Cnmp/modulul IV Parteneriate-MEC, Contract de cercetare-Prospecțiuni S.A.-Partener CNC 31-006 din 18.09.2007.
Ionescu I. (2004), Fotogrammetrie inginerească. Modelarea digitală altimetrică a terenului, Editura Matrix ROM, București.
Linder W. (2003), Digital Photogrammetry. Theory and Applications, Springer - Verlag Berlin. Mihai B.A. (2009), Teledetecție. Noțiuni și principii fundamentale, Editura Universității din București.
Murariu G., Praisler Mirela, Stoian I. (2009 b), Toward a grid technology based on numerical computation with fluent platform, The Annals of the University Dunărea de Jos of Galaţi, Mathematics, Physics, Chemistry, Informatics, Fascicle II, Supplement, Year III,p.143-147, Galați.
Olaru V., Stoian I., Stan C., Marunţeanu C., Scrădeanu D., Ştefănescu Beatrice ((2009), Decision support system for landslide risk management in a geographical area with high risk for natural disasters – terrarisc, RevCAD, p. 223-230, Alba Iulia.
Prăvălie R., Costache R. (2013), The vulnerability of the territorial-administrative units to the hydrological phenomena of risk (flash floods). Case study: the subcarpathian sector of buzău catchment, Analele Universității din Oradea, seria Geografie, nr. 1, p. 91-98, Oradea.
Stoian I. (2006), Elaborarea hărţilor de hazard la nivel judeţean, Buletinul de fotogrammetrie şi teledetecţie, nr. 32, Bucureşti.
Stoian I. (2007), Realizarea unui sistem informatic în vederea monitorizării situațiilor de criză la dezastre naturale, Buletinul de Fotogrammetrie şi teledetecţie, nr. 34, p. 3-13, Bucureşti.
Stoian I., Bârliba Luminița Livia (2009), Elemente de fotogrammetrie - note de curs, Editura Eurobit, Timișoara.
Stoian I., Bunea S., Insurățelu M. (2005), Realizarea hărților tematice, a hărților de risc și managementul crizelor utilizând tehnici de teledetecție, Revista de geodezie, cartografie și cadastru, volum 14, p. 403-409, Bucureşti.
Stoian I., Praisler M., Anghelescu A., Nacu V., Baroiu N. (2007), Monitorizarea hazardurilor şi riscurilor în caz de calamităţi naturale în arealul Dunărea de Jos, Proiect de cercetare RISKGAL nr. 31-070 din 20/09/2007- Centrul National de Cartografie, București.
Turdeanu L. (2000), Fotogrammetrie analitică, Editura Academiei, Bucureşti. Zăvoianu F. (1999), Fotogrammetria, Editura Tehnică,Bucureşti.
*** Ghid privind macrozonarea teritoriului României din punct de vedere al riscului la alunecări de teren, 1999, GEOTEC S.A. Bucureşti.
Submitted: Revised: Accepted and published online