SPATIAL PREDICTIVE MAPPING USING ARTIFICIAL NEURAL NETWORKS
S. Noack*, A. Knobloch, S.H. Etzold, A. Barth, E. Kallmeier
Beak Consultants GmbH, 09599 Freiberg, Germany - (silke.noack, andreas.knobloch, sven.etzold, andreas.barth, enrico.kallmeier)@beak.de
KEY WORDS Artificial Neural Network, Geodata Analysis, Modelling, GIS, Geo-hazard, Mineral Deposits, Slope Stability, Forest Pests, advangeo
ABSTRACT
The modelling or prediction of complex geospatial phenomena (like formation of geo-hazards) is one of the most important tasks for geoscientists. But in practice it faces various difficulties, caused mainly by the complexity of relationships between the phenomena itself and the controlling parameters, as well by limitations of our knowledge about the nature of physical/ mathematical relationships and by restrictions regarding accuracy and availability of data.
In this situation methods of artificial intelligence, like artificial neural networks (ANN) offer a meaningful alternative modelling approach compared to the exact mathematical modelling.
In the past, the application of ANN technologies in geosciences was primarily limited due to difficulties to integrate it into geo-data processing algorithms. In consideration of this background, the software advangeo® was developed to provide a normal GIS user with a powerful tool to use ANNs for prediction mapping and data preparation within his standard ESRI ArcGIS environment. In many case studies, such as land use planning, geo-hazards analysis and prevention, mineral potential mapping, agriculture & forestry advangeo® has shown its capabilities and strengths. The approach is able to add considerable value to existing data.
1. INTRODUCTION
The identification of potential risk areas for humans, animals, real estate, infrastructure or the localization of potential mineral resources are essential for both society and economy. Specific questions as “Where is a high geohazard risk and which preventive measures are possible?”, “Where are mineral exploration targets” or ”What are reasonable measures to avoid a pest infestation?“ should be answered efficiently and in acceptable time.
A growing amount of available geo-scientific data and the ongoing improvement of information technology are an excellent base for a broad data analysis aiming at getting more information about crucial relationships and interconnections as a fundament of the creation of predictive maps.
Generally, spatial phenomena/events can be modelled by various approaches, including:
mathematical-analytical methods for an accurate modelling of the processes conducting detailed studies of physical, chemical and other dependencies,
by an empirical or statistical approach, evaluating potentially factors with multivariate methods, based on data analysis and expert experiences and
geo-statistical modelling of the event.
The mathematical-analytical approach is a time and cost consuming process, which requires much model calibration. In most cases the approach is not really applicable because of data and knowledge limitations.
Geo-statistical approaches like “Kriging” interpret the spatial distribution and correlation of parameters, but do not consider other influencing factors that are relevant for the appearance of the quested event. This method is often used for regionalization
of parameters, e.g. like soil contamination, or mineral deposit grade models.
Multivariate approaches (Backhaus et al., 2003) which are considering different influencing factors and their relationships and allowing a certain generalization play an important role in data modelling. Modern computer science is able to calculate complex models using a large set of influencing factors and a big number of datasets.
Compared to the exact mathematical-analytical modelling, multivariate approaches offer several advantages:
they are applicable even if the relationships between the depending variable and the influencing factors are not really known.
they consider many influencing factors they work with available data
they are comparable quick and easy to use.
2. METHOD: ARTIFICIAL NEURAL NETWORKS
Artificial neural networks (ANN) allow a multivariate data analysis of complex problems. Their ability to learn from given examples without an explicit programming of problem solution allows a ubiquitous application. Even if the user does not really understand details of the relationships between the depending value and the controlling factors, the generation of a ”footprint“ by using given examples is possible. Another important advantage of ANN is its ability to generalize: unknown but similar input patterns of input data could also produce a plausible result.
Various authors have successfully applied ANN to forecast the occurrence and extent of spatial events. Examples of applications have included the accurate identification of slope failure processes (Fernandez-Steeger 2002), the modelling of The International Archives of the Photogrammetry, Remote Sensing and Spatial Information Sciences, Volume XL-2, 2014
spatial air pollution patterns (Lin et al. 2004) or the propagation of flood waves (Peters et al. 2006). Beak Consultants GmbH uses artificial neural networks for the modelling of geo-scientific problems since 2006.
The ANN approach is based on the functionality of a biological nervous system. This system is composed of many interconnected neurons (nerve cells), which receive process and transfer information. After reaching a certain threshold, nerve cells are activated and forward the information to other connected neurons. During a learning process the inter-connections are adapted. The simulation of these biochemical processes in an ANN is realized by artificial neurons. The connections are realized by directed interconnection weights (Backhaus et al. (2003) and Kriesel (2009)).
Artificial neural networks are usually organized in layers. The network topology describes the number of layers, the number of neurons in layers and the way of their interconnection: Important parameters are the direction of signal propagation (forward / backward) and the type and level of connection (completely connected / with shortcuts). Figure 1 shows a completely connected feed-forward network with 4-3-1 topology. On the right-hand side, a processing unit (neuron) is sketched with its input, output and activation functions.
Figure 1. Scheme of a feed-forward artificial neural network
The used paradigm of ANN is the Multilayer Perceptron (MLP). It consists of 3 or more layers: The input layer receives the values of the controlling parameters. The neurons of the hidden layer(s) and the output layer process the weighted signals from the neurons of its previous layer and calculate an output value applying an activating function. The output layer, typically consisting of only one neuron, represents the dependent variable to be modelled.
During the learning process the weights are adapted: After each iteration of processing the input information to output, the mean squared error (MSE) is calculated between expected and actual outputs (between modelled and real training data). The weights were adapted by using a defined learning algorithm with the aim of error minimization. The training is stopped after reaching a defined count of iterations (epochs) or if the error falls below a defined minimum. Typical learning algorithms are the “Backpropagation of Error” (BackPROP) or derivatives like the “Resilient Backpropagation” (RPROP).
The strength of the interconnections in the calibrated model depends on the influence of the potential factor or a set of factors and their relationships.
3. INTEGRATION OF THE METHOD INTO GIS:
SOFTWARE ADVANGEO®
Originally, ANNs where used for data analysis of medical applications or for solving different mathematical problems. Typical input data have a manageable amount of datasets describing the problem.
In spatial data analysis, the amount of data records which has to be analysed, is often very high. Depending on the data resolution this could easily be more than a million records. Until now, the effort to prepare the amount of geo-data for using the ANN approach and the absence of interfaces to existing class libraries and tools, causes the rarely use of ANN for the modelling of geo-scientific problems in GIS.
The software advangeo® was implemented using the GIS software ArcGIS from ESRI®. Advangeo® enables the GIS user processing their spatial data within their common GIS environment.
The modelling core of the software is based on an artificial neural network which uses the Multilayer perceptron (MLP). The MLP is trained in a supervised learning process. Training data (known event locations) are used to derive the relationships between the depending variable (the event/ phenomena) and the controlling parameters.
The depending variable can be nominal for a qualitative modelling. But it can also have a higher scale level for a quantitative modelling. In this case the training data set must be appropriately scaled.
3.1 Graphical User Interfaces and Functionality
For its data processing, advangeo uses the functionality of ESRI ArcGIS. Since the modelling approach is a raster analysis, the ”Spatial Analyst“ extension is required.
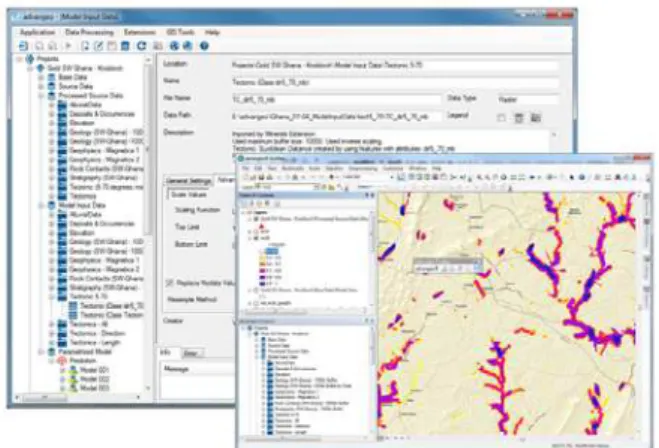
Main user components of the application are the standalone Data- and Model Explorer and a GIS-Extension (see Figure 2).
Figure 2. Software advangeo® graphical user interfaces: Data and Modell Explorer (left) and GIS Extension (right)
The Data- and Model Explorer allow the creation and administration of projects including the organization and processing of geo-data and the parameterization and calculation of the models. In the graphical user interface, the project and its data are organized in a Windows like tree structure. The GIS The International Archives of the Photogrammetry, Remote Sensing and Spatial Information Sciences, Volume XL-2, 2014
extension is communicating with the Data- and Model Explorer and supports the data exchange between the user interfaces. It consists of a toolbar and a project tree view.
The project, the logged working steps and all models including the whole metadata are store in a database. The storage of the database itself as well as of the physical data is carried out in a closed file structure: this allows the simple copy and paste of projects from user to user or to another storage medium. An overview of the architecture of advangeo® is shown in Figure 3.
Figure 3. Architecture of advangeo®
3.2 Workflow
Advangeo® consists of different modules, offering an integrated workflow that guides the user through the different work steps of data pre-processing and model creation:
Module “Base Data”: Definition of model base parameters i.e. origin, grid cell size, extent, outline and spatial reference of the model area (Base raster and Project Area) and the creation of different areas for training, testing and application,
Module “Source Data”: Organization of Source Data, i.e. any kind of input data in different raster and vector format, such as digital elevation models, geophysical raw data, sample points, geological maps or land use maps,
Module “Processed Source Data”: Creation of derived data sets as raster or vector data, e.g. interpreting spatial relationships, derivatives; such as distance maps, slope direction maps, lithological maps, interpolated geochemical data maps,
Module “Model Input Data”: Generation of consistent raster data based on existing Processed Source Data for its use in models with different user options, e.g. options for scaling, creation of binary rasters from nominal data or fill NoData values automatically with a defined value,
Module “Parameterized Models”: Parameterizing and training of ANN-models and application of trained models.
The modelling and result presentation is based on raster data (ESRI Grid). For the import to “Source Data” and “Processed Source Data” raster and vector data can be used.
The data processing of the Source Data to create the Processed Source Data can be executed manually using ArcGIS. As an alternative the advangeo® extensions for “Minerals” and “Erosion” are developed for the automation of the processing steps from Source data to ready to use Model Input Data.
3.3 Software extensions
Considering the modelling of the data is carried out as a raster analysis, the neighbourhood of a pixel is not interpreted. Therefore, all important information like the distance of a point to a fault or a contaminated site must be derivate from source data information. This data processing requires an extensive knowledge of data manipulation techniques as well as a lot of time. To support the user in complex and often repeated steps of data preparation, two extensions for an automated data processing were implemented:
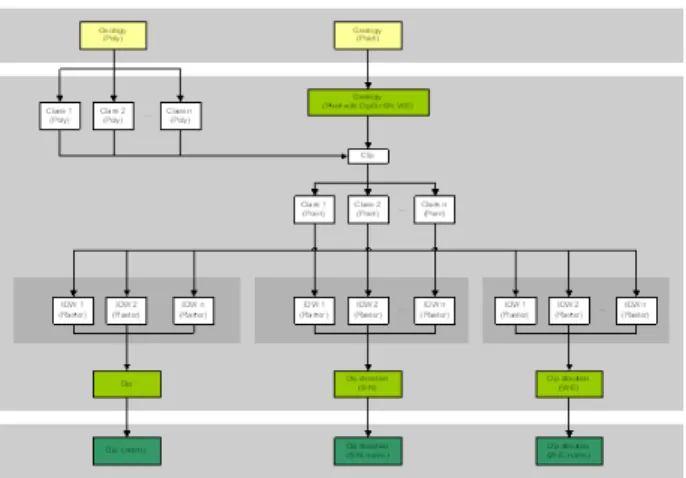
Erosion Extension: processing of digital elevation models, soil maps and land use maps and the combination of geological data with information of the elevation model (see Figure 4) to prepare data for the modelling of erosion based processes.
Minerals Extension: automated processing of geological maps, classification of linear elements and rock contact zones, processing of geophysical data and geochemical data, interpolation of point data to prepare data for the modelling of mineral occurrences based processes.
Both extensions consist of graphical user interfaces for data selection, execution of processing operations. As result ready to use model input data are created.
Figure 4. Example of a workflow for processing geological data in the Erosion extension
4. CASE STUDIES
Advangeo® has shown its strengths in a wide variety of case studies, such as:
Prediction of various erosion processes, i.e. landsli-des, erosion gullies, soil creeping (Noack et al., 2012, Barth & Berger, 2010, Knobloch & Zeidler, 2010), Prediction of forest vulnerability by forest pests
(Noack & Otto, 2010),
Prediction of the spatial distribution of manganese nodules in the pacific ocean (Knobloch & Barth, 2010),
Prediction of coal fires in China (Drebenstedt, Knobloch et al., 2010),
Prediction of bird species distribution and frequency (Römer, Schmidt, 2012),
Regionalization of soil parameters in Europe (Scharpf, 2012),
Prediction of mineral potential areas (e.g. Barth et al., 2009), (Barth et al., 2010), (Arkhipova, 2013) and (Nuspl, 2012) and
Prediction of the ground liquefaction risk potential of lignite mining waste dumps (Kallmeier et al., 2014)
Below, three examples are described.
4.1 Case Study 1: Ground liquefaction risk potential of lignite mining waste piles
In the Lusatian Region, Germany, in former lignite mining areas rising groundwater is causing substantial deformations of the surface in waste rock pile areas. These deformations are caused by ground liquefaction processes and endanger the safety and the post mining use of the respective areas. Advangeo® was used to create large scale liquefaction hazard potential maps in a test area of the open cast pit “Schlabendorf-Süd”.
The following input data were available for modelling:
Areas of ground instability (training data) The recent elevation model
Geometrical data of the former pit Groundwater table data
Lithological composition of the lignite overburden (exploration data) & Mining technology data
For modelling purposes a set of 35 derived independent parameters have been created, such as:
Thickness of the dump(s)
Thickness of the groundwater saturated dump Thickness of unsaturated dump
Lithological composition of the dump
Hydrogeological data: gradients, flow direction
A principle modelling scheme is shown in Figure 5.
Figure 5. Scheme of model configuration
Considering the permanent changes of the groundwater table, the analysis of the process was focussed to the year of 2010. The model resolution was set for 25 m. By an extensive sensitivity analysis (132 scenarios) the influence of 35 single parameters on the hazard potential were investigated.
To evaluate the influence of a single parameter or a combination of parameters, histograms of the model results can be used: 1.) for the entire area and 2.) for areas with known events. Significant parameters show a clear shift of the maximum to the right side of the histogram for the known events.
As an example for a sensitive parameter the histograms of “thickness of saturated dump” are shown in Figure 6.
Figure 6. Histograms of the parameter “Thickness of saturated dump“, left: for the entire model area, right: for areas with known events
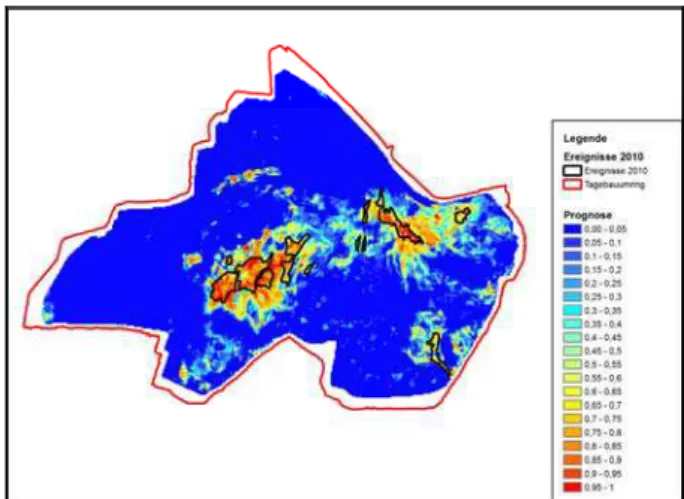
The best fitted model was based on a combination of 15 input parameters: the elevation model and derived data, thickness and composition of the dump and groundwater characteristics. The result of this model is displayed in Figure 7. Observed events are outlined in black.
Figure 7. Prediction map based on the known events 2010
For model validation, 50 % of the event related data have been removed from the training scenario. The modelling results of this reduced data set were almost identical with the initial results.
Finally, the artificial neural network trained with 2010 data was successfully applied to data sets of the years 2008 and 2011. The respective results show a good match with the events known from these years. The model can be used to predict hazard potential areas in the forthcoming years.
4.2 Case Study 2: Gold Potential Mapping in Ghana
The identification of exploration targets is one of the most ambitious tasks in geology. Correct mineral predictive maps safe considerable exploration funds, help to mitigate land use conflicts, reduce environmental damages and can be used for investment attraction
The study area of about 60,000 km² is located in Southwest Ghana, West Africa. The model area is famous for greenstone belt related hard rock gold deposits and the derived placers.
The following data sets were available for modelling: a mineral occurrence database
the geological map 1:1.000.000 airborne magnetic data the elevation model.
According to the different genetic types of gold deposits dif-ferent input data layers have been created.
For hard rock gold potential mapping the following data sets have been used:
locations of hard rock stockwork type gold occur-rences (as training data)
lithological maps
maps indicating the rock age
maps of shear zone features and other tectonic structures (see Figure 8)
airborne magnetic data and its derivatives
Figure 8. Pre-processing of tectonic data
Modelling results have been used for the evaluation of single prospects (see Figure 9).
Figure 9. Evaluation of prospects with regard to their potential High potential prospects can clearly be separated from
prospects with less potential.
The model can easily be upgraded with new exploration data.
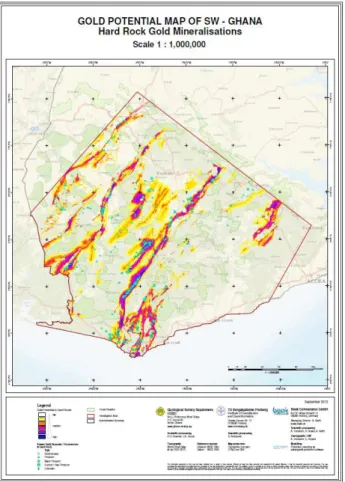
As a result of the extensive data analysis and modelling, a gold potential map in a scale of 1: 1,000,000 (see Figure 10) was created. This map provides an excellent base for exploration targeting, investment promotion and small scale mining guidance.
Figure 10. Hard Rock Gold Potential Map 1.1,000,000 The International Archives of the Photogrammetry, Remote Sensing and Spatial Information Sciences, Volume XL-2, 2014
For placer gold potential mapping the following data sets have been used:
locations of placer gold occurrences (as training data) high potential hard rock gold areas (results from the
first application scenario, Figure 10), indicating the sources of placers
drainage network data (derived from the elevation model)
size and location of catchment areas
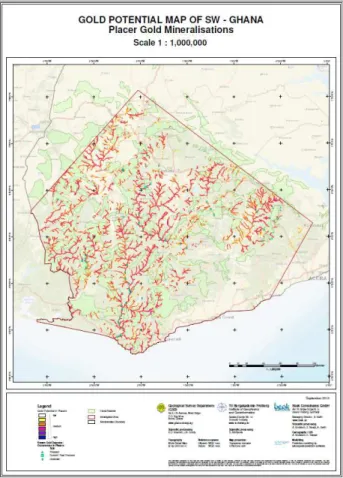
The modelling results are shown in the “Placer Gold Potential Map” in a scale 1: 1,000,000 (see Figure 11).
Figure 11. Placer Gold Potential Map 1.1,000,000
4.3 Case Study 3: Forest Pest Vulnerability Analysis
A mass reproduction of the European Spruce Bark Beetle (Ips typographus L.) can lead to severe forest dieback. The know-ledge of the respective controlling factors is very important for a successful forest management and for the planning of mitigation measures. Obviously, older and homogeneous forest stands of the Norway Spruce (Picea abies) are mainly affected by this pest. Beside the fact that the exact controlling factors and their relationship are not known, one can safely assume that significant influencing factors for the mass dispersion of this bark beetle are site and soil parameters as well as forest stand properties and climate parameters.
The problem was analysed in two different projects: the first study site was located in the “Tharandter Wald” in Saxony, Germany. A detailed description is available in Noack et al.,
2012. The second study site was located within the National Park “Sächsische Schweiz” in Saxony, Germany.
The following data were available for modelling:
known observation points of Ips Typographus L. infections for the years 1996-2011 (see Figure 12), as training data
forestry data, such as species, height and age of trees the elevation model
the soil map the geological map groundwater data
For training purposes, the infection data were assigned to 5 different epochs with different characteristic, e.g. low or high pest infestation or low or high pre-infestation. From the extensive knowledge of training data additional information could be derived: quantity and distance to pre-infections and to executed protection measures.
Figure 12. Overview of number of infections per year
During the pre-processing different terrain information was derived, e.g. slope, aspect, location on a slope, the topographic wetness index, and the hill shade with defined angle of solar incidence as a parameter for the amount of solar radiation and temperature. Soil data were processed to generate maps differentiating between fine grained and coarse grained soils and wetness classes. For the forest stand the parameters height, density of stand and general location with regard to the forest outskirt have been considered.
A statistical evaluation of the potential factors was conducted prior to the processing of each of the epochs. Potentially influential factors were identified and prepared for their usage as model input data.
The modelling was executed for each epoch separately. The models were systematically set up with various input layers. To validate the results, the training results of one epoch were systematically compared with the known infestation areas of the epoch and with the four other epochs to determine if the model is transferable.
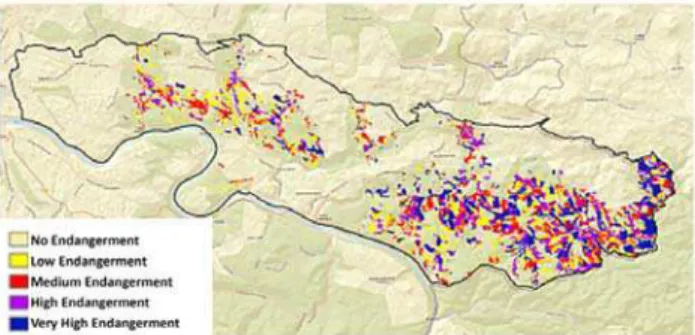
Figure 13. Prediction map for endangerment of infection by Ips Typographus L. in the National Park “Sächsische Schweiz” in Saxony, Germany
Finally, two maps were created by clipping identical models (with identical model input data and net parameters) from different epochs: one for a model considering only the forest stand (percentage of spruce and height, see Figure 13) and one model considering the controlling factors forest stand and location parameters (topographic wetness index, hillshade and density of stand).
The study has proven the general applicability of the approach to analyse and predict forest infections by Ips typographus L. A difficulty was to find an appropriate model which can be used for different epoch characteristics. In future studies more parameters such as information about pre-infection, executed mitigation measures and possibly climate information should be considered. In principle, both qualitative and quantitative analysis of infections was possible with ANN and methods of supervised learning.
5. CONCLUSIONS
Artificial neural networks are an efficient instrument to model the relationships between a depending variable and the influencing factors of any kind of geo-related problem.
The approach is a consequently data driven, and by this avoids the biased influence of a scientist. The knowledge of the expert is essential for the selection and preparation of input data and for the validation of the results.
Advangeo® provides the software environment for effective data pre-processing, step-by-step model generation, and result visualisation. It is a tool to build up structured and comprehensible models within the widely used ESRI GIS environment. The software will be further developed to improve its usability and functionality. Currently, two other approaches are in the implementation process: Weights of Evidence as an alternative data driven method and Fuzzy Logic for knowledge based data modelling.
ACKNOWLEDGEMENTS
The authors sincerely thank the Lausitzer und Mitteldeutsche Bergbau-Verwaltungsgesellschaft mbH (LMBV), the Geolo-gical Survey of Ghana, the Technical University Bergakademie Freiberg, the Staatsbetrieb Sachsenforst (State Agency for Forestry of Saxony/Germany) for their excellent support and the authorization to present proprietary project data and figures
in this article. The research project was supported by the German Federal Ministry of Economy and Technology (project identification numbers: IW072061, EP09260, EP101247, EP121295).
REFERENCES
Arkhipova, S., 2013: Prognose von Goldexplorationszielen in Südwest-Ghana mittels künstlicher neuronaler Netze und logistischer Regression. Unpublished master thesis. TU Bergakademie Freiberg
Backhaus, K., Erichson, B., Plinke, W., & Weiber, R., 2003. Multivariate Analysemethoden – eine anwendungsorientierte Einführung. Berlin: Springer-Verlag.
Barth, A., Berger, A., 2010: Probability of Erosion Gully Formation - Limpopo Region. Map created in project AEGOS – Phase 1 (African European Georesources Observation System). Beak Consultants GmbH, Freiberg.
Barth, A. , Noack, S., Legler, C., Seib, N., Rexhaj, A., 2010: Rohstoffprognosekarten mit Verfahren der künstlichen Intelligenz – Fortschrittliche Identifizierung von Rohstoffpotentialen in Entwicklungs- und Schwellenländern. Glück Auf 146, (2010), Nr. 4
Drebenstedt, C., Knobloch, A., Gusat, O., Fischer, C., Barth, A., 2010: Risk Assessment of Coal Fires in the P.R. China Using Artificial Neural Networks and GIS. In: Latest Developments on Coal Fire Research. Bridging the Science, Economics, and Politics of a Global Disaster. Proceedings of “ICCFR2 – Second International Conference on Coal Fire Research“. 19 – 21 May 2010, Berlin, Germany.
Kallmeier, E., Roscher, M., Böhnke, R., Barth, A., Drebenstedt, C.: Modellierung und Bewertung der Stabilität von Tagebaukippen mit künstlichen neuronalen Netzen. 15. Geokinematischer Tag, TU Bergakademie Freiberg. 2014.
Knobloch, A., Gusat, O., 2010: Development of a Coal Fire Prognosis Map for China Using Artificial Neural Networks and GIS. In: IUR "Scientific Reports on Resource Issues" Volume 3, 2010.
Knobloch, A., Barth, A., 2010: Analyse der räumlichen Verteilung von Manganknollen mit Verfahren der künstlichen Intelligenz. Unpublished. Beak Consultants GmbH im Auftrag der Bundesanstalt für Geowissenschaften und Rohstoffe. Freiberg, 12.11.2010.
Knobloch, A., Zeidler, M.: Risikoanalyse des Hochwasser-rückhaltebeckens Glashütte. Unpublished. Beak Consultants GmbH im Auftrag der Landestalsperrenverwaltung Sachsen. 2010.
Kriesel, D., 2009. A Brief Introduction to Neural Networks. Retrieved December 30, 2009, from http://www.dkriesel.com.
Noack, S., & Otto, L.-F., 2010. Erste Ergebnisse einer Prognose der Befallswahrscheinlichkeit von Waldbeständen durch den Buchdrucker (Ips typographus L.) mittels eines künstlichen neuronalen Netzes. Poster presented at Forstwissenschaften: Grundlage nachhaltiger Waldbewirtschaftung, Göttingen, Germany. Retrieved October 24, 2010, from http://www.beak.de/advangeo/advangeo_prediction/news/fowi_ 2010
Noack, S., Barth, A., Irkhin, A., Bennewitz, E., Schmidt, F., 2012: Spatial Modeling of Natural Phenomena and Events with Artificial Neural Networks and GIS. International Journal of Applied Geospatial Research (IJAGR), Volume 3 (1), p. 1-20.
Nuspl, A., 2012: The application of artificial intelligence for metallic mineral exploration targeting of Sn and W skarns in the Erzgebirge/Vogtland area. Unpublished master thesis. TU Bergakademie Freiberg
PETERS, R., SCHMITZ, G., CULLMANN, J. 2006. Flood routing modelling with Artificial Neural Networks. Advances in Geosciences, 9/2006, 131-136.
Römer, T., 2012: GIS-gestützte Analyse der Beziehungen zwischen Biotop- und Land-nutzungstypen sowie Brutvorkommen ausgewählter Vogelarten. Unpublished master thesis. Hochschule für Technik und Wirtschaft (University of Applied Sciences for Engineering and Economy) Dresden/Germany.