REGULAR ARTICLE
EVALUATION OF NEW VARIETIES OF SUMMER WHEAT TRITICUM AESTIVUM L. CONSIDERING SELECTED PARAMETRES OF TECHNOLOGICAL
QUALITY
Tatiana Bojňanská1*, Marián Tokár1, Karolina Mocko1, Hana Balková1, Helena
Frančáková1, Eva Ivanišová1, Tibor Roháčik2
Address: doc. Ing. Tatiana Bojňanská, CSc.
1Department of Storing and Processing Plant Products, Faculty of Biotechnology and Food
Science, Slovak University in Nitra, Tr. A. Hlinku 2, 949 76 Nitra, Slovak Republic:
2Selekt VSU, a.s. Bučany, 919 28 Bučany č. 591, Slovak Republic.
*Corresponding author: [email protected]
ABSTRACT
quality (experimental milling) and baking quality (Farinograph assessment) were BU-149 and BU-150 identified as the best new varieties.
Keywords: summer wheat, flour yield, farinograph
INTRODUCTION
Variability of wheat flours properties depends on several factors, including genetic predispositions, agro-climatic and growing conditions, harvest technology, storing, and subsequent milling (Muchová, 2001; Mainitz et al., 2002; Příhoda et al., 2003).
Technological quality of flour represents the sum of different wheat flour properties which determine the dough characteristics, production costs as well as the products quality
(Cauvain, 2003). Currently, the rheological methods are the best methods available to assess
the quality properties. These methods characterise the flour on a whole scale, can also characterise dough, and indirectly provide information about a quality level of different fractions (Peressini et al., 2008).
Laboratory rheological equipment is used as a highly credible method in assessment of the processing value of flour (Horvat, 2008). Ability to form fermenting gas, retention and availability of flour, content and quality of gluten are considered the most important flour properties. Rheological methods objectively describe the characteristics of examined materials through measurable parameters based on physical principles. These values have significant coherence with the qualitative parameters of flour components. Based on results of rheological measurements, it is possible to technologically characterise the properties of different flour components as well as the property of flour as such. Rheological equipment might be divided into devices that measure rheological properties of flour or dough and the ones that simulate certain technological steps of processing. Both groups are widely established: the results of their measurements complement each other and give more precise view on the quality of the raw material and dough properties (Kadlec, 2000).
gluten have higher ability to absorb water (higher extraction) with prolonged swelling of the individual components. Dough is more stable, easier to process, does not stick and is easy to shape (Robertson and Cao, 2001).
Weak flours have lower ability to absorb water (lower dough extraction) and are less stable. Common pastry products from weak flour are usually not enough fermented, with low volume and unsuitable breadcrumb structure (Baik and Lee, 2003). Therefore, they are better suited for cake/biscuits production structure where, during kneading, the forming of a compact gluten network is not needed (Fustier et al., 2009).
The aim of this work was to analyse new varieties of summer wheat cultivated in a Research institute of breeding in Bučany, in particular in terms of milling quality parameters identified by the direct method - experimental milling, and considering the rheological properties of flours obtained in this way.
MATERIAL AND METHODS
Within the research framework following biological material: summer wheat (Triticum
aestivum L.) – selected new varieties: 117, 130, 138, 142, 144, 149,
Bu-150, Bu-159, Bu-160 (originated in Selekt research and breeding institute a.s. Bučany) as well as a check variety Ilona cultivated between 2008 - 2011 (together 10 new varieties) has been analysed. With the use of laboratory mill Quadrumat Senior fy Brabender Oh G, Duisburg, Germany, the experimental milling from 4 kg in all samples has been provided to determine yield of milling fractions. Obtained grist was separated into three milling fractions by the means of horizontal sifter, which is a system of several screens of different mesh sizes. Bran (bigger than 530 µm) was separated from grist immediately after rough-grinding and was identified as the fourth milling fraction. Flour with components smaller than 155 µm obtained in this milling phase was identified as first milling fraction. The third fraction with particles of grist bigger than 150 µm was directed to the cluster mill, where it was re-milled again by the means of two pairs of smooth rolls. Obtained grist was separated by particle size on horizontal sifter. Overall, during the milling process of wheat following four milling fractions were formed: flour I (<155 µm), flour II (<195 µm), miller´s bran (195 – 265 µm) and bran´s scrap (> 530 µm).
assessed: water absorption (%), dough development time (min), degree of softening (FU), dough stability time (min), farinograph quality number.
RESULTS AND DISCUSSION
Flour yield of milling fractions
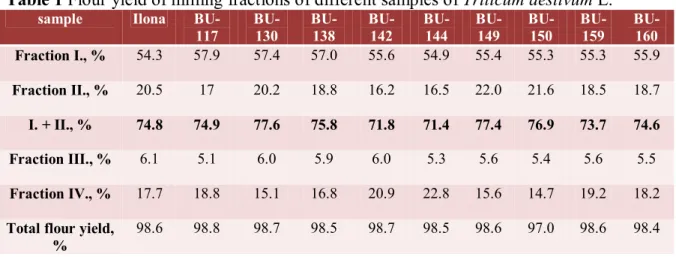
The samples of new varieties of summer wheat were processed to different milling fractions by grinding on laboratory mill. The results of analyses (Table 1) were evaluated in order to determine flour yield of milling fractions, in particular, the portion of I. fraction (flour) and a total extraction of flour (I. + II. fractions).
Compared to a check variety Ilona the extraction of first fraction in all new varieties was higher, what can be regarded as a positive trend of modern breeding process.
Total extraction of flours (sum of fractions I. and II.), which can be considered the most important indicator in the milling experiment was significantly higher in new varieties BU-130, BU-149 and BU-150. These new varieties seem to be the most prospective from the milling quality point of view. On the other hand, new varieties BU-142 and BU-144 showed lower total extraction of flours then the check variety Ilona (by 4 %, to 4,5 %), used as a standard value. Total flour yield did not vary significantly among the evaluated samples and reached nearly 98 – 99 %. Descending order of samples according to the total extraction of flours was following: BU-130 > BU-149 > BU-150 > BU-138 > BU-117 > Ilona > BU-160 > BU-159 > BU-142 > BU-144.
Table 1 Flour yield of milling fractions of different samples of Triticum aestivum L.
sample Ilona
BU-117 BU-130 BU-138 BU-142 BU-144 BU-149 BU-150 BU-159 BU-160
Fraction I., % 54.3 57.9 57.4 57.0 55.6 54.9 55.4 55.3 55.3 55.9
Fraction II., % 20.5 17 20.2 18.8 16.2 16.5 22.0 21.6 18.5 18.7
I. + II., % 74.8 74.9 77.6 75.8 71.8 71.4 77.4 76.9 73.7 74.6
Fraction III., % 6.1 5.1 6.0 5.9 6.0 5.3 5.6 5.4 5.6 5.5
Fraction IV., % 17.7 18.8 15.1 16.8 20.9 22.8 15.6 14.7 19.2 18.2
Total flour yield,
Milling is a commercial activity that requires rational and economic thinking and behaviour. The main goal of the milling process is to achieve the most complete separation possible of the endosperm from the outer parts and to reach the highest possible extraction of flour with the low ash content. Rough flours and semolina have higher yield thanks to hard, falling apart in crystals endosperm, which separates well from outer layers (Bettge and
Morris, 2000; Muchová and Frančáková, 2001; Muchová, 2001). It is essential to assess
the milling quality of new varieties which are under the preparation for approval.
Results of farinograph measurements
The process of dough formation from the initial water addition to flour up to forming of compact dough with desired qualities (consistency, resistance to deformation, stability) goes through different phases during which fluidity, firmness and elasticity gradually change. The changes are reflected in smoothness and homogeneity of dough (Příhoda et al., 2003). Interactions between proteins, starch and non-starch polysaccharides as well as their portions in flour influenced to certain extent by the variety, play an important role in determining the baking quality of flour and rheological properties of dough (Larsson et al., 2005; Bollaín et al., 2006). In the process of kneading water initiates hydration and aggregation of proteins forming gluten, which leads to partial swelling of starch grains. Gluten creates solid, cohesive, visco-elastic net responsible for dough development (Shewry et al., 2003).
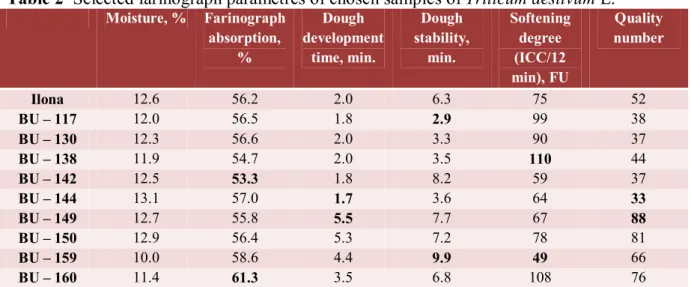
Farinograph properties of wheat flour are heavily influenced by the protein content and quality (Skendi et al., 2009). Farinograph records changes in consistency of dough in time caused by mechanical stress. These changes are recorded in a form of graphic time record of consistency characteristics. The rheological analyses were realized on samples from the flour (first fraction) of new varieties and variety Ilona (Table 2).
Farinograph absorption expresses the amount of water in % needed to form from 100g of flour the standard dough, i.e. of desirable consistency. Considering different moisture of samples, farinograph absorption was evaluated after correction to 14 % of moisture and varied from 53.3 % to 61.3 %. In terms of success of new varieties in approval process, farinograph absorption represents a very important criterion and the high values are expected which predicts high absorption ability of wheat proteins. (Abang Zaidel et al., 2008;
Table 2 Selected farinograph parametres of chosen samples of Triticum aestivum L.
Moisture, % Farinograph absorption, % Dough development time, min. Dough stability, min. Softening degree (ICC/12 min), FU Quality number
Ilona 12.6 56.2 2.0 6.3 75 52
BU – 117 12.0 56.5 1.8 2.9 99 38
BU – 130 12.3 56.6 2.0 3.3 90 37
BU – 138 11.9 54.7 2.0 3.5 110 44
BU – 142 12.5 53.3 1.8 8.2 59 37
BU – 144 13.1 57.0 1.7 3.6 64 33
BU – 149 12.7 55.8 5.5 7.7 67 88
BU – 150 12.9 56.4 5.3 7.2 78 81
BU – 159 10.0 58.6 4.4 9.9 49 66
BU – 160 11.4 61.3 3.5 6.8 108 76
The highest farinograph absorption occurred in a new variety BU–160 (61.3 %) which was considerably higher than in a check variety Ilona (56.2 %). Based on results of farinograph absorption majority of samples were determined as flours of middle strong quality with exception of new varieties BU–160, BU-159 and BU–144, which are strong flours.
Descending order of samples according to absorption was following: BU–160 > BU-159 > BU–144 > BU-130 > BU–117 > BU–150 > Ilona > BU–149 > BU–138 > BU–142. The difference in absorption between BU-160 and BU-142 was nearly 12.6 %, which is a significant finding taking into consideration higher dough extraction, increased volume, and costs savings (kneading mode, better mechanic characteristics of dough).
Dough development time is time in minutes measured beginning the moment water is
added into flour until the curve shows first drop of the maximal consistency. Dough development time depends on amount and quality of gluten, flour granules, degree of milling
(Almeida et al., 2010; Voicu et al., 2012). It is determined in particular by the process of
gluten hydration. Water is quickly absorbed by flour, physic-chemical changes of flour proteins occur, while the dough structure is strengthened. Dough development time varied in experimental samples from 1.7 minute to 5.5 minutes. All samples except BU–149, BU–150, and BU-159 had the dough development time around 2 – 3 minutes so evaluated as flours of middle quality. Three afore-mentioned new varieties had the dough development time from 4.4 to 5.5 minutes and were evaluated as flours of strong quality.
BU–142 > 144. The difference in the dough development time between 149 and BU-144 was 3.8 minutes.
Dough stability indicates the time interval during which dough maintains maximal
consistency (from the moment when upper side of curve crosses the line at 500 FU while rising until the curve crosses the same line again while falling). Dough stability characterises dough resistance to mechanic stress but also to a lesser extent to enzyme influence
(Mirsaeedghazi et al., 2008; Figueroa et al., 2012).
Dough stability in evaluated samples varied between 2.9 minutes (low, unsuitable stability for baking purposes) and 9.9 minutes. The highest stability was found in a new variety BU–159 and the lowest in BU-117. The difference was 7 minutes which is considered a significant difference. New varieties with high dough stability are considered of good quality from the point of view of further baking use.
Descending order of samples according to dough stability was following: BU–159 > BU-142 > BU–149 > BU-150 > BU-160 > Ilona > BU–144 > BU–138 > BU-130 > BU-117.
Degree of dough softening expresses the difference in consistency values between
maximal consistency and consistency after 10 minutes from beginning of measurement.
Degree of dough softening according ICC expresses the difference of consistency values after
reaching the maximum (mean value of curve width is measured) and after 12 minutes of reaching the maximum (drop of dough consistency). The values are given in farinograph units (FU). Dough softening is connected with its destruction, shortening of gluten tissues, dissolving of swollen gluten parts which cause lowering of resistance to kneading (Abang
Zaidel et al., 2008; Karaoglu, 2011). Curve fall characterises the dough resistance to further
mechanic stress. Method according to ICC is considered more suitable to evaluate the softening degree, i.e. after 12 minutes of reaching the maximum, as this method takes into consideration real dough softening regardless the influence of different dough development times with strong and weak flours. Softening degree (ICC/12 min) reached in experimental samples ranged between 49 FU and 110 FU.
Ascending order of samples according to softening degree of dough was following: BU–159 > BU-142 > BU-144 > BU-149 > Ilona > BU-150 (evaluated as flours of middle to strong quality) > BU–130 > BU-117 > BU-160 > BU-138 (evaluated as flours of weak quality).
Quality number is a number expressed as the length on a timeline beginning at the
(development, stability as well as degree of dough softening. In general, the higher the quality number, the stronger is the flour. In examined samples the quality number varied from 33 to 88.
Samples are put in order according to quality number from the strongest to the weakest taking into consideration their baking quality as follows: 149 > 150 > 160 > BU-159 > Ilona > BU-138 >BU-117 >BU-142 > BU-130 > BU-144.
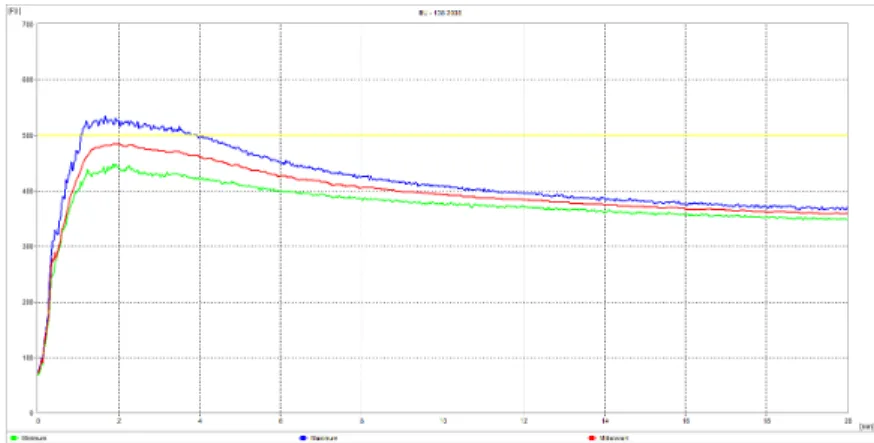
Farinograms of the best and the worst assessed new variety are shown in figure 1 and 2.
Figure 1 Sample BU–149 Dough flexibility was high in the first phases of kneading, followed by significant loss of flexibility after loss of stability. Absorption and softening degree was of middle strong baking quality while dough development and dough stability
adequate to strong baking flours. Quality number is highest among all evaluated samples
Figure 2 Sample BU–138Absorption, development and dough stability was of middle baking quality, softening degree and quality number of weak baking quality. Dough flexibility was well developed in the first phases of kneading, after eight minutes, however, fell considerably
CONCLUSION
Results of the evaluation of milling quality of new varieties 117, 130, BU-138, BU-142, BU-144, BU-149, BU-150, BU-159, BU-160 and variety Ilona (experimental milling) and of baking quality expressed by farinograph record, confirmed the positive trend of modern breeding process to prepare the genetic material of Slovak descent with excellent technological properties and adapted to the climatic conditions of Slovakia.
Interestingly, it was found that, compared to the check variety Ilona the extraction of the first fraction flour was at all new varieties higher. Total flour extraction (sum of fractions I and II.), which can be considered as the most important indicator of milling experiment was significantly higher in new varieties BU-130, BU-149 and BU-150. These new varieties were regarded as the most promising in terms of milling quality. By means of farinograph time changes in dough consistency due to mechanical stress were observed under conditions of the method: farinograph absorption, dough development time, dough stability, degree of dough softening, and quality number. Based on the results of the farinograph absorption, most of the samples can be characterized as of middle quality, except for new varieties BU-160, BU-159 and BU-144 which are characterized as strong flours. Dough develpoment time ranged in the samples from 1.7 minutes to 5.5 minutes. The highest dough stability was found in new varieties BU-159, BU-142 and BU-149, and these are considered the best in terms of their subsequent bakery use. Based on the degree of dough softening the samples BU-159, BU-142, BU-144, BU-149, Ilona and BU-150 were rated as flours of middle to strong quality. Based on the comprehensive assessment of the results of all evaluated parameters (milling and baking) the following descending order has been compiled: BU-149 > BU-150 > = BU-130 = BU-138 = BU-160 > Ilona > BU-117 = BU-159 > BU -142 > BU-144. New varieties BU-149 and BU-150 were rated as significantly the best while a new variety BU-144 was assessed as the worst.
REFERENCES
ABANG ZAIDEL, D. N. - CHIN, N. L. - ABDUL RAHMAN, R. - KARIM, R. 2008. Rheological characterisation of gluten from extensibility measurement. In Journal of
ALMEIDA, E. L. - CHANG,Y. K. – STEEL, C. J. 2010. Effect of Adding Different Dietary Fiber Sources on Farinographic Parameters of Wheat Flour. In Cereal Chemistry, vol. 87, no. 6, p. 566-573.
BAIK, B. K. – LEE, M. R. 2003. Effect of starch amylase content of wheat on textural properties of white salted noodles. In Cereal Chemistry, vol. 80, p. 304-309.
BETTGE, A. D. – MORRIS, C. F. 2000. Relationships among grain hardness, pentosan fractions and end-use quality of wheat. In Cereal Chemistry, vol. 77, no. 2, p. 241-247.
BOLLAÍN, C. – ANGIOLONI, A. – COLLAR, C. 2006. Relationships between dough and bread viscoelastic properties in enzyme supplemented wheat samples. In Journal of Food
Engineering, vol. 77, no. 3, p. 665–671.
CAUVAIN, S. P. – YOUNG, L. S. 2009. The ICC handbook of cereals, flour, dough and product testing: method and applications. USA: Destech Publication, 2009. 504 p. ISBN 978-1-932078-99-2.
CAUVAIN, S. P. 2003. Breadmaking. Cambridge: Woodhead Publishing Limited, 2003. 589 p. ISBN 1-85573-553-9.
ĐAKOVIĆ, L. J. 1997. Pšenično brašno. 4 izdanje. Novi Sad: Zavod za tehnologiju žita i brašna, Tehnološki Fakultet, 1997. 164 p.
FIGUEROA, J. D. C. - MANUEL, C. I. - HERNANDEZ-ESTRADA, Z. J. - RAMIREZ-WONG, B. 2012. Stress Relaxation of Wheat Kernels and Their Relationship with Milling, Rheological, and Breadmaking Quality of Wheat. In Cereal Chemistry, vol. 89, issue 4, p. 211-216.
FUSTIER, P. – CASTAIGNE, F. – TURGEON, S.L. – BILIADERIS, C. G. 2009. Impact of commercial so wheat fl our stream on dough rheology and quality attributes of cookies. In
Journal of Food En gonee ring, vol. 90, no. 2, p. 228–237.
HORVAT, D. – MAGDIC, D. – ŠIMIC, G. – DVOJKOVIC, K. – DREZNER, G. 2008. The relation between dough rheology and bread crumb properties in winter wheat. In Agriculturae
Conspectus Scientifi cus, vol. 73, no. 1, p. 9–12.
KADLEC, P. 2000. Technologie sacharidů. Praha: VŠČHT, 2000, 138 s. ISBN 80-7080-400-9.
KTENIOUDAKI, A. – BUTLER, F. – GALLAGHER, E. 2010. The effect of different mixing processes on dough extensional rheology and baked attributes. In Journal of the Science of
Food and Agriculture, vol. 90, is. 12, p. 2098-2104.
LARSSON, H. – KUKTAITE, R. – MARTTILA, S. – JOHANSSON, E. 2005. Effect of mixing time on gluten recovered by ultracentrifugation studied by Microscopy and rheological Measurements, In Cereal chemistry, vol. 82, no. 4, p. 375 – 384.
MAINITZ, R. et al. 2002. Technológia pekárskej výroby. 2.vydanie, Cech pekárov a cukrárov RZS, Bratislava: PROMP, 2002. 239 p. ISBN 80-968366-4-1.
MIRSAEEDGHAZI, H. - EMAM-DJOMEH, Z. - MOHAMMAD ALI MOUSAVI, S. 2008. Rheometric measurement of dough rheological characteristics and factors affecting it. In
International Journal of Agriculture & Biology, vol. 10, no. 1, p. 112-119.
MUCHOVÁ, Z. 2001. Faktory ovplyvňujúce technologickú kvalitu pšenice a jej potravinárske využitie. Nitra: SPU, 2001. 112 s. ISBN 80-7137-923-9.
MUCHOVÁ, Z. – FRANČÁKOVÁ, H. 2001. Hodnotenie a využitie rastlinných produktov. Tretie nezmenené vydanie. Nitra: VES SPU, 2001, 168 s. ISBN 80-7137-887-9.
PERESSINI, D. – PEIGHAMBARDOUST, S. H. – HAMER, R. J. – SENSIDONI, A. – VAN DER GOOT, A. J. 2008. Effect of shear rate on microstructure and rheological properties of sheared wheat doughs. In Journal of Cereal Science, vol. 48, issue 2, p. 426-438.
PŘÍHODA, J. – HUMPOLÍKOVÁ, P. – NOVOTNÁ, D. 2003. Základy pekárenské technologie, Praha: Pekař a cukrář, 2003, 363 p. ISBN 80-902922-1-6.
ROBERTSON, G. H. - CAO, T. K., 2001. Farinograph responses for wheat flour dough fortified with wheat gluten produced by cold-ethanol or water displacement of starch. In
Cereal Chemistry, vol. 78, no. 5, p. 538–542.
SHEWRY, P. R. – HALFORD, N. G. – TATHAM, A. S. – POPINEAU, Y. – LAFIANDRA, D. – BELTON, P. S. 2003. The high molecular weight subunits of wheat glutenin and their role in determining wheat processing properties. In Advances in Food and Nutritional
Research, vol. 45, p. 219 – 301.
SKENDI, A., - BILIADERIS, C. G., - PAPAGEORGIOU, M. - IZYDORCZYK, M. S. 2009. Effects of two barley β-glucan isolates on wheat flour dough and bread properties. In Journal
of Food Engineering, vol. 91, no. 4, p. 594 – 601.