DOI:10.5897/AJAR12.1555
ISSN 1991-637X ©2013 Academic Journals
http://www.academicjournals.org/AJAR
Research
Full Length Research Paper
Study of stillage biodegradation by respirometry in
sandy and clay soils
Nair Conde de Almeida
1*, Richard Clayton Tomasella
2, Silvio Govone
3, Sakae Kinjo
4and
Dejanira Franceschi de Angelis
11Department of Biochemistry and Microbiology
– Institute of Biosciences - São Paulo State University, UNESP, Av. 24A, no 1515, Bela Vista, CEP 13506-900, Rio Claro, São Paulo, Brazil.
2Institute of Geosciences and Exact Sciences- São Paulo State University, UNESP, Brazil.
3Department of Statistics, Applied Mathematics and Computation - Institute of Geosciences and Exact Sciences-São
Paulo State University, UNESP, Brazil. 4Research Center Mokiti Okada (CPMO)- São Paulo
– Brazil. Accepted 21 August, 2013
The stillage, which is a liquid residue from the distillation of the sugarcane ethanolic fermentation, contains organic matter and can be a big source of pollution when it is discarded in the wrong way. Its application as fertilizer has been extended, which is reason to cause concerns regarding the environment. The aim of this work was to evaluate and quantify the biodegradation of stillage in sandy and clay soils, besides verifying the efficiency of the Embiotic Line®inoculum as an accelerator of the biodegradation. Bartha and Pramer respirometric technique was used to determine the production of CO2 during the 50 days of the biodegradation process, and the quantification of the initial and final
microorganisms was also conducted. Results were analyzed using the Friedman statistical test. Clay soils were significantly better on stillage decomposition when compared to sandy soils (p=0.0153). Clay soils presented greater efficiency in stillage biodegradation, with higher field capacity, better water, organic matter and microbial retention. Regarding the use of the embiotic line, the experiment has shown this product does not interfere positively in the stillage biodegradation for both soils, possibly needing adjustments in its composition.
Key words: Biodegradation, stillage, clay soil, sandy soil.
INTRODUCTION
With rising concerns about keeping natural environments in good quality, all effluent or composite able to pollute or contaminate it must be treated efficiently. The alcohol production in Brazil is continuously extended according to the statistical data by UNICA (2009). Between the crops of 1997/1998 and 2007/2008, there was an increase of 62% in production, corresponding to a raise of 190 million tons of sugarcane produced in the country. Studies
shows that each ton sugarcane can produce, on average, 80 L of ethanol (EtOH) and each liter of EtOH produced generates, on average, 13 L of stillage (Nicochelli et al., 2012). In Brazil, 21.1 billion liters of ethanol were produced in 2012 (Renewable Fuels Association, 2012). According to MAPA (2012), there is a positive projection for the next years of 58.8 billion liters in 2019, more than double of what was produced in 2008.
This fact is mainly connected to the increase in the number of vehicles powered by biofuels (vehicles that can be fueled both with ethanol and gasoline), besides the intern and extern consume of anhydrous alcohol. As stillage is the waste of EtOH distilleries, when it is discarded in the environment incorrectly, it can constitute a serious polluting source. However, this sub-product of distilleries can be well used as a fertilizer substitute in agriculture, as a complement for animal feed or in the production of biogas.
According to Lelis Neto (2008), stillage is characterized as an effluent with a high polluting power, about a hundred times more than domestic sewage. This is due to its organic matter richness, low pH, high capacity for corrosion and high indexes of chemical and biochemical oxygen demand (COD and BOD, respectively).The high temperature in the exit distillers compromises the immediate application in the soil. Because of its composition, it is considered harmful to the fauna, flora, freshwater micro-fauna, besides chasing away the marine fauna which breeds in the mangrove.
The stillage organic matter consists of organic acids, potassium ions and, in less quantity calcium and magnesium. Its nutritional value is related to the origin of the fermentation of the raw material (wort). When the wort is from molasses (residue of the sugarcane production), the stillage presents higher concentration of nutrients, which falls when the wort origin is from sugarcane juice (Rossetto, 1987; Kannan and Upreti, 2008; Acharya et al., 2008).
With the intention of lightening the sugarcane polluting load, some bioremediation techniques can be used. Those techniques consist in taking care of the contaminated sites with the use of biological agents, such as:-Intrinsic or natural bioremediation: The micro-organisms used are autochthonous, that is, from the site of interest, without any interference of active remediation technologies.-Biostimulation: When there is the addition of stimulating agents, such as nutrients, oxygen and biosurfactants. -Bioaugmentation: Consists in the inoculation of enriched microbial consortia (Bento et al., 2003).
The bioremediation corresponds to physical, chemical and biological processes for the decontamination of soils and ground water. In order to adopt these processes with safety, it is necessary to develop studies that confirm the pollution reduction in the environment by the limitation of the pollutant displacement aiming the natural attenuation (Chapelle, 1994).
The simulation of field conditions in lab experiments allows to verify the efficiency of the bioremediation process by producing relevant results for enviromental risk management. Respirometry is a technique for assessing the biodegradation process, based on an aerobic system where the quantity of CO2 produced and oxygen consumed shows how easy it is for microorganisms to degrade the organic matter present in the residue and, then, the potential use of the bioremediation process for
the recovery of contaminated areas (Costa et al., 2009). Thus, the major benefit of this process is the evaluation of the pollutant mineralization, that is, how it transforms into carbonic gas, water and biomass. In these tests, it is possible to include the total count of heterotrophic microorganisms or specific substrate degraders and also the degrading rates corresponding to the pollutant disappearance to confirm the degrading process (Kataoka, 2001).
The Respirometric method by Bartha and Pramer was used in this study, applied in works that studied bioremediation in contaminated soils and recommended by NBR 14283 (ABNT, 1999) to determine the biodegradation of residues in soils by the resperometric method. The aim of this work was to evaluate and quantify the stillage biodegradation in sandy and clay soils, besides verifying the efficiency of the inolucum embiotic Line as an accelerator of the biodegradation.
MATERIALS AND METHODS
Soil characterization and sampling
The samples of soils were collected in February 2012 according to the technical rule L.6.245 from Cetesb (1984), in the geographic coordinates: (23 k 240122.10m E 7524445,61m S) and (23 K 238189,08m E 7520899,96m S) localized in the municipality of Rio Claro, in the State of São Paulo, Brazil. These samples were taken from the soil superficial layer of non-contaminated places. Table 1 shows the physic-chemical characteristics of both soils.
Physicochemical characterization of the stillage
Bartha and Pramer respirometric method
Biodegradation experiments, according to the Bartha and Pramer Respirometric Method (1965), were carried out in Bartha biometer flasks (250 ml) used to measure the microbial production of CO2
(Table 2). For each type of soil, flasks were prepared in triplicates with 50 g of soil and addition of stillage or water with and without inoculum according to the protocol (Table 3). Samples were incubated at 27°C in the dark. The quantity of stillage added to the treatments was of 16% and they were properly adjusted for 60% of water retention capacity for each soil.
Quantification of CO2 production generated in the respirometric
experiment and the calculations of biodegradation efficiency obeyed the technical rule L6350 (Cetesb, 1990).
Microbial count
Inolucum (embiotic line) microbial count in colony forming units (CFU/ml)
After the inoculum activation, the bacteria count was carried out by
“Pour-Plate” technique in PCA environment with addition of actidione (5 ppm), according to the technical rule L. 5.201 (Cetesb,
Table 1. Physicochemical characteristics of Soils 1 (sandy) and 2 (clay).
Type Macronutrients (mmolc/dm
3
) IFSA V Relations
K Ca Mg H+Al Al SB CTC % Ca/Mg Mg/K
Soil 1 1.1 16 3 31 1 20.3 51.3 39.6 5.33 2.72 Soil 2 4.9 43 15 34 1 63.0 97.0 64.9 2.86 3.06
Micronutrients (mg/dm3) pH OM P res
S Na Fe Mn Cu Zn B CaCl2 g/dm3 g/dm3
Soil 1 8 6 40 3.3 0.3 2.3 0.21 5.1 22 3.0
Soil 2 8 3 19 26.2 1.4 1.9 0.18 5.5 34 3.0
Grain size distribution (%)
Sand Class Sub-class
Thick Fine Clay Loam
Soil 1 55.8 27.3 10.9 6.0 Loam sand Sand
Soil 2 24.4 11.9 25.9 37.8 Clay Clay
P, K, Ca, Mg: exchange resin anionic + cationic, Fe, Mn, Ca, Zn: Extractor DTPA-TEA, B: Barium chloride extractor 0.125%, Soil samples were analyzed by ICASA (Inst. Campineiro de Análise de Solo e Adubo Ltda).
Table 2. Physico-chemical composition of vinasse.
Parameters Results
pH 4.37
ElectricalConductivity (µs/cm) 15110
BOD (mg/L) 7941
COD (mg/L) 25225
C(mg/L) 12500
Hardness (mg CaCO3/L) 276 Ammonia (mg/L) <0.01
Calcium (mg/L) 671
Magnesium (mg/L) 264
Nitrate(mg/L) 1.49
Nitrite(mg/L) 0.033
Potassium(mg/L) 3401
Non-filterable residue (mg/L) 1800
Sodium(mg/L) 114
Sulfate (mg/L) 2993
Table 3. Respirometric experiment for sandy and clay soils.
Respirometric experiment
Sandy or clay soil + water Sandy or clay soil + stillage
Sandy or clay soil + water + Inoculum (embiotic line 0.2%) Sandy or clay soil + stillage + Inoculum (embiotic line 0.2%)
Stillage microbial count
The sample was progressively diluted and plating was carried out by obeying the same procedures from inolucum (embiotic line) microbial count in Colony Forming Units (CFU/ml).
The soil initial and final microbial count
Samples of 10 g of each soil were placed in 90 mL of saline solution (0.85%), and flasks were shaken for 20 min. Afterwards, serial dilutions and platings were carried out according to inolucum (embiotic line) microbial count in Colony Forming Units (CFU/mL). The microorganisms were calculated by counting of colonies in UFC/g of dry soil.
Statistical analysis
Friedman test (Zar, 1999; Ayres et al., 2007) was applied in two ways. For the inoculum performance verification during the biodegradation process and for the verification of the differences observed in this process for both soils involved in the experiment.
RESULTS AND DISCUSSION Bartha and Pramer respirometry
Figures 1 and 2 indicate the increase of CO2 production in the treatments where stillage was added, showing the pollutant biodegradation activity. In the beginning of the process, in sandy soils, there was a discreet increase of CO2 production in the treatment inoculated with embiotic line, which was evidenced in the peak of CO2 production. However, this effect was not maintained. Through the development of the experiment, CO2 rates decreased when compared to the treatment without embiotic line (Figure 1). In clay soils, the CO2 production curve for the treatments with and without the product remained very close (Figure 2). According to Rafaldini et al. (2006), who tested effective microorganisms (EM), from the same manufacturer, in stillage reservoir tanks there was not considerable biodegradation acceleration either.
Figure 1. Daily production of CO2 in sandy soil during 50 days of incubation according to
the respirometric experiment.
Figure 2. Daily production of CO2 in clay soil during 50 days of incubation according to the
Figure 3. Comparison of the daily CO2 production in sandy and clay soil during 20 days of
incubation according to the respirometric experiment.
Figure 3 records the daily production of CO2, indicating that there was a considerable difference in the biodegradation process evolution between the sandy and clay soils. It was observed that in the clay soil the biodegradation began immediately and achieved superior levels of CO2 production when compared to the sandy soil. Certainly, this is due to the greater capacity of liquid and nutrient retention and the presence of autochthonous microorganisms in clay soils. According to Lelis Neto (2008), potassium, nitrate and calcium ions show higher interaction with the solid fraction of that soil, when compared with sandy soil, being retained more easily in the clay soil. The fast stillage biodegradation, just in the first days of the experiment, could inhibit the organic matter leaching, avoiding the contamination of deeper soil layers. According to Lelis Neto (2008), with reference to nitrate percolation, neither soils present risks of groundwater contamination, ever for concentrations of 300 m3/ha.
By analyzing the cumulated production of CO2 (Figure 4), it was observed that the clay soil gotten both in the treatment with stillage and in the control with water, a CO2 level superior to the treatments of sandy soils, evidencing the real difference in the biodegradation process between both soils.
Biodegradation efficiency
On the second day of the trial, the biodegradation
efficiency in the clay soil achieved more than 30%. However, in the sandy soil this index is achieved from the third day on. Although there are significant differences related to the biodegradation of the stillage organic matter in both soils studied, as the statistical tests evidenced, the efficiency in the mineralization of this pollutant achieved 92% in clay soils and 89% in sandy ones in 50 days of trial (Figure 4 and Table 4). Both results were considered excellent with reference to the effluent biodegradation, once the law determines a minimum of 30% efficiency of biodegradation for residue disposal in the soil (NBR 14283- ABNT, 1999).
Initial microbial count
When analyzing Table 5, which registers a microbial count, it was verified that both soils had yeasts and fungi on the order of 104 UFC/g and bacteria on the order of 105 UFC/g. The clay soil presented a slightly superior number of microorganisms.
Final microbial count
Figure 4. Comparison of cumulative CO2 production in sandy and clay soil during 50 days of
incubation according to the respirometric experiment.
Table 4. Biodegradation efficiency (%) of stillage for 50 days in clay and sandy soils.
Day
Biodegradation efficiency (%)
Soil Soil+inoculum
Clay Sandy Clay Sandy
1 11.43 1.39 11.26 0.17
2 31.03 17.48 30.35 18.11
3 45.46 34.18 43.57 34.54
4 54.79 46.38 52.09 45.41
5 60.84 55.36 57.63 53.97
6 64.99 61.44 61.91 59.15
7 68.25 65.81 65.25 63.13
9 72.78 71.46 70.30 68.35
11 75.82 75.14 74.07 71.78
13 78.69 77.66 76.59 74.47
16 81.73 80.10 79.59 76.79
19 84.30 81.94 81.17 78.41
23 86.18 84.43 82.67 80.04
27 88.58 86.71 84.49 81.66
34 90.37 88.90 85.86 83.73
42 91.57 89.52 87.31 84.06
50 92.69 89.65 88.47 83.60
metabolic activity of the microorganisms, and then this activity started decreasing due to the environment depletion. At the end of the trial, the number of microorganisms was smaller or close to the initial one.
Table 5. Initial microbial count. Results for the inoculum (embiotic Line) and stillage are expressed in CFU/ml (Colony Forming Units per ml) and those for sandy and clay soils in CFU/g (Colony Forming Units per g).
Variable Fungi Bacteria
Inoculum* 2.85 × 10⁷ 1.80 × 10⁷
Stillage <100 1.30 × 10²
Sandy soil 2.50 × 10⁴ 4.60 × 10⁵ Clay soil 4.10 × 10⁴ 4.75 × 10⁵ *Filamentous fungi were not observed in the inoculum.
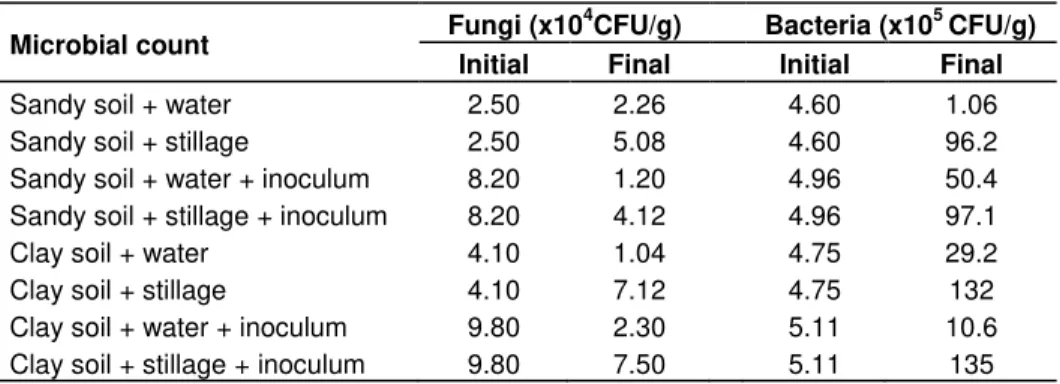
Table 6. Final microbial count for sandy and clay soils in CFU/g (Colony Forming Units per mL gram of soil).
Microbial count Fungi (x10
4CFU/g) Bacteria (x105 CFU/g)
Initial Final Initial Final
Sandy soil + water 2.50 2.26 4.60 1.06 Sandy soil + stillage 2.50 5.08 4.60 96.2 Sandy soil + water + inoculum 8.20 1.20 4.96 50.4 Sandy soil + stillage + inoculum 8.20 4.12 4.96 97.1 Clay soil + water 4.10 1.04 4.75 29.2 Clay soil + stillage 4.10 7.12 4.75 132 Clay soil + water + inoculum 9.80 2.30 5.11 10.6 Clay soil + stillage + inoculum 9.80 7.50 5.11 135
and the increase and maintenance of the microorganisms population. Therefore, the number of bacteria was higher at the end of 50 days. This increase in the bacterial population was also verified by Mariano et al. (2009). Clay soil presents a larger amount of organic matter, water retention capacity and a great number of microorganisms because of its colloidal characteristic, due to the presence of clay. Therefore, it converted both soil and stillage organic matter until its mineralization more efficiently. With reference to the sandy soil, as it has a lower water retention capacity, it presents less organic matter, a smaller number of microorganisms, therefore stillage biodegradation in this kind of soil became less efficient.
Friedman test
When the treatment data with and without the embiotic line are compared, statistical tests showed that in sandy soils there was a significant decrease in the stillage biodegradation when the inoculum was used (p=0.036).
In clay soils the use of the product didn’t vary the
biodegradation significantly (p=0.1456).
However, the comparison made between the biodegradation process performance in sandy and clay soils demonstrated significant differences in both the control treatment, only with water (p=<0.0001), and with treatments with stillage (p=0.0153). Thus, this proves the
major biodegradation capacity of the clay soil when comparing to sandy soil.
Conclusion
With this study it was verified that both soils present good levels of stillage biodegradation. However, clay soils, which present greater field capacity, have higher water, organic matter and microorganism retention capacity, provided a higher efficiency in biodegradation of this effluent, verified statistically. Regarding the use of the embiotic line, the experiment showed that this product
doesn’t interfere positively in the stillage biodegradation
for either soils, with possible adjustments to its composition being necessary.
REFERENCES
ABNT (1999). Associação Brasileira de Normas Técnicas, ABNT/NBR 14283. Resíduos em solos - Determinação da biodegradação pelo método respirométrico. Rio de Janeiro, RJ, P. 08.
Acharya BK, Mohana S, Madamwar D (2008). Anaerobic Treatment of Dehllery spent wash- a study on upflow anaerobic fixed film bioreactor. Bioresour. Technol. 99(11):4621-4626, Jul. ISSN 0960-8524.
Ayres M, Ayres Jr M, Ayres DL, Santos AS (2007). BIOESTAT 5.0, Instituto de Desenvolvimento sustentável Mamirauá - IDSM/MCT/CNPq.
ment of the persistence and biological effects of pesticides in soil. Soil Sci. 100(1):68-70.
Bento FM, Camargo FAO, Okeke B (2003). Bioremediation of soil contaminated by diesel oil. Br. J. Microbiol. 34(1):65-68.
CETESB (1984). Companhia Ambiental do Estado de São Paulo. Norma técnica L. 6.245 – Coleta e preparação de amostras. Procedimentos, São Paulo, P. 25.
CETESB (1986). Companhia Ambiental de São Paulo. Norma técnica L. 5.201- Bactérias Heterotróficas– Contagem em placas: Método de ensaio. São Paulo, P. 26.
CETESB (1990). Companhia Ambiental de São Paulo. Norma técnica L 6.350: Solos – Determinação da Biodegradação de Resíduos Sólidos
– Método Respirométrico de Bartha. São Paulo, P. 15.
Chapelle FH (1994). Assessing the Efficiency of Intrinsic Bioremediation. EPA/540/R - 94/515. Washington, D.C.:U.S. Environmental Protection Agency.
Costa MR (2009). Uso da respirometria para avaliação da biodegradação aeróbia de lixiviado de resíduo sólido urbanos em latossolo vermelho-escuro. 108p. Dissertação de Mestrado em Tecnologia Ambiental e Recursos Hídricos, Dpto. de Engenharia Civil e Ambiental, Faculdade de Tecnologia, Universidade de Brasília. Kannan A, Upreti RK (2008). Influence of Distillery Effluent on
Germination and Growth of Mung Bean (Vgna Radiata) Seeds. J. Mater. 153n(1-2):609-615. ISSN 0304-3594.
Kataoka APAG (2001). Biodegradação de resíduo oleoso de refinaria
de petróleo por microrganismos isolados de “landfarming”. 202 p.
Tese Doutorado em Microbiologia Aplicada – Instituto de Biociências, Universidade Estadual Paulista, Rio Claro.
Lelis Neto JA (2008). Monitoramento de componentes químicos da vinhaça aplicados em diferentes tipos de solo. 88p. Dissertação de Mestrado em Agronomia, Área de concentração: Irrigação e Drenagem – Escola Superior de Agronomia “Luiz de Queiroz”,
Universidade de São Paulo, Piracicaba.
Almeida et al. 4513
MAPA (2012). Brazilian Ministry of Agriculture, Livestock and Food Supply.
Mariano AP, Crivelaro SHR, Angelis DF, Bonotto DM (2009). The use of vinasse as an amendment to ex-situ bioremediation of soil and groundwater contaminated with diesel oil. Braz. Arch. Biol. Technol. 52:4.
Nicochelli LM, Nascentes R, Lima EBNR, Soares FSC (2012). Sorção de potássio em amostras de solo submetidas à aplicação de vinhaça Revista Brasileira de Engenharia Agrícola e Ambiental, 16:n7. Rafaldini ME, Pissinato LB, Manoel RM, Chagas PRR, Almeida RMA
(2006). Controle biológico para sistemas de aplicação de vinhaça no solo. Engenharia Ambiental- Espírito Santo do Pinhal, 3(2):042-057. Renewable Fuels Association (2012). World Fuel Ethanol Production.
Available at:http://www.ethanolrfa.org/pages/world-fuel-ethanol-production. Accessed on: June/2013.
Rossetto AJ (1987). Utilização agronômica dos subprodutos e resíduos da indústria açucareira e alcooleira. In: Cana-de-açúcar – Cultivo e Utilização. 2:435-504.
UNICA (2009). União Nacional das Usinas de Cana-de-açúcar.Estatística de 2009. Availableat: http://www.unica.com.br. Accessed on: March/2012.