ACPD
15, 30609–30644, 2015Contrasting water-soluble PM2.5
oxidative potential with two acellular
assays
T. Fang et al.
Title Page
Abstract Introduction
Conclusions References
Tables Figures
◭ ◮
◭ ◮
Back Close
Full Screen / Esc
Printer-friendly Version Interactive Discussion
Discussion
P
a
per
|
Discussion
P
a
per
|
Discussion
P
a
per
|
Discussion
P
a
per
|
Atmos. Chem. Phys. Discuss., 15, 30609–30644, 2015 www.atmos-chem-phys-discuss.net/15/30609/2015/ doi:10.5194/acpd-15-30609-2015
© Author(s) 2015. CC Attribution 3.0 License.
This discussion paper is/has been under review for the journal Atmospheric Chemistry and Physics (ACP). Please refer to the corresponding final paper in ACP if available.
Oxidative potential of ambient
water-soluble PM
2.5
measured by
Dithiothreitol (DTT) and Ascorbic Acid
(AA) assays in the southeastern United
States: contrasts in sources and health
associations
T. Fang1, V. Verma2, J. T. Bates3, J. Abrams4, M. Klein4, M. J. Strickland4,
S. E. Sarnat4, H. H. Chang5, J. A. Mulholland3, P. E. Tolbert4, A. G. Russell3, and R. J. Weber1
1
School of Earth and Atmospheric Sciences, Georgia Institute of Technology, Atlanta, GA, 30332, USA
2
Department of Civil and Environmental Engineering, University of Illinois Urbana-Champaign, Champaign, IL, 61801, USA
3
ACPD
15, 30609–30644, 2015Contrasting water-soluble PM2.5
oxidative potential with two acellular
assays
T. Fang et al.
Title Page
Abstract Introduction
Conclusions References
Tables Figures
◭ ◮
◭ ◮
Back Close
Full Screen / Esc
Printer-friendly Version Interactive Discussion
Discussion
P
a
per
|
Discussion
P
a
per
|
Discussion
P
a
per
|
Discussion
P
a
per
|
4
Department of Environmental Health, Rollins School of Public Health, Emory University, Atlanta, GA 30322, USA
5
Department of Biostatistics and Bioinformatics, Rollins School of Public Health, Emory University, Atlanta, GA 30322, USA
Received: 20 October 2015 – Accepted: 21 October 2015 – Published: 4 November 2015 Correspondence to: R. J. Weber ([email protected])
ACPD
15, 30609–30644, 2015Contrasting water-soluble PM2.5
oxidative potential with two acellular
assays
T. Fang et al.
Title Page
Abstract Introduction
Conclusions References
Tables Figures
◭ ◮
◭ ◮
Back Close
Full Screen / Esc
Printer-friendly Version Interactive Discussion
Discussion
P
a
per
|
Discussion
P
a
per
|
Discussion
P
a
per
|
Discussion
P
a
per
|
Abstract
The ability of certain components of particulate matter to induce oxidative stress through catalytic generation of reactive oxygen species (ROS) in vivo may be one mechanism accounting for observed linkages between ambient aerosols and adverse health outcomes. A variety of assays have been used to measure this so-called aerosol
5
oxidative potential. We developed a semi-automated system to quantify oxidative po-tential of filter aqueous extracts utilizing the dithiothreitol (DTT) assay and have recently developed a similar semi-automated system using the ascorbic acid (AA) assay. Ap-proximately 500 PM2.5filter samples collected in contrasting locations in the
southeast-ern US were analyzed using both assays. We found that water-soluble DTT activity on
10
a per air volume basis was more spatially uniform than water-soluble AA activity. DTT activity was higher in winter than in summer/fall, whereas AA activity was higher in sum-mer/fall compared to winter, with highest levels near highly trafficked highways. DTT activity was correlated with organic and metal species, whereas AA activity was cor-related with water-soluble metals (especially water-soluble Cu,r=0.70–0.91 at most
15
sites). Source apportionment models, Positive Matrix Factorization (PMF) and a Chem-ical Mass Balance Method with ensemble-averaged source impact profiles (CMB-E), suggest a strong contribution from secondary processes (e.g., organic aerosol oxida-tion or metal mobilizaoxida-tion by formaoxida-tion of an aqueous particle with secondary acids) and traffic emissions to both DTT and AA activities in urban Atlanta. Biomass
burn-20
ing was a large source for DTT activity, but insignificant for AA. DTT activity was well correlated with PM2.5mass (r=0.49–0.86 across sites/seasons), while AA activity did not co-vary strongly with mass. A linear model was developed to estimate DTT and AA activities for the central Atlanta Jefferson Street site, based on the CMB-E sources that are statistically significant with positive coefficients. The model was used to estimate
25
ACPD
15, 30609–30644, 2015Contrasting water-soluble PM2.5
oxidative potential with two acellular
assays
T. Fang et al.
Title Page
Abstract Introduction
Conclusions References
Tables Figures
◭ ◮
◭ ◮
Back Close
Full Screen / Esc
Printer-friendly Version Interactive Discussion
Discussion
P
a
per
|
Discussion
P
a
per
|
Discussion
P
a
per
|
Discussion
P
a
per
|
oxidative potential. Results suggest that estimated DTT activity was associated with ED visits for both asthma/wheeze and congestive heart failure, while AA activity was not linked to any health outcomes. The findings point to the importance of both or-ganic components and transition metals from biomass burning and mobile sources to adverse health outcomes in this region.
5
1 Introduction
Studies have linked exposure to fine particulate matter (PM2.5) with increased
respira-tory (Harkema et al., 2004; Aust, 2002; Schaumann et al., 2004) and cardiovascular (Pope et al., 2004; Samet et al., 2000) diseases. PM2.5 consists of a wide range of
chemical components of potentially varying toxicity, implying that PM2.5is not an ideal 10
air quality metric for assessing health impacts. For example, components such as am-monium, sulfate, nitrate, chloride, and some chemical fraction of mineral dust, may be more benign than transition metals (Gasser et al., 2009; Kodavanti et al., 2005; Akhtar et al., 2010), black carbon (or elemental carbon and associated species) (Kleinman et al., 2007; Brunekreef et al., 1997), polycyclic aromatic hydrocarbons (PAHs)
(Lund-15
stedt et al., 2007; Burchiel et al., 2005), and other specific organics species (Nel et al., 2001). Although a small mass fraction of PM2.5, these components may play a
dispro-portionally large role in overall adverse health effects of PM2.5. In contrast, Harrison et al. (2000) notes that the consistency of epidemiological associations between PM2.5
mass and health effects across regions of widely varying aerosol sources implies that
20
individual chemical components comprising small mass fractions of PM2.5 cannot be responsible for observed PM2.5-health associations. A comprehensive set of
mecha-nisms explaining the observed linkage between PM2.5mass and adverse health effects
has not been established, but it has been hypothesized that one possible contributing mechanism is a particle’s ability to induce oxidative stress via catalytic generation of
re-25
Zielin-ACPD
15, 30609–30644, 2015Contrasting water-soluble PM2.5
oxidative potential with two acellular
assays
T. Fang et al.
Title Page
Abstract Introduction
Conclusions References
Tables Figures
◭ ◮
◭ ◮
Back Close
Full Screen / Esc
Printer-friendly Version Interactive Discussion
Discussion
P
a
per
|
Discussion
P
a
per
|
Discussion
P
a
per
|
Discussion
P
a
per
|
ski et al., 1999), but without available large databases of ambient aerosol ROS, large population-based epidemiologic studies of PM2.5oxidative potential have not been
pos-sible.
We recently developed a semi-automated system (Fang et al., 2015b) to quantify oxidative potential of PM samples utilizing the dithiothreitol (DTT) assay (Cho et al.,
5
2005) and here describe its adaptation to the ascorbic acid (AA) assay (Ayres et al., 2008; Mudway et al., 2005). Among the various available methods for measuring ox-idative potential, these two assays are relatively straightforward and reproducible, al-lowing high throughput routine measurements and the generation of large data sets for exploring links between aerosol components and health through epidemiology, or
10
also as an initial screening step for identifying different redox components for more detailed cell or animal studies (Ayres et al., 2008). Janssen et al. (2015) investigated the two assays in a panel study (n=31) and found significant associations between both assays and nasal and airway inflammation. Both assays involve incubating the anti-oxidant (DTT or AA) with filter aqueous extracts of PM2.5 at a controlled temper-15
ature (37◦C) and pH (7.4), and measuring the depletion of the antioxidant over time, typically detected as a decrease in absorbance at wavelengths of 412 and 265 nm for DTT and AA, respectively. The antioxidant loss rate is interpreted as a measure of the ability of aerosol redox-active species to catalytically transfer electrons from DTT or AA to oxygen (O2). DTT can be considered a chemical surrogate to cellular reductants,
20
such as NADH or NADPH, which reduces O2 to superoxide anion (O−2) and induces
oxidative stress (Kumagai et al., 2002). Unlike DTT, AA is a physiological antioxidant in lung lining fluid, which prevents the oxidation of lipids and proteins (Valko et al., 2005). Asthmatic patients have markedly decreased concentration of AA in lung lining fluid compared to healthy control subjects (Kelly et al., 1999). Therefore, the in vitro
25
ACPD
15, 30609–30644, 2015Contrasting water-soluble PM2.5
oxidative potential with two acellular
assays
T. Fang et al.
Title Page
Abstract Introduction
Conclusions References
Tables Figures
◭ ◮
◭ ◮
Back Close
Full Screen / Esc
Printer-friendly Version Interactive Discussion
Discussion
P
a
per
|
Discussion
P
a
per
|
Discussion
P
a
per
|
Discussion
P
a
per
|
It may be expected, however, that these two different assays respond to different aerosol components and are linked to different health endpoints. The AA assay has been shown to be most sensitive to transition metals (Janssen et al., 2014; Strak et al., 2012; DiStefano et al., 2009; Künzli et al., 2006) but quinone compounds may react with AA as well (Roginsky et al., 1999). For the DTT assay, identified DTT-active PM
com-5
ponents are organic species, including water-soluble organic carbon (WSOC) (Verma et al., 2009a; Cho et al., 2005), or of increasing specificity, HUmic-LIke Substances (HULIS) (Verma et al., 2012; Lin and Yu, 2011), and quinones (Chung et al., 2006; Ku-magai et al., 2002) (a component of HULIS). Other studies, however, have emphasized the role of transition metals, such as Cu and Mn (Vejerano et al., 2015; Charrier and
10
Anastasio, 2012). Some differences between studies may arise due to differing source characteristics of the specific regions studied.
Utilizing our automated analytical system (Fang et al., 2015b), we measured the water-soluble oxidative potential of over 500 filter samples collected as part of the Southeastern Center for Air Pollution & Epidemiology (SCAPE) study using the DTT
15
and AA assays. Here we evaluate and compare the two assays in order to identify the sources and specific aerosol components the assays respond to. We use the sources to generate a model that estimates DTT and AA activities and compare these esti-mated levels to the measured data. The model is then used to backcast DTT and AA levels over the past 10 years for use in a time-series epidemiological analysis in the
20
Atlanta metropolitan area.
2 Methods
2.1 Sampling
Sampling methods have been described in detail in our previous publications (Fang et al., 2015b; Verma et al., 2014). In brief, PM2.5(quartz filters, Pallflex®Tissuquartz™,
25
dif-ACPD
15, 30609–30644, 2015Contrasting water-soluble PM2.5
oxidative potential with two acellular
assays
T. Fang et al.
Title Page
Abstract Introduction
Conclusions References
Tables Figures
◭ ◮
◭ ◮
Back Close
Full Screen / Esc
Printer-friendly Version Interactive Discussion
Discussion
P
a
per
|
Discussion
P
a
per
|
Discussion
P
a
per
|
Discussion
P
a
per
|
ferent source characteristics, using two sets of high-volume samplers (Hi-Vol) (Thermo Anderson, flow rate normally 1.13 m3min−1). Sampling in the metropolitan Atlanta area was carried out from June 2012 through March 2013 (noon–11 a.m., 23 h) and in-volved paired-sites with one Hi-Vol sampler fixed at an urban background site (Jef-ferson Street, referred as JST) whilst the other sampler was deployed at three other
5
sites on a monthly basis, and at least twice during different seasons. These three sites were: a rural site (Yorkville, YRK), a road-side site (RS, adjacent to the interstate high-way I75/85), and a near-road site (GT, 840 m from the RS site). Following sampling in Atlanta, the two samplers were moved to Birmingham, AL (BHM, within a few kilo-meters of significant transportation and industrial sources) and Centerville, AL (CTR,
10
surrounded by forests and a lightly traveled county road) for a month of sampling in June–July 2013, followed by an August sampling at East St. Louis, IL, an urban residen-tial/light commercial area about 3 km east of the central business district of St. Louis, MO (Sauvain et al., 2008). Finally, a GT-RS pair was conducted in September 2013. A table providing the sampling schedule and a map can be found in the supporting
ma-15
terials (Table S1 and Fig. S1 in the Supplement). JST, YRK, BHM, and CTR are all part of the Southeastern Aerosol Research and Characterization Study (SEARCH) network sites (Hansen et al., 2003). Collected samples were immediately wrapped in prebaked aluminum foil and stored at−18◦C until analyzed. DTT, water-soluble organic carbon,
and brown carbon analyses on the filters were conducted within a year of sample
col-20
lection, water-soluble elements were within a year and half, and AA measurements were conducted within two years of sample collection.
2.2 Oxidative potential measurement
2.2.1 Semi-automated system for measuring water-soluble DTT activity
Filter extraction.Three punches of the collected Hi-Vol filter (5.07 cm2each) were
ex-25
tracted in 15 mL of deionized (DI) water (>18 MΩcm−1
Ul-ACPD
15, 30609–30644, 2015Contrasting water-soluble PM2.5
oxidative potential with two acellular
assays
T. Fang et al.
Title Page
Abstract Introduction
Conclusions References
Tables Figures
◭ ◮
◭ ◮
Back Close
Full Screen / Esc
Printer-friendly Version Interactive Discussion
Discussion
P
a
per
|
Discussion
P
a
per
|
Discussion
P
a
per
|
Discussion
P
a
per
|
trasonic Cleanser (VWR International LLC, West Chester, PA, USA) for half an hour. Extracts were then filtered using PTFE 0.45 µm syringe filters (FisherbrandTM) to re-move insoluble materials.
DTT determination. The DTT assay was based on the protocol developed by Cho
et al. (2005) and the semi-automated DTT system has been described in detail in
5
Fang et al. (2015b). In brief, 3.5 mL of the aerosol extract, 1 mL potassium phosphate buffer (Kbuffer, 0.5 mM), and 0.5 mL of DTT solution (1 mM) were incubated at 37◦C in a continuously mixed vial (400 rpm in a ThermoMixer (Eppendorf North America, Inc., Hauppauge, NY, USA)). At five time intervals (4, 13, 23, 30, and 41 min), a small aliquot (100 µL) of the incubated mixture was drawn to another vial and the DTT
ox-10
idation was quenched by adding 1 mL 1 %w/v Trichloroacetic acid (TCA). 0.5 mL of a color developing agent DTNB [5,5′-dithiobis-(2-nitrobenzoic acid), 0.2 mM], with 2 mL of Tris buffer (0.08 M with 4 mM EDTA), was added to form a light absorbing product, which has a high extinction coefficient at 412 nm wavelength. Light absorbance at 412 and 700 nm (chosen as a baseline) for each time interval was recorded and used to
15
calculate the consumption rate of DTT over time (nmol min−1). Final DTT activity was reported as DTT consumption rate per unit of air volume (nmol min−1
m−3
), or per unit of PM mass (nmol min−1µg−1). The automated system was cleaned periodically (typ-ically every 15 days) by flushing at least 3 times with methanol and then 6 times with DI water. Sample selection, various chemical reagent addition and withdrawal, and
20
system self-cleaning were all achieved automatically by programmable syringe pumps (see details in Sect. 2.2.2).
Final DTT activity is calculated as follows:
σDTT=−σAbs× N0
Abs0, (1)
DTT=σDTTVs−σDTTb
a Ve×Vp
, (2)
ACPD
15, 30609–30644, 2015Contrasting water-soluble PM2.5
oxidative potential with two acellular
assays
T. Fang et al.
Title Page
Abstract Introduction
Conclusions References
Tables Figures
◭ ◮
◭ ◮
Back Close
Full Screen / Esc
Printer-friendly Version Interactive Discussion
Discussion
P
a
per
|
Discussion
P
a
per
|
Discussion
P
a
per
|
Discussion
P
a
per
|
whereσAbs is the slope of absorbance (412–700 nm) vs. time; Abs0 is the initial
ab-sorbance calculated from the intercept of linear regression of abab-sorbance vs. time;N0
is the initial moles of DTT added in the reaction (500 nmol);σDTTs(σDTTb) is the rate
of DTT consumption for sample (blank);Ve and Va are the extraction volume (15 mL)
and actual sample volume added to the reaction vial (3.5 mL, i.e., what was actually
5
analyzed), respectively.Vpis the ambient air volume (m 3
) represented by the sample in the extraction volume (Ve, i.e., considering the filter integration time and fraction of filter analyzed). DTT represents volume normalized DTT activity, in units of nmol min−1m−3.
2.2.2 Semi-automated system for measuring AA activity
Filter extraction.Sample preparation protocol for the AA measurement is the same as
10
that for the DTT assay, except that one punch of the filter (5.07 cm2each) was extracted in 30 mL of DI water, (for those having activities close to blanks, 15 mL of extraction DI was used instead).
AA determination.The method in this study was based on an ascorbate-only model
(Mudway et al., 2005; Ayres et al., 2008) which is a simplified approach to a synthetic
15
respiratory tract lining fluid model (RTLF) containing ascorbate, urate, and reduced glutathione (GSH) (Zielinski et al., 1999; Mudway et al., 2004). The semi-automated system for measuring AA activities was adapted from the automated DTT system dis-cussed in Sect. 2.2.1 (Figs. S2 and S3 in the Supplement). The method involves two steps.
20
The first step is an aerosol background measurement (Fig. S2 in the Supplement). In order to control for the contribution of absorbance of particles themselves at 265 nm wavelength, an AA-free control was measured and subtracted from the sample ab-sorbance readings. 2.4 mL aerosol extracts and 0.3 mL 0.5 mM Kbuffer were loaded into a reaction vial (Fig. S3 in the Supplement) (sterile polypropylene centrifuge tube,
25
ACPD
15, 30609–30644, 2015Contrasting water-soluble PM2.5
oxidative potential with two acellular
assays
T. Fang et al.
Title Page
Abstract Introduction
Conclusions References
Tables Figures
◭ ◮
◭ ◮
Back Close
Full Screen / Esc
Printer-friendly Version Interactive Discussion
Discussion
P
a
per
|
Discussion
P
a
per
|
Discussion
P
a
per
|
Discussion
P
a
per
|
Pump B with a 250 µL syringe, and diluted to 3 mL. Pump A then withdrew the diluted mixture from the intermediate vial and pushed it through a Liquid Wave-guide Capillary Cell (LWCC-M-100; World Precision Instruments, Inc., FL, USA) with an optical path length of 100 mm. The waveguide was coupled to an online spectrophotometer, which included a UV-VIS light source (Ocean Optics DT-Mini-2, Ocean Optics, Inc., Dunedin,
5
FL, USA), and a multi-wavelength light detector (USB4000 Miniature Fiber Optic Spec-trometer, Ocean Optics, Inc., Dunedin, FL, USA). Aerosol background absorbance at 265 and 700 nm (baseline) were recorded at two-second intervals using data acqui-sition software (SpectraSuite). For the samples collected in this study, backgrounds due to the aerosol absorption at 265 nm were<10 % of the sample absorbance
read-10
ings. Prior to the second step, the system performed a self-cleaning by flushing the intermediate vial and the two syringes with DI water three times.
The second step is the AA measurement (Fig. S2 in the Supplement). Following the aerosol background measurement, Pump A discarded a fraction of the sample-Kbuffer mixture and left only 1.8 mL in the reaction vial. 0.2 mL 2 mM AA solution was then
15
loaded to the reaction vial using Pump B. Both the reaction and intermediate vial were continuously shaken at 400 rpm in a ThermoMixer (Eppendorf North America, Inc., Hauppauge, NY, USA), which also maintained the incubation temperature at 37◦C. At five different specified times (7, 15, 24, 32, 40 min), a small aliquot (100 µL) was trans-ferred to the intermediate vial, diluted to 3 mL, and pushed through the LWCC,
gener-20
ating a total of five data points quantifying the remaining AA concentration. The system then again performed a self-cleaning before analyzing the next sample. A multi-position valve (14-port, VICI®Valco Instrument Co. Inc., USA) was used to select samples for analysis. To ensure the suspension of PM in the extract, each sample was mixed by pushing 5 mL of air through the extract before loading to the reaction vial. The detailed
25
ACPD
15, 30609–30644, 2015Contrasting water-soluble PM2.5
oxidative potential with two acellular
assays
T. Fang et al.
Title Page
Abstract Introduction
Conclusions References
Tables Figures
◭ ◮
◭ ◮
Back Close
Full Screen / Esc
Printer-friendly Version Interactive Discussion
Discussion
P
a
per
|
Discussion
P
a
per
|
Discussion
P
a
per
|
Discussion
P
a
per
|
Final AA activity is calculated as follows:
σAA=−σAbs× N0
Abs0, (3)
AA=σAAVs−σAAb
a Ve×Vp
. (4)
Following the notation above,σAbs is the slope of absorbance vs. time, where the ab-sorbance is the abab-sorbance of each time interval subtracting the corresponding aerosol
5
background absorbance; Abs0is the initial absorbance calculated from the intercept of
linear regression of absorbance vs. time;N0 is the initial moles of AA added in the
re-action vial (400 nmol);σAAs(σAAb) is the rate of AA consumption for a sample (blank);
Ve and Va are the extraction volume (30 or 15 mL) and sample volume added to the
reaction (1.6 mL), respectively.Vp is the ambient air volume (m 3
) represented by the
10
sample in the extraction volume. AA represents volume normalized AA activity, in unit of nmol min−1m−3.
2.3 Chemical analysis on PM filters
2.3.1 Water-soluble organic carbon and brown carbon
An automated system (details in Fig. S4 in the Supplement) was used to measure
15
water-soluble organic carbon (WSOC) and brown carbon (BrC) on the water-soluble extracts from the same Hi-vol filters. Filter extracts (∼6 mL, same extraction protocol
outlined above), after loading onto a 5 mL sample loop (Upchurch Scientific, Inc., Oak Harbor, WA), were first passed through a 1 m Liquid Wave-guide Capillary Cell (LWCC-2100; World Precision Instruments, Inc., FL, USA), where absorbance at 365 nm
wave-20
ACPD
15, 30609–30644, 2015Contrasting water-soluble PM2.5
oxidative potential with two acellular
assays
T. Fang et al.
Title Page
Abstract Introduction
Conclusions References
Tables Figures
◭ ◮
◭ ◮
Back Close
Full Screen / Esc
Printer-friendly Version Interactive Discussion
Discussion
P
a
per
|
Discussion
P
a
per
|
Discussion
P
a
per
|
Discussion
P
a
per
|
2.3.2 Water-soluble elements
A similar automated system was developed to determine the water-soluble elements, including S (Sulfur), Ca (Calcium), K (Potassium), Fe (Iron), Cu (Copper), Zn (Zinc), Ba (Barium), Pb (Lead), As (Arsenic), Sr (Strontium), Se (Selenium), Br (Bromine), Mn (Manganese), and Ti (Titanium). Filter preparation protocol is the same as described
5
above in Sect. 2.2.1, except that four punches were extracted in 15 mL of DI water, and after filtering, 120 µL of high purity HNO3(OmniTrace
®
Ultra Nitric Acid, 67–70 %, EMD Millipore Corporation, Billerica, MA, USA) was then added to 6 mL of the extract (resulting pH ≈0.7) to ensure the suspension of all dissolved metals. Details of the
method are described in Fang et al. (2015a). In brief, 5 mL of acidified sample was
10
aerosolized using a continuous flow ultrasonic nebulizer (CETAC U5000 AT+, CETAC Technologies, Omaha, NE, USA) and directed through an evaporator at 136◦C followed by a condenser at 3◦C. The dry aerosolized sample was then neutralized by a Kr-85 ion source (Model 3077A, TSI), mixed with filtered make-up air (final flow rate =
16.7 L min−1
, Pall HEPA Capsule), and directed to an online aerosol element analyzer
15
(Xact, Cooper Environmental) for X-ray fluorescence (XRF) analysis.
2.3.3 PM2.5mass
PM2.5 mass concentration was measured by a Tapered Element Oscillating
Microbal-ance (TEOM) by Atmospheric Research Analysis (ARA, Inc.) at SEARCH sites (JST, YRK, BHM, and CTR) and ESL. For the RS and GT sites, the PM mass concentrations
20
ACPD
15, 30609–30644, 2015Contrasting water-soluble PM2.5
oxidative potential with two acellular
assays
T. Fang et al.
Title Page
Abstract Introduction
Conclusions References
Tables Figures
◭ ◮
◭ ◮
Back Close
Full Screen / Esc
Printer-friendly Version Interactive Discussion
Discussion
P
a
per
|
Discussion
P
a
per
|
Discussion
P
a
per
|
Discussion
P
a
per
|
2.4 Source apportionment
Source apportionment of both DTT and AA activities were performed using a Positive Matrix Factorization (PMF) model (EPA PMF 5.0 software) (Paatero and Tapper, 1994) and a Chemical Mass Balance model (version 8.2) with ensemble-averaged source impact profiles (CMB-E) (Balachandran et al., 2012). PMF is a commonly used source
5
apportionment approach that does not require source profiles as CMB-E, whereas CMB-E has better performance and lower relative uncertainties as compared to the PMF method (Balachandran et al., 2012). Source contributions to DTT activity using PMF and CMB-E are discussed in our other publications (Bates et al., 2015; Verma et al., 2014). A PMF analysis on the water-soluble elements (S, K, Ca, Ti, Mn, Fe,
10
Cu, Zn, As, Se, Br, Sr, Ba, and Pb) and WSOC from JST, GT, and RS sites has been reported in Fang et al. (2015a).
For the PMF analysis, water-soluble AA activity was added to the data sets used in prior analyses (Fang et al., 2015a). The uncertainties for each species were deter-mined by multiplying the concentration by overall uncertainties (%), which were
ob-15
tained by propagating the uncertainties from filter sampling (5 %), extraction (5 %), blanks (1σof multiple blanks), calibration (1σof slope, for water-soluble elements), col-located measurements (for water-soluble elements and AA, Fig. S5 in the Supplement), and analytical uncertainties. The analytical uncertainties were obtained by analyzing the same sample/standards multiple times; for example, a composite of extracts from
20
11 samples for water-soluble elements (coefficient of variation, CV=2–16 %); 9,10-phenanthrenequinone for AA (CV=13 %), and sucrose standard solutions for WSOC (CV=10 %). Missing data were replaced by species medians with 400 % uncertainty, and values below LOD were assigned as half of LOD values with uncertainties of 5/6 the concentration (Polissar et al., 1998). Uncertainty from collocated measurements
25
ACPD
15, 30609–30644, 2015Contrasting water-soluble PM2.5
oxidative potential with two acellular
assays
T. Fang et al.
Title Page
Abstract Introduction
Conclusions References
Tables Figures
◭ ◮
◭ ◮
Back Close
Full Screen / Esc
Printer-friendly Version Interactive Discussion
Discussion
P
a
per
|
Discussion
P
a
per
|
Discussion
P
a
per
|
Discussion
P
a
per
|
An ensemble-trained source apportionment approach (Balachandran et al., 2012) (CMB-E) was also used to construct the source impacts of PM2.5 on DTT and AA
activities based on PM2.5 species (sulfate, nitrate, ammonium, OC, EC, and total
met-als), and DTT/AA activity measured during SCAPE sampling periods (2012–2013). The source profiles cover a range of sources, including light-duty gasoline vehicles
5
(LDGV), heavy-duty diesel vehicles (HDDV), ambient sulfate (AMSULF), ambient ni-trate (AMNITR), ammonium bisulfate (AMBSLF), not otherwise apportioned organic carbon (OTHER_OC), dust, biomass burning (BURN), coal fired power plants (CFPP), cement (CEM), and cooking. An ensemble average was calculated for each source category using ten different runs developed from four individual source apportionment
10
methods (Balachandran et al., 2012). Since the filters for the source impact profiles were collected from midnight to midnight while the filters collected for DTT and AA measurement were collected from noon to 11 a.m. next day, the sources identified were linearly interpolated using a fixed ratio. For example, two consecutive filters (filter 1 and 2) were collected from midnight to midnight, we would use 12/24×filter1+11/24×filter2 15
to produce the estimated DTT or AA activities to compared with actual measured data.
2.5 Epidemiological assessment
2.5.1 Backcast-estimates of AA and DTT activities
To undertake a time-series epidemiological analysis with sufficient power, retrospective data sets of daily AA and DTT levels from 1 August 1998 to 31 December 2009 at
20
an Atlanta site representative of the urban airshed air quality are needed. Previous epidemiological studies by the study team assessing Atlanta air quality and emergency department (ED) visits have used data from the SEARCH JST site, the anchor site for our DTT and AA measurements. To generate daily estimates of retrospective DTT and AA activities at JST, first a linear model was used to estimate the contribution of various
25
ACPD
15, 30609–30644, 2015Contrasting water-soluble PM2.5
oxidative potential with two acellular
assays
T. Fang et al.
Title Page
Abstract Introduction
Conclusions References
Tables Figures
◭ ◮
◭ ◮
Back Close
Full Screen / Esc
Printer-friendly Version Interactive Discussion
Discussion
P
a
per
|
Discussion
P
a
per
|
Discussion
P
a
per
|
Discussion
P
a
per
|
air volume basis, with the ensemble-predicted sources as independent variables. In previous work (Balachandran et al., 2012), a source times-series from August 1998 to December 2009 was generated for JST using the same CMB-E model with the same independent variables measured at JST. The DTT and AA regressions were then applied to this time series to construct a time series of estimated DTT and AA
5
activities for the epidemiology study time period, during which direct measurements of AA or DTT were not available.
2.5.2 Epidemiological analyses
Epidemiological time-series analysis (Strickland et al., 2010; Winquist et al., 2015) was employed to assess associations of retrospective DTT and AA activities with health
10
effects as reflected in ED visits. The study team has published extensively on previous work analyzing ED visits data from Atlanta area hospitals in relation to ambient air qual-ity characteristics, as well as the impact of exposure misclassification and other factors (e.g., see Strickland et al., 2015, 2014, 2011, 2010; Darrow et al., 2014; Wingquist et al., 2014; Goldman et al., 2012; Pachon et al., 2012; Sarnat et al., 2010, 2008;
15
Tolbert et al., 2007; Metzger et al., 2004; Peel et al., 2005). For the present analysis, we apply our previously reported epidemiologic modeling approach to the backcast-estimates of AA and DTT activities, in order to assess associations of these newly developed air quality descriptors with selected outcomes in the ED visits data collected from hospitals serving the five-county metropolitan Atlanta area during 1998–2009. The
20
health outcomes investigated in the current analysis are daily visits for respiratory dis-eases, including pneumonia (n=145 610 total visits for study period), chronic obstruc-tive pulmonary disease (n=49 251), and asthma/wheeze (n=263 665), and cardio-vascular diseases, including ischemic heart disease (n=73 477) and congestive heart failure (CHF) (n=70 587). The air quality was modeled as a three-day moving average
25
ACPD
15, 30609–30644, 2015Contrasting water-soluble PM2.5
oxidative potential with two acellular
assays
T. Fang et al.
Title Page
Abstract Introduction
Conclusions References
Tables Figures
◭ ◮
◭ ◮
Back Close
Full Screen / Esc
Printer-friendly Version Interactive Discussion
Discussion
P
a
per
|
Discussion
P
a
per
|
Discussion
P
a
per
|
Discussion
P
a
per
|
monthly knots for time, linear, quadratic and cubic terms for mean daily dew point (lag 0–2), maximum daily temperature (lag 0), and minimum daily temperature (lag 1–2), in-dicators of hospital contribution time periods, season of year, day of week and holiday, and interaction terms between season and maximum temperature, and between sea-son and day of week. These covariates were chosen based on prior studies (Strickland
5
et al., 2010; Winquist et al., 2015) which identified important confounders to the rela-tionship between daily ambient pollution levels and ED visits. Risk ratios (the relative risks of ED visit associated with an increase of one interquartile range of the exposure metric) and 95 % confidence intervals (CI) were used to describe the observed health associations. Risk ratios with confidence intervals above 1 are indicative of statistically
10
significant positive associations. International classification of disease codes used to define the health outcomes can be found in the Supplement.
3 Results and discussion
3.1 Comparing DTT and AA based on measurement during 2012–2013
3.1.1 Spatio-temporal distribution
15
Monthly average water-soluble AA and DTT activities at various sampling sites are given in Fig. 1a and b, respectively. There were differences in the seasonal and spa-tial patterns between AA and DTT activities in the Southeastern US. Figure 1 shows that DTT activity was largely spatially uniform except the JST-YRK pair in winter (De-cember) (DTT at JST>DTT at YRK) (also discussed in previous publications, Verma
20
et al., 2014; Fang et al., 2015b), while AA was heterogeneously distributed, with the highest levels near highly trafficked highways and lowest at rural sites. For exam-ple, the ratio of averaged AA activity at RS to its paired Atlanta urban JST site, was 1.2 in fall and 1.6 in winter (2.7 when including the four high data points in Fig. 1a) and RS to near-road GT was 1.7 in fall 2013. AA was generally lower in rural
ACPD
15, 30609–30644, 2015Contrasting water-soluble PM2.5
oxidative potential with two acellular
assays
T. Fang et al.
Title Page
Abstract Introduction
Conclusions References
Tables Figures
◭ ◮
◭ ◮
Back Close
Full Screen / Esc
Printer-friendly Version Interactive Discussion
Discussion
P
a
per
|
Discussion
P
a
per
|
Discussion
P
a
per
|
Discussion
P
a
per
|
pared to urban environments (ratio of YRK/JST is 0.7 in summer and 0.4 in winter, respectively). An exception is that BHM (urban) and CTR (rural) had similar AA lev-els (BHMavg=0.75±0.45 nmol min−
1
m−3 and CTRavg=0.78±0.31 nmol min− 1
m−3). BHM and the other urban site, ESL (average AA=0.98±0.63 nmol min−1m−3), had
lower AA activities relative to the Atlanta urban sites (average of JST and GT in
sum-5
mer=2.5±1.0 nmol min−1m−3). The higher AA activities near traffic sources have also
been found in other studies (Janssen et al., 2014, 2015; Strak et al., 2012).
The seasonal distribution can be examined from the Atlanta sites, JST, GT, RS, and YRK. As discussed in our previous work (Verma et al., 2014; Fang et al., 2015b), there was high heterogeneity in DTT levels across seasons at JST with the highest level
10
in December (winter), while there was no significant seasonal variation observed at YRK, GT and the RS site (also seen in Fig. 1). In contrast, the AA activity was higher in summer/fall compared to winter; the ratio of summer or fall to winter was 1.8, 2.9, 1.0, and 3.1 (average ratio is 2.2±0.9) for JST, YRK, RS, and GT, respectively. These
results indicate that water-soluble DTT and AA activities of PM2.5were influenced by
15
different aerosol components from differing sources that varied with season.
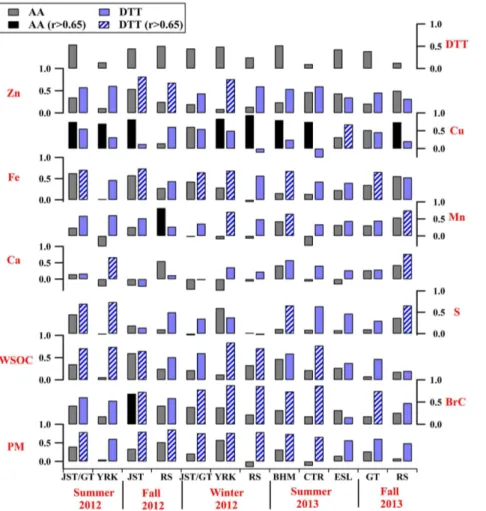
3.1.2 Correlations with chemical components
As an initial step to identify major sources for DTT and AA activities, a correlation analysis was performed between the assays and selected chemical components, in-cluding BrC (a biomass burning indicator), WSOC and S (secondary processes), Ca
20
(mineral dust), and selected transition metals (Cu, Fe, Mn, and Zn) that have been re-lated to adverse health outcomes (Cheung et al., 2012, 2010; Kam et al., 2011; Shen and Anastasio, 2011; Akhtar et al., 2010; Landreman et al., 2008; Zhang et al., 2008; Kodavanti et al., 2005). Correlation coefficients based on linear regressions between DTT or AA activity and chemical species (Pearson’sr) are shown graphically in Fig. 2.
25
ACPD
15, 30609–30644, 2015Contrasting water-soluble PM2.5
oxidative potential with two acellular
assays
T. Fang et al.
Title Page
Abstract Introduction
Conclusions References
Tables Figures
◭ ◮
◭ ◮
Back Close
Full Screen / Esc
Printer-friendly Version Interactive Discussion
Discussion
P
a
per
|
Discussion
P
a
per
|
Discussion
P
a
per
|
Discussion
P
a
per
|
their close proximity and high correlation (r2>0.5) reported in our previous work for many PM species, such as EC (Verma et al., 2014), WSOC (Verma et al., 2014), and water-soluble elements (Fang et al., 2015a). As shown in Fig. 2, DTT activity was cor-related with S (r =0.7 at JST/GT, 0.74 at YRK, 0.66 at BHM) and WSOC (r=0.71 at JST/GT, 0.74 at YRK, 0.77 at CTR) in summer, suggesting the important role of
5
secondary processing (Verma et al., 2009a; McWhinney et al., 2013). These correla-tions diminished in fall (r =0.14–0.66 for S and r =0.20–0.65 for WSOC) and weak correlations were observed in winter (r <0.4) for S. Instead, higher correlations were found between DTT and BrC (r=0.78–0.88) and WSOC (r=0.60–0.84) in winter. This suggests an increasing contribution of biomass burning to winter DTT activities
10
(Verma et al., 2009b). DTT activities were also correlated with various metals, includ-ing Ca (r=0.67–0.77), Mn (r=0.65–0.75), Fe (r =0.65–0.74), Cu (r =0.68), and Zn (r=0.76–0.82), but there were no apparent seasonal patterns for the correlations be-tween DTT and these water-soluble metals since they were related to mineral dust (68 % of Ca, 45 % of Mn, and 26 % of Fe) and vehicle brake/tire wear emissions (51 %
15
of Cu, 45 % of Zn, 32 % of Fe, and 17 % of Mn), as reported by Fang et al. (2015a). In contrast, AA has a much narrower sensitivity to aerosol species than DTT in that it was only correlated with water-soluble Cu (r =0.70–0.94 for most sites/seasons except JST in February, GT in March, and GT/RS in September 2013) (Fig. 2) in the South-eastern US. High correlations between AA and Cu are consistent with other studies
20
(Janssen et al., 2014; Künzli et al., 2006), although the correlation coefficients (r) in our work (0.70–0.94) were higher (0.60–0.74 in other studies), possibly because we used water-soluble Cu and the other studies used elemental (total) concentrations. Strak et al. (2012) also reports a higher r value between AA and water-soluble Cu (r=0.82) than that between AA and total Cu (r=0.76) from the same sample set.
25
DTT activities (per volume) were correlated with PM2.5mass (r =0.49–0.86, Fig. 2),
ACPD
15, 30609–30644, 2015Contrasting water-soluble PM2.5
oxidative potential with two acellular
assays
T. Fang et al.
Title Page
Abstract Introduction
Conclusions References
Tables Figures
◭ ◮
◭ ◮
Back Close
Full Screen / Esc
Printer-friendly Version Interactive Discussion
Discussion
P
a
per
|
Discussion
P
a
per
|
Discussion
P
a
per
|
Discussion
P
a
per
|
has been linked with adverse health endpoints in many epidemiological studies (Laden et al., 2000; Pope et al., 2002, 2004; Metzger et al., 2004; Sarnat et al., 2008), thus the correlation of DTT with PM2.5mass suggests a linkage between DTT-measured
ox-idative potential and health endpoints. In summary, AA and DTT assays have differing responses to PM chemical species, further suggested by a lack of strong correlation
5
between the two assays at all sites (r <0.55, Fig. 2), similar to findings from other studies (r <0.65) (Janssen et al., 2014, 2015; Yang et al., 2014).
3.1.3 Source apportionment
Various source contributions to water-soluble AA and DTT activities resolved from PMF and CMB-E based on measured data during 2012–2013 are shown in Fig. 3a–d,
re-10
spectively. For water-soluble AA activity, the detailed loadings of various species and time series of each factor suggested by PMF can be found in Fig. S6 in the Supplement.
AA sources.Comparing Fig. 3a and b shows that CMB-E and PMF gave consistent
and complementary results for AA sources. CMB-E indicated that vehicles comprise almost half of the total source contributions to PM2.5 AA activity with roughly equal 15
contributions from light and heavy duty vehicles. PMF also found vehicle emissions as a major source, but resolved the source as mechanical generation processes (44 % from brake/tire wear). Both methods also found sources of AA associated with sec-ondary processes. CMB-E provides more details in that it separated out secsec-ondary organic and ambient sulfate sources. This is consistent with our source apportionment
20
analyses on water-soluble metals (Fang et al., 2015a), which showed that Cu was mainly associated with secondary formation and brake/tire wear, consistent with AA being highly correlated with Cu. The 19 % other OC source is related to un-apportioned OC and so includes mainly secondary biogenic organic aerosols. At this point, the role it plays as a source of AA is not clear. It should be noted that the residual for PMF was
25
−10 % and that for CMB-E was 14 %, which means the PMF model over-predicted and
ACPD
15, 30609–30644, 2015Contrasting water-soluble PM2.5
oxidative potential with two acellular
assays
T. Fang et al.
Title Page
Abstract Introduction
Conclusions References
Tables Figures
◭ ◮
◭ ◮
Back Close
Full Screen / Esc
Printer-friendly Version Interactive Discussion
Discussion
P
a
per
|
Discussion
P
a
per
|
Discussion
P
a
per
|
Discussion
P
a
per
|
AA compared to DTT sources. The source apportionment results on water-soluble
DTT activity using PMF (Verma et al., 2014) and CMB-E were compared to those for AA. PMF source apportionment analyses (Fig. 3a and c) suggest a common contri-bution from traffic emissions and secondary processes to both water-soluble DTT and AA activities, but the contributions were stronger for AA than DTT. For example, 44 %
5
AA activity was attributed to vehicles and 56 % to secondary processes, compared to 16 and 31 % of DTT activities, respectively. This is because a large fraction of the DTT activities (35 %) were related to biomass burning while only 1 % of AA activities were attributed to biomass burning. CMB-E also found similar contribution from biomass burning (36 % BURN in Fig. 3d) to DTT activities. The common contribution of
ammo-10
nium sulfate (AMSULF) to DTT and AA may represent different sources, i.e., organic aerosol oxidation or metal mobilization by formation of an aqueous particle with sec-ondary acids. Note that for water-soluble DTT, traffic emissions included both metals and organic aerosol species, that is from mechanically generated (brake/tire wear) and combustion (tail pipe emissions), respectively, whereas AA was almost exclusively
as-15
sociated with mechanically generated aerosols (i.e. brake/tire wear).
3.2 AA and DTT activities compared to health endpoints and application to epidemiological models
3.2.1 Backcast-estimates of AA and DTT activities using source impacts
Although over roughly 1 year of DTT and AA activities were generated for the central
20
JST site in Atlanta, longer data sets are generally needed for a time series epidemio-logical study. To generate these data, multiple linear regressions were used to estimate AA and DTT activities from the CMB-E identified sources. Water-soluble AA and DTT activities (nmol min−1m−3) measured between 2012 and 2013 at JST were regressed against all CMB-E sources. Insignificant sources (pofF statistic of coefficient>0.05,
25
ACPD
15, 30609–30644, 2015Contrasting water-soluble PM2.5
oxidative potential with two acellular
assays
T. Fang et al.
Title Page
Abstract Introduction
Conclusions References
Tables Figures
◭ ◮
◭ ◮
Back Close
Full Screen / Esc
Printer-friendly Version Interactive Discussion
Discussion
P
a
per
|
Discussion
P
a
per
|
Discussion
P
a
per
|
Discussion
P
a
per
|
nitrate) in the AA regression, likely due to their opposite seasonal trends to the AA ac-tivity. Biomass burning contributed only 1 % and ammonium nitrate did not contribute to AA activity (see Fig. 3a). The final regressions for AA and DTT activities are:
AA=0.079+0.19 LDGV+0.23 HDDV+0.063 AMSULF+0.075 OTHER_OC (5) DTT=0.067+0.11 LDGV+0.045 HDDV+0.02 AMSULF+0.069 BURN (6)
5
where DTT and AA are the estimated ROS activities of PM2.5(nmol min− 1
m−3), which are related to the following sources (µg m−3): light-duty gasoline vehicles (LDGV), heavy-duty diesel vehicles (HDDV), ammonium sulfate (AMSULF), biomass burning (BURN), and other organic carbon (OTHER_OC). The coefficients in the equations represent the intrinsic activities (nmol min−1
µg−1
) of the sources, a measure of the
10
strength of the source on a per PM2.5 mass basis for water-soluble AA or DTT
activi-ties. Interestingly, for both assays, the traffic sources (LDGV+HDDV) has the highest ROS intrinsic activity, while secondary sources or biomass burning have relatively lower ROS intrinsic activities. The high DTT intrinsic activity in the traffic source might be attributed to metals that have much higher intrinsic DTT activities (Charrier and
Anas-15
tasio, 2012; Verma et al., 2015). Although biomass burning has a lower DTT intrinsic activity, it was the largest contributor to DTT activity due to the strength of this source over the measurement period (Bates et al., 2015). For AA, vehicles and secondary for-mation had the largest contribution. The intercepts (0.079 and 0.067 for AA and DTT regression, respectively) indicate some levels of discrepancy between the model and
20
measurement, and r values (0.60 and 0.68 for AA and DTT, respectively) between measured and predicted activities represent the uncertainties. Regression coefficients, p values, and the correlation coefficients (r) between measured and estimated data are in Table S3 in the Supplemnt. To test the sensitivity of the epidemiological results to other predictive models, two other regressions were used to predict DTT and AA: (1)
25
ACPD
15, 30609–30644, 2015Contrasting water-soluble PM2.5
oxidative potential with two acellular
assays
T. Fang et al.
Title Page
Abstract Introduction
Conclusions References
Tables Figures
◭ ◮
◭ ◮
Back Close
Full Screen / Esc
Printer-friendly Version Interactive Discussion
Discussion
P
a
per
|
Discussion
P
a
per
|
Discussion
P
a
per
|
Discussion
P
a
per
|
3.2.2 Health associations from time-series epidemiological models
Backcast AA and DTT activities were next generated for the study period correspond-ing to the health analysis. The regressions from Eqs. (5) and (6) were used to generate daily retrospective estimates of AA and DTT activities at the JST site for the period of 1998–2009 (Bates et al., 2015), based on existing source impacts generated in
5
a previous study in the Southeastern US (Balachandran et al., 2012). Estimated water-soluble DTT and AA activities were run separately in epidemiological models of ED visits for selected outcomes (Sect. 2.5.2). The risk ratios for DTT and AA activities for asthma/wheeze and congestive heart failure are presented in Fig. 4 (data given in Ta-ble S4 in the Supplement). The other health outcomes (chronic obstructive pulmonary
10
disease, pneumonia, and ischemic heart disease) did not show significant associations with estimated DTT or AA activity (results not presented).
For asthma/wheeze and congestive heart failure, the risk ratios for an increase of an interquartile range for DTT estimated from the model (Eq. 6) were above 1 (Fig. 4), and the 95 % confidence intervals exclude 1, indicating a statistically significant positive
as-15
sociation between estimated DTT and the ED visits for these health outcomes. In con-trast, neither of the health outcomes showed statistically significant associations with the AA estimates. Similar differences were found for estimates based on the two other regressions (see Fig. S7 in the Supplement). A possible cause for the differences in DTT and AA health associations is differences in uncertainties in the estimated
histori-20
cal ROS activities; the model did not observed AA activities as well as DTT, (observed vs. predictedr values 0.60 and 0.68 for AA and DTT, respectively). For this study re-gion, the more narrow selectivity of the AA assay to specific aerosol components (i.e., mostly sensitive to Cu) may result in AA not capturing the integrated ROS activity of all the various PM components as well as the DTT assay.
25
ACPD
15, 30609–30644, 2015Contrasting water-soluble PM2.5
oxidative potential with two acellular
assays
T. Fang et al.
Title Page
Abstract Introduction
Conclusions References
Tables Figures
◭ ◮
◭ ◮
Back Close
Full Screen / Esc
Printer-friendly Version Interactive Discussion
Discussion
P
a
per
|
Discussion
P
a
per
|
Discussion
P
a
per
|
Discussion
P
a
per
|
congestive heart failure are consistent with these studies and suggest the impor-tance of organic components and transition metals from biomass burning and vehicular emissions in the Southeastern US, and support aerosol particle oxidative potential as a mechanism contributing to these PM-induced adverse health effects.
4 Summary
5
Approximately 500 PM2.5high-volume filter samples collected in the Southeastern US
were analyzed for aerosol oxidative potential using the DTT and AA assays. We found that water-soluble DTT activity (nmol min−1m−3) was fairly spatially uniform and higher in winter than in summer/fall at the urban Atlanta site, whereas water-soluble AA activ-ity had highest levels near roadways, and an opposite seasonal trend (higher in
sum-10
mer/fall than winter). DTT activity was correlated with organic species, water-soluble metals (Fe, Cu, Zn, Mn, and Ca), and PM2.5 mass, whereas AA activity was only
cor-related with water-soluble metals (especially water-soluble Cu). Source apportionment suggest that secondary processes and traffic emissions were strong contributors to both DTT and AA activities in urban Atlanta, GA, with traffic emissions the most
im-15
portant. Biomass burning was a large source for DTT activity, but insignificant for AA. Multiple linear regressions suggest that mobile sources have the highest ROS intrinsic activities (i.e., activities per PM2.5mass from that source) for both assays. Time-series
epidemiological analyses using backcast estimates of DTT and AA activities based on 10 year historical source impacts suggest that DTT activity was associated with
emer-20
gency department (ED) visits for both asthma/wheeze and congestive heart failure, while AA activity was not linked to any health outcomes. For the region investigated in this study, the DTT assay was a more comprehensive multi-pollutant ROS (or oxidative potential) indicator than the AA assay making DTT a potentially valuable parameter to include in future PM health-related studies. The ability to readily measure both AA and
25
ACPD
15, 30609–30644, 2015Contrasting water-soluble PM2.5
oxidative potential with two acellular
assays
T. Fang et al.
Title Page
Abstract Introduction
Conclusions References
Tables Figures
◭ ◮
◭ ◮
Back Close
Full Screen / Esc
Printer-friendly Version Interactive Discussion
Discussion
P
a
per
|
Discussion
P
a
per
|
Discussion
P
a
per
|
Discussion
P
a
per
|
The Supplement related to this article is available online at doi:10.5194/acpd-15-30609-2015-supplement.
Acknowledgements. This publication was made possible by US EPA grant R834799. The con-tents are solely the responsibility of the grantee and do not necessarily represent the official views of the US EPA. Further, US EPA does not endorse the purchase of any commercial
prod-5
ucts or services mentioned in the publication. The authors thank Laura King for assistance in collecting samples, R. Erik Weber and Janessa Riana Rowland for assistance in lab work and the SEARCH personnel for their many contributions supporting the field deployments. T. Fang acknowledges the support from the Oversea Study Program of Guangzhou Elite Project.
References
10
Akhtar, U. S., McWhinney, R. D., Rastogi, N., Abbatt, J. P. D., Evans, G. J., and Scott, J. A.: Cytotoxic and proinflammatory effects of ambient and source-related particulate matter (PM) in relation to the production of reactive oxygen species (ROS) and cytokine adsorption by particles, Inhal. Toxicol., 22, 37–47, doi:10.3109/08958378.2010.518377, 2010.
Aust, A., Ball, J., Hu, A., Lighty, J., Smith, K., Straccia, A., Veranth, J., and Young, W.: Particle
15
characteristics responsible for effects on human lung epithelial cells, Res. Rep. Health Eff. Inst., 1–65, 2002.
Ayres, J. G., Borm, P., Cassee, F. R., Castranova, V., Donaldson, K., Ghio, A., Harrison, R. M., Hider, R., Kelly, F., and Kooter, I. M.: Evaluating the toxicity of airborne particulate matter and nanoparticles by measuring oxidative stress potential-a workshop report and consensus
20
statement, Inhal. Toxicol., 20, 75–99, 2008.
Balachandran, S., Pachon, J. E., Hu, Y., Lee, D., Mulholland, J. A., and Russell, A. G.: Ensemble-trained source apportionment of fine particulate matter and method uncertainty analysis, Atmos. Environ., 61, 387–394, doi:10.1016/j.atmosenv.2012.07.031, 2012.
Bates, J. T., Weber, R. J., Abrams, J., Verma, V., Fang, T., Klein, M, Strickland, M. J.,
Sar-25
ACPD
15, 30609–30644, 2015Contrasting water-soluble PM2.5
oxidative potential with two acellular
assays
T. Fang et al.
Title Page
Abstract Introduction
Conclusions References
Tables Figures
◭ ◮
◭ ◮
Back Close
Full Screen / Esc
Printer-friendly Version Interactive Discussion
Discussion
P
a
per
|
Discussion
P
a
per
|
Discussion
P
a
per
|
Discussion
P
a
per
|
Brunekreef, B., Janssen, N. A., de Hartog, J., Harssema, H., Knape, M., and van Vliet, P.: Air pollution from truck traffic and lung function in children living near motorways, Epidemiology, 8, 298–303, doi:10.1097/00001648-199705000-00012, 1997.
Burchiel, S. W., Lauer, F. T., Dunaway, S. L., Zawadzki, J., McDonald, J. D., and Reed, M. D.: Hardwood smoke alters murine splenic T cell responses to mitogens
fol-5
lowing a 6-month whole body inhalation exposure, Toxicol. Appl. Pharm., 202, 229–236, doi:10.1016/j.taap.2004.06.024, 2005.
Charrier, J. G. and Anastasio, C.: On dithiothreitol (DTT) as a measure of oxidative potential for ambient particles: evidence for the importance of soluble transition metals, Atmos. Chem. Phys., 12, 9321–9333, doi:10.5194/acp-12-9321-2012, 2012.
10
Cheung, K. L., Ntziachristos, L., Tzamkiozis, T., Schauer, J. J., Samaras, Z., Moore, K. F., and Sioutas, C.: Emissions of particulate trace elements, metals and organic species from gasoline, diesel, and biodiesel passenger vehicles and their relation to oxidative potential, Aerosol Sci. Tech., 44, 500–513, doi:10.1080/02786821003758294, 2010.
Cheung, K., Shafer, M. M., Schauer, J. J., and Sioutas, C.: Diurnal trends in oxidative potential of
15
coarse particulate matter in the Los Angeles basin and their relation to sources and chemical composition, Environ. Sci. Technol., 46, 3779–3787, doi:10.1021/es204211v, 2012.
Cho, A. K., Sioutas, C., Miguel, A. H., Kumagai, Y., Schmitz, D. A., Singh, M., Eiguren-Fernandez, A., and Froines, J. R.: Redox activity of airborne particulate matter at different sites in the Los Angeles Basin, Environ. Res., 99, 40–47, 2005.
20
Chung, M. Y., Lazaro, R. A., Lim, D., Jackson, J., Lyon, J., Rendulic, D., and Hasson, A. S.: Aerosol-borne quinones and reactive oxygen species generation by particulate matter ex-tracts, Environ. Sci. Technol., 40, 4880–4886, doi:10.1021/es0515957, 2006.
Darrow, L. A., Klein, M., Flanders, W. D., Mulholland, J. A., Tolbert, P. E., and Strickland, M. J.: Air pollution and acute respiratory infections among children 0–4 years of age: an 18-year
25
time-series study, Am. J. Epidemiol., 180, 968–977, doi:10.1093/aje/kwu234, 2014.
DiStefano, E., Eiguren-Fernandez, A., Delfino, R. J., Sioutas, C., Froines, J. R., and Cho, A. K.: Determination of metal-based hydroxyl radical generating capacity of ambient and diesel exhaust particles, Inhal. Toxicol., 21, 731–738, doi:10.1080/08958370802491433, 2009. Donaldson, K., Stone, V., Seaton, A., and MacNee, W.: Ambient particle inhalation and the
30
ACPD
15, 30609–30644, 2015Contrasting water-soluble PM2.5
oxidative potential with two acellular
assays
T. Fang et al.
Title Page
Abstract Introduction
Conclusions References
Tables Figures
◭ ◮
◭ ◮
Back Close
Full Screen / Esc
Printer-friendly Version Interactive Discussion
Discussion
P
a
per
|
Discussion
P
a
per
|
Discussion
P
a
per
|
Discussion
P
a
per
|
Donaldson, K., Tran, L., Jimenez, L., Duffin, R., Newby, D., Mills, N., MacNee, W., and Stone, V.: Combustion-derived nanoparticles: a review of their toxicology following inhalation exposure, Part Fibre Toxicol., 2, 10, doi:10.1186/1743-8977-2-10, 2005.
Fang, T., Guo, H., Verma, V., Peltier, R. E., and Weber, R. J.: PM2.5water-soluble elements in the southeastern United States: automated analytical method development, spatiotemporal
5
distributions, source apportionment, and implications for heath studies, Atmos. Chem. Phys. Discuss., 15, 17189–17227, doi:10.5194/acpd-15-17189-2015, 2015a.
Fang, T., Verma, V., Guo, H., King, L. E., Edgerton, E. S., and Weber, R. J.: A semi-automated system for quantifying the oxidative potential of ambient particles in aqueous extracts using the dithiothreitol (DTT) assay: results from the Southeastern Center for Air Pollution and
Epi-10
demiology (SCAPE), Atmos. Meas. Tech., 8, 471–482, doi:10.5194/amt-8-471-2015, 2015b. Gasser, M., Riediker, M., Mueller, L., Perrenoud, A., Blank, F., Gehr, P., and
Rothen-Rutishauser, B.: Toxic effects of brake wear particles on epithelial lung cells in vitro, Part. Fibre Toxicol., 6, 30, doi:10.1186/1743-8977-6-30, 2009.
Goldman, G. T., Mulholland, J. A., Russell, A. G., Gass, K., Strickland, M. J., and
Tol-15
bert, P. E.: Characterization of ambient air pollution measurement error in a time-series health study using a geostatistical simulation approach, Atmos. Environ., 57, 101–108, doi:10.1016/j.atmosenv.2012.04.045, 2012.
Hansen, D. A., Edgerton, E. S., Hartsell, B. E., Jansen, J. J., Kandasamy, N., Hidy, G. M., and Blanchard, C. L.: The Southeastern aerosol research and characterization study: Part 1 –
20
overview, JAPCA J. Air Waste Ma., 53, 1460–1471, doi:10.1080/10473289.2003.10466318, 2003.
Harkema, J. R., Keeler, G., Wagner, J., Morishita, M., Timm, E., Hotchkiss, J., Marsik, F., Dvonch, T., Kaminski, N., and Barr, E.: Effects of concentrated ambient particles on normal and hypersecretory airways in rats, Res. Rep. Health Eff. Inst., 120, 1–68, 2004.
25
Harrison, R. M. and Yin, J.: Particulate matter in the atmosphere: which particle properties are important for its effects on health?, Sci. Total Environ., 249, 85–101, doi:10.1016/S0048-9697(99)00513-6, 2000.
Janssen, N. A. H., Yang, A., Strak, M., Steenhof, M., Hellack, B., Gerlofs-Nijland, M. E., Kuhlbusch, T., Kelly, F., Harrison, R., Brunekreef, B., Hoek, G., and Cassee, F.: Oxidative
30
ACPD
15, 30609–30644, 2015Contrasting water-soluble PM2.5
oxidative potential with two acellular
assays
T. Fang et al.
Title Page
Abstract Introduction
Conclusions References
Tables Figures
◭ ◮
◭ ◮
Back Close
Full Screen / Esc
Printer-friendly Version Interactive Discussion
Discussion
P
a
per
|
Discussion
P
a
per
|
Discussion
P
a
per
|
Discussion
P
a
per
|
Janssen, N. A. H., Strak, M., Yang, A., Hellack, B., Kelly, F. J., Kuhlbusch, T. A. J., Harri-son, R. M., Brunekreef, B., Cassee, F. R., Steenhof, M., and Hoek, G.: Associations between three specific a-cellular measures of the oxidative potential of particulate matter and mark-ers of acute airway and nasal inflammation in healthy voluntemark-ers, Occup. Environ. Med., 72, 49–56, 2015.
5
Kam, W., Ning, Z., Shafer, M. M., Schauer, J. J., and Sioutas, C.: Chemical characteriza-tion and redox potential of coarse and fine particulate matter (PM) in underground and ground-level rail systems of the Los Angeles metro, Environ. Sci. Technol., 45, 6769–6776, doi:10.1021/es201195e, 2011.
Kelly, F. J., Mudway, I., Blomberg, A., Frew, A., and Sandström, T.: Altered lung
antioxi-10
dant status in patients with mild asthma, The Lancet, 354, 482–483, doi:10.1016/S0140-6736(99)01812-7, 1999.
Kleinman, M. T., Sioutas, C., Froines, J. R., Fanning, E., Hamade, A., Mendez, L., Meacher, D., and Oldham, M.: Inhalation of concentrated ambient particulate matter near a heavily traf-ficked road stimulates antigen-induced airway responses in mice, Inhal. Toxicol., 19, 117–
15
126, doi:10.1080/08958370701495345, 2007.
Kodavanti, U. P., Schladweiler, M. C., Ledbetter, A. D., McGee, J. K., Walsh, L., Gilmour, P. S., Highfill, J. W., Davies, D., Pinkerton, K. E., Richards, J. H., Crissman, K., Andrews, D., and Costa, D. L.: Consistent pulmonary and systemic responses from inhalation of fine concen-trated ambient particles: roles of rat strains used and physicochemical properties, Environ.
20
Health Persp., 113, 1561–1568, doi:10.1289/ehp.7868, 2005.
Kumagai, Y., Koide, S., Taguchi, K., Endo, A., Nakai, Y., Yoshikawa, T., and Shimojo, N.: Oxi-dation of proximal protein sulfhydryls by phenanthraquinone, a component of diesel exhaust particles, Chem. Res. Toxicol., 15, 483–489, doi:10.1021/tx0100993, 2002.
Künzli, N., Mudway, I. S., Götschi, T., Shi, T., Kelly, F. J., Cook, S., Burney, P., Forsberg, B.,
25
Gauderman, J. W., Hazenkamp, M. E., Heinrich, J., Jarvis, D., Norbäck, D., Payo-Losa, F., Poli, A., Sunyer, J., and Borm, P. J. A.: Comparison of oxidative properties, light absorbance, and total and elemental mass concentration of ambient PM(2.5) collected at 20 European sites, Environ. Health Persp., 114, 684–690, doi:10.1289/ehp.8584, 2006.
Laden, F., Neas, L. M., Dockery, D. W., and Schwartz, J.: Association of fine particulate matter
30