ACPD
14, 19625–19672, 2014Reactive oxygen species associated
with water-soluble PM2.5
V. Verma et al.
Title Page
Abstract Introduction
Conclusions References
Tables Figures
◭ ◮
◭ ◮
Back Close
Full Screen / Esc
Printer-friendly Version
Interactive Discussion
Discussion
P
a
per
|
Discus
sion
P
a
per
|
Discussion
P
a
per
|
Discussion
P
a
per
|
Atmos. Chem. Phys. Discuss., 14, 19625–19672, 2014 www.atmos-chem-phys-discuss.net/14/19625/2014/ doi:10.5194/acpd-14-19625-2014
© Author(s) 2014. CC Attribution 3.0 License.
This discussion paper is/has been under review for the journal Atmospheric Chemistry and Physics (ACP). Please refer to the corresponding final paper in ACP if available.
Reactive oxygen species associated with
water-soluble PM
2.5
in the southeastern
United States: spatiotemporal trends and
source apportionment
V. Verma1, T. Fang1, H. Guo1, L. King1, J. T. Bates1, R. E. Peltier2, E. Edgerton3, A. J. Russell1, and R. J. Weber1
1
Georgia Institute of Technology, 311 Ferst Drive, Atlanta, GA 30328, USA
2
University of Massachusetts Amherst, 686 North Pleasant Street, Amherst, MA 01003, USA
3
Atmospheric Research & Analysis, 410 Midenhall Way, Cary, NC 27513, USA
Received: 10 July 2014 – Accepted: 17 July 2014 – Published: 30 July 2014
Correspondence to: R. J. Weber ([email protected])
ACPD
14, 19625–19672, 2014Reactive oxygen species associated
with water-soluble PM2.5
V. Verma et al.
Title Page
Abstract Introduction
Conclusions References
Tables Figures
◭ ◮
◭ ◮
Back Close
Full Screen / Esc
Printer-friendly Version
Interactive Discussion
Discussion
P
a
per
|
Discus
sion
P
a
per
|
Discussion
P
a
per
|
Discussion
P
a
per
|
Abstract
We assess the potential of the water-soluble fraction of atmospheric fine aerosols in the southeastern US to generate reactive oxygen species (ROS) and identify major ROS-associated emission sources. ROS-generation potential of particles was quantified by the dithiothreitol (DTT) assay and involved analysis of fine particulate matter (PM)
ex-5
tracted from high-volume quartz filters (23 h integrated samples) collected at various sites in different environmental settings in the southeast, including three urban Atlanta sites, in addition to a rural site. Paired sampling was conducted with one fixed site in Atlanta (Jefferson Street), representative of the urban environment, with the others ro-tating among different sites, for∼250 days between June 2012 and September 2013 10
(N=483). A simple linear regression between the DTT activity and aerosol chemical components revealed strong associations between PM ROS generation potential and secondary organic aerosol (WSOC) in summer, and biomass burning markers in winter. Redox-active metals were also correlated with the DTT activity, but mostly at urban and roadside sites. Positive matrix factorization (PMF) was applied to apportion the relative
15
contribution of various sources to the ROS generation potential of water-soluble PM2.5 in urban Atlanta. PMF showed that vehicular emissions contribute uniformly throughout the year (12 to 25 %), while secondary oxidation processes dominated the DTT activity in summer (46 %) and biomass burning in winter (47 %). Mineral dust was significant only during drier periods (∼12 % in summer and fall). Source apportionment by
chem-20
ical mass balance (CMB) was reasonably consistent with PMF, but with higher contri-bution from vehicular emissions (32 %). Given the spatially large data set of PM sam-pled over an extended period, the study reconciles the results from previous work that showed only region- or season-specific aerosol components or sources contributing to PM ROS activity, possibly due to smaller sample sizes. Our results indicate that the
abil-25
ACPD
14, 19625–19672, 2014Reactive oxygen species associated
with water-soluble PM2.5
V. Verma et al.
Title Page
Abstract Introduction
Conclusions References
Tables Figures
◭ ◮
◭ ◮
Back Close
Full Screen / Esc
Printer-friendly Version
Interactive Discussion
Discussion
P
a
per
|
Discus
sion
P
a
per
|
Discussion
P
a
per
|
Discussion
P
a
per
|
property of ambient particulate matter suggests widespread population exposures to aerosol components that have the ability to catalyze the production of oxidants in vivo.
1 Introduction
Substantial research has been dedicated to understand the mechanisms by which am-bient particulate matter (PM) causes adverse health effects in humans (Hoek et al.,
5
2002; Samet et al., 2000; Gauderman et al., 2007; Stayner et al., 1998; Riediker et al., 2004; Sun et al., 1984; Sagai et al., 1993; Donaldson et al., 1996, 1997, 2003; Li et al., 2003, 2009a; Delfino et al., 2013). In many of these studies, a large number of PM health effects have been attributed to the oxidative or oxidant generating properties of ambient particles (Donaldson et al., 1996, 2003; Li et al., 2003, 2009a; Delfino et al.,
10
2013). It has been hypothesized that several oxidative mechanisms can arise simulta-neously, leading to a cascade of events that results in high concentrations of reactive oxygen species (ROS) in vivo (Tao et al., 2003; Castro and Freeman, 2001; Donaldson et al., 2003). ROS concentrations in excess of the anti-oxidant capacity to neutralize them leads to oxidizing other cellular components, which eventually translates into
nu-15
merous health outcomes (Delfino et al., 2005; Li et al., 2009a; Peters et al., 2006). Based on this possible mechanistic route linking aerosol chemistry to health, nu-merous studies have been initiated in the past several years focused on measuring the oxidative properties of ambient particles. A variety of probes have been developed to quantify different aspects of PM induced oxidative stress. These include chemical
20
systems that mimic the loss of antioxidants, such as oxidation of dithiothreitol (DTT assay, Cho et al., 2005), glutathione (GSH, Godri et al., 2011), and ascorbic acid (AA, DiStefano et al., 2009; Mudway et al., 2004), covalent bonding with glyceraldehyde-3-phosphate dehydrogenase (GAPDH, Rodrigueza et al., 2005), and hydroxyl radical generation in the presence of H2O2 (Shi et al., 2003). Other probes measure cellular 25
ACPD
14, 19625–19672, 2014Reactive oxygen species associated
with water-soluble PM2.5
V. Verma et al.
Title Page
Abstract Introduction
Conclusions References
Tables Figures
◭ ◮
◭ ◮
Back Close
Full Screen / Esc
Printer-friendly Version
Interactive Discussion
Discussion
P
a
per
|
Discus
sion
P
a
per
|
Discussion
P
a
per
|
Discussion
P
a
per
|
expression (Li et al., 2003), and cytokine activation (Wilson et al., 2010). Each of these assays represents a plausible mode of PM toxicity and collectively they should be con-sidered as the toolkit for deconstructing the complex mechanisms of PM ROS gener-ation. One advantage of these assays, is that they are integrative of various aerosol chemical properties, and as pointed out by several researchers (Ayres et al., 2008;
5
Venkatachari and Hopke, 2008; Kuenzli et al., 2004), many of them can serve as a screening step for assessing the PM samples/emission scenarios for more detailed chemical analysis and downstream health studies.
The DTT assay was devised to simulate the in-vivo generation of superoxide radicals, wherein DTT was used as a surrogate of the biological reducing agents (NADH and
10
NADPH) (Kumagai et al., 1997, 2002). When incubated at 37◦C with a test PM sam-ple, a decreasing DTT concentration over time is inferred as a measure of the ROS generating capability of the particles. A number of pure chemicals have been found to be associated with the response of this assay, e.g. quinones have been known to catalyze the transfer of electrons from DTT to oxygen (Kumagai et al., 2002). In a
re-15
cent study, certain transition metals (e.g. Fe, Cu and Mn) have also been shown to be active in this assay (Charrier and Anastasio, 2012). However, evidences showing that any of these chemicals play a significant role in the DTT activity of ambient PM are sparse and limited in terms of their analytical efficacy. The major components of the ambient PM identified so far to be associated with the DTT activity are often bulk
20
groups of species such as organic carbon (OC, both water-soluble (WSOC) and insol-uble, WIOC) and water-soluble HULIS (Humic-like-substances) compounds (a class of WSOC characterized by strong hydrophobicity). However, most of these associa-tions have been inferred based on statistical correlaassocia-tions (Ntziachristos et al., 2007; Verma et al., 2009a, b; Hu et al., 2008; Biswas et al., 2009b), which do not necessarily
25
ACPD
14, 19625–19672, 2014Reactive oxygen species associated
with water-soluble PM2.5
V. Verma et al.
Title Page
Abstract Introduction
Conclusions References
Tables Figures
◭ ◮
◭ ◮
Back Close
Full Screen / Esc
Printer-friendly Version
Interactive Discussion
Discussion
P
a
per
|
Discus
sion
P
a
per
|
Discussion
P
a
per
|
Discussion
P
a
per
|
Both approaches have merits, however, a major concern with the studies solely based on regression analysis of DTT activity vs. chemical components is related to the sample size (N); most are based on N <30 with very few exceeding 100 (e.g. Delfino et al., 2013; N=111), which limits the statistical significance of the inferred associations. This is partly due to analytical complexity of the DTT assay, which entails
5
a laborious and time intensive protocol. To address this problem, we developed a semi-automated instrument involving minimal manual operation. The instrument, which has been described in detail in Fang et al. (2014), allowed us to conduct the DTT assay on a large number of aqueous samples (∼1200) as part of the Southeastern Center for
Air Pollution and Epidemiology (SCAPE) study.
10
SCAPE is a collaborative center – combining five multi-disciplinary studies from Georgia Tech and Emory University, aimed at achieving a better understanding of the ambient PM health effects. Along with describing the automated DTT analytical method in our previous paper from the Center studies, Fang et al. (2014) showed that the DTT activity of ambient fine aerosols collected from various sites and seasons in the
south-15
east US is generally correlated with PM mass, however the strength of the correlation varied (R2=0.40–0.90) among different sites and seasons. Here we discuss the de-tailed spatial and temporal profiles of the PM ROS generation potential measured by the DTT assay on these samples. The bulk and specific chemical components, i.e. OC, elemental carbon (EC), WSOC, inorganic ions, water-soluble brown carbon (BrnC),
20
and various water-soluble transition metals, were also measured. Both univariate lin-ear regression and receptor modeling techniques were used to identify and apportion the contribution of major emission sources to the ROS generating potential of ambi-ent particles in the southeastern US. This analysis focuses only on the water-soluble extracts from filter samples, while other reports will present results involving
water-25
ACPD
14, 19625–19672, 2014Reactive oxygen species associated
with water-soluble PM2.5
V. Verma et al.
Title Page
Abstract Introduction
Conclusions References
Tables Figures
◭ ◮
◭ ◮
Back Close
Full Screen / Esc
Printer-friendly Version
Interactive Discussion
Discussion
P
a
per
|
Discus
sion
P
a
per
|
Discussion
P
a
per
|
Discussion
P
a
per
|
explain some of the differences reported previously on the association of DTT activ-ity with chemical components in studies based on smaller sample sizes and provides a broader regional view of fine particle ROS characteristics.
2 Experimental methods
2.1 Sampling plan
5
The sampling plan for SCAPE involved paired simultaneous measurements using two instrumented sites, one of which was fixed at the Jefferson Street SEARCH (Southeast-ern Aerosol Research and Characterization) site (Edgerton et al., 2005, 2006; Hansen et al., 2003), the other was rotated among three different satellite sites, i.e. Yorkville, Roadside Atlanta, and Georgia Tech, all in Georgia. The sampling covered the period
10
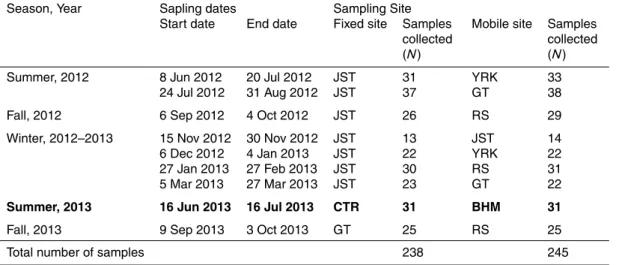
from June 2012 to September 2013; details of the sampling dates at each site are pro-vided in Table 1. Each paired deployment lasted roughly one month, and was repeated in different seasons. Based on the temperature profile in Atlanta during the sampling period, shown in Supplement Fig. S1, data are classified into three seasons – summer (June–August 2012), fall (September 2012 and 2013), and winter (November 2012–
15
March 2013). To provide a broader perspective, additional measurements (summer, June–July 2013) were made in Alabama, at the SEARCH rural-urban pair; Centreville (rural) and Birmingham (urban).
2.2 Sampling sites
A map showing the locations of all sites is shown in Fig. 1. Jefferson Street is located
20
roughly 4 km northwest of downtown Atlanta and is representative of urban-Atlanta. The site is surrounded by commercial and residential buildings, with nearby street traf-fic patterns consistent with a mixed-use urban environment. The site has extensively been used in past studies characterizing urban Atlanta air quality (Hansen et al., 2006; Marmur et al., 2005) and the data used in epidemiological studies (Sarnat et al., 2008;
ACPD
14, 19625–19672, 2014Reactive oxygen species associated
with water-soluble PM2.5
V. Verma et al.
Title Page
Abstract Introduction
Conclusions References
Tables Figures
◭ ◮
◭ ◮
Back Close
Full Screen / Esc
Printer-friendly Version
Interactive Discussion
Discussion
P
a
per
|
Discus
sion
P
a
per
|
Discussion
P
a
per
|
Discussion
P
a
per
|
Strickland et al., 2010). In this study, Jefferson Street is again used as representative of urban Atlanta, to which the other three satellite measurements (discussed next) are compared.
The Roadside site is located on the Georgia Tech campus adjacent (i.e., within a few meters) to the interstate highway I-75/85. The degree to which the site is under direct
5
influence of emissions from approximately 280 000 vehicles per day on a 14-lane free-way depends on wind direction and wind speed. The traffic fleet is mostly (97 %) light-duty gasoline vehicles. Slow-moving traffic is typical during the morning and evening rush-hour periods. Jefferson Street is located roughly 2 km from this highway.
Georgia Tech site is situated between the Roadside and Jefferson Street sites on
10
the Ford Environment Sciences and Technology building top floor, ∼600 m from the
interstate. This site is an intermediate location between the Roadside (direct freeway emissions) and urban background (Jefferson Street) that could moderately be impacted by the roadway emissions.
Yorkville, also a SEARCH site, is located in a rural environment approximately 70 km
15
west of Atlanta, which is generally up-wind. The site is surrounded by agricultural land (e.g., pastures) and forests, with the nearest residences at least 1 km away. There are no major roadways in the vicinity of the site and nearby traffic emissions are negligible. As a contrast to Atlanta, measurements were also made in an additional southeast-ern US city. The urban Birmingham Alabama SEARCH site has several coking ovens
20
within 10 km and a cast iron pipe foundry located approximately 400 m east. The site also receives emissions from nearby (<4 km) freeways (I-65, US-31 and I-20).
Centreville is the SEARCH rural pair to Birmingham, located approximately 85 km south-southwest of Birmingham. The site is heavily wooded and is surrounded by the Talladega National Forest with a high density of oak and pine trees. Measurements
25
were conducted simultaneously at Birmingham and Centreville and overlapped with the Southern Oxidant and Aerosol Study (SOAS).
ACPD
14, 19625–19672, 2014Reactive oxygen species associated
with water-soluble PM2.5
V. Verma et al.
Title Page
Abstract Introduction
Conclusions References
Tables Figures
◭ ◮
◭ ◮
Back Close
Full Screen / Esc
Printer-friendly Version
Interactive Discussion
Discussion
P
a
per
|
Discus
sion
P
a
per
|
Discussion
P
a
per
|
Discussion
P
a
per
|
Birmingham and Centreville sites are referred to as JST, RS, GT, YRK, BHM and CTR respectively.
2.3 Filter collection and extraction protocol
A high-volume sampler (HiVol, Thermo Anderson, non-denuded, nominal flow rate 1.13 m3min−1, PM2.5impactor) was setup at each site and fine particles were collected
5
onto pre-baked 8×10′′quartz filters (Pallflex®Tissuquartz™, Pall Life Sciences). 23 h integrated samples (12:00 noon–11:00 a.m. next day) were collected daily during the sampling periods (Table 1) at each site, along with periodic field blanks (at least 3 per site per month). The number of samples collected from each site, approximately 30 per site per season (total=483) is given in Table 1. After collection, the filters were
10
wrapped in pre-baked aluminum foil and immediately stored in a freezer (−18◦C). Prior to the chemical and oxidative potential analysis, the filters were cut using a 1′′diameter metallic punch. For the DTT activity, WSOC and BrnC analysis, three filter sections (1′′ diameter each) were extracted in 15 mL of deionized water (DI, Milli-Q; >18 MΩ) via sonication in a water bath for 30 min, while additional punches were extracted
sepa-15
rately in the same manner (15 mL of DI for 30 min of sonication time) for the metals (4 punches) and inorganic ions (1 punch) analysis. These extracts were then filtered using PTFE 0.45 µm pore syringe filters (Fisher brand). The filtered extracts for met-als were acidified by adding nitric acid (high purity trace metal grade; 2 % w/v final solution), consistent with current protocols (Henshaw et al., 1989; Talbot et al., 1994).
20
2.4 Online instruments
PM2.5mass concentrations were monitored by a tapered element oscillating
microbal-ance (Thermo Scientific TEOM 1400a), operating continuously at JST, BHM, YRK and CTR throughout the sampling period (Atmospheric Research Analysis Inc. data). At other sites (RS and GT), summed concentrations from measured chemical
compo-25
ACPD
14, 19625–19672, 2014Reactive oxygen species associated
with water-soluble PM2.5
V. Verma et al.
Title Page
Abstract Introduction
Conclusions References
Tables Figures
◭ ◮
◭ ◮
Back Close
Full Screen / Esc
Printer-friendly Version
Interactive Discussion
Discussion
P
a
per
|
Discus
sion
P
a
per
|
Discussion
P
a
per
|
Discussion
P
a
per
|
concentrations. This method has been found to agree well with the TEOM concentra-tions at JST and YRK sites, where co-located measurements were available (Fang et al., 2014).
2.5 Chemical analysis on PM filters
Water soluble organic carbon (WSOC) and the WSOC light absorption properties
5
(Brown Carbon, BrnC, used as a source tracer) were measured on HiVol extracts via an automated system using an autosampler (Dionex 40AS), spectrophotometer and total organic carbon (TOC) analyzer. BrnC was measured on an aliquot (300 µL) of the ex-tracts via a liquid waveguide capillary cell (LWCC-2100, World Precision Instruments, Sarasota, FL), which was coupled to a UV/VIS spectrophotometer (USB4000
spec-10
trometer, Ocean Optics, Dunedin, FL) (Hecobian et al., 2010). Following the waveg-uide, the aliquot was conducted to a Sievers TOC analyzer (Model 900, GE Analytical Instruments; Boulder, CO) for determination of WSOC concentration.
The automated system was also used to measure water-soluble metals, which in-volved nebulizing the water extracts and directing the aerosol stream to an XRF (X-ray
15
fluorescence) instrument (Xact™ 625 Monitoring System), capable of online measure-ments of a range of elemeasure-ments. Details of the nebulizer-XRF system would be pub-lished in a subsequent publication. Briefly, 5 mL of the acidified PM water-extracts was aerosolized using a continuous flow ultrasonic nebulizer (CETAC, U5000 AT+). The resulting fine aerosol was conducted by a flow of clean filtered air through a drying
sys-20
tem (a 136◦C heated section followed by a cooled section at−5◦C). The dried aerosol
stream was neutralized by a Kr-85 source and mixed with clean filtered (Pall HEPA Capsule, Part No. 12144) air to obtain the instrument sample flow rate of 16.7 L min−1. A wide range of elements were measured by the instrument, however we present only the relevant species which are either used as specific emission markers (Ca, dust; Coz
25
ACPD
14, 19625–19672, 2014Reactive oxygen species associated
with water-soluble PM2.5
V. Verma et al.
Title Page
Abstract Introduction
Conclusions References
Tables Figures
◭ ◮
◭ ◮
Back Close
Full Screen / Esc
Printer-friendly Version
Interactive Discussion
Discussion
P
a
per
|
Discus
sion
P
a
per
|
Discussion
P
a
per
|
Discussion
P
a
per
|
Elemental and organic carbon content of the PM was measured on a small sec-tion (1.45 cm2) of the HiVol filters using a thermal/optical transmittance (TOT) analyzer (Sunset Laboratory) by NIOSH (The National Institute for Occupational Safety and Health) method (Birch and Cary, 1996). For the measurement of inorganic ions (SO−42, NH+4, etc.) at JST and GT, ion-chromatography (IC) (LC30 chromatography oven, and
5
Dionex CD20 conductivity detector, with IonPac® CS12A carboxylate-functionalized cation-exchange and IonPac®AS12A carbonate eluent anion-exchange columns) was performed on the aerosol extracts of HiVol filters collected from those sites.
2.6 ROS generation potential measurement
ROS generation potential of the ambient aerosols was measured by a semi-automated
10
instrument (Fang et al., 2014) for measuring DTT activity of the PM extracts obtained from HiVol filters. The method is conceptually identical to the manual procedure de-scribed by Cho et al. (2005). The initial DTT concentration was 100 µM and loss of DTT in the reaction vial at several time steps (0, 4, 13, 23, 32 and 41 min) was monitored and used to calculate the DTT consumption rate based on the linear regression slope. The
15
automated method provided a measurement of the DTT activity at a rate of 1 sample per hour. For each batch (consisting of either 7 or 14 samples), at least one field blank and one standard (9,10-Phenanthraquinone used as a positive control) were analyzed. Both blanks and standards were fairly consistent, with an average slope±standard de-viation of 0.38±0.10 (N=45) and 1.27±0.19 (N=55) nmol DTT min−1, respectively.
20
The automated system was cleaned periodically (generally after every 15 days, or un-less the slope of DTT reaction rate started to become non-linear) by rinsing thoroughly with methanol (at least 3 times) followed by DI (at least 6 times).
2.7 Source apportionment analysis
The emission sources contributing to ROS generation potential of the particles were
25
ACPD
14, 19625–19672, 2014Reactive oxygen species associated
with water-soluble PM2.5
V. Verma et al.
Title Page
Abstract Introduction
Conclusions References
Tables Figures
◭ ◮
◭ ◮
Back Close
Full Screen / Esc
Printer-friendly Version
Interactive Discussion
Discussion
P
a
per
|
Discus
sion
P
a
per
|
Discussion
P
a
per
|
Discussion
P
a
per
|
these studies, a simple linear regression was conducted between the measured con-centrations of various chemical components and DTT activity for each individual site and season. A rough indication of ROS sources was obtained based on the correla-tions between DTT activity and various species, and associating those species with sources. The large dataset from the combined JST and GT sites, which are
represen-5
tative of urban Atlanta air quality, allows a more quantitative source apportionment. Two receptor models were used - positive matrix factorization (EPA-PMF, version 3.0) and chemical mass balance (EPA-CMB, version 8.2).
Detailed description and procedural details of PMF are described elsewhere (Paatero, 1997; Norris and Vedantham, 2008). In the present PMF analysis, WSOC,
10
BrnC, NH+4, SO−42, and EC were classified as strong (high signal-to-noise ratio; S / N) species, while metals K, Ca, Mn, Fe, Cu and Zn were categorized as weak (low S / N). DTT activity was chosen as the “total variable” and thus by default assigned as weak species. Missing values in the data were replaced by the species median. For the base runs (N=20), a seed of 25 was chosen and the model was executed for 4, 5 and 6
15
number of factors. The converged run with the highest goodness-of-fit parameter (low-est object function) was selected for five factors, which are identified as secondary WSOC, secondary SO−42, vehicular emissions, mineral dust and biomass burning.
In the CMB approach (Coulter, 2004), source contributions to PM2.5at JST were first
determined and then the sources most associated with DTT activity were identified
20
through correlations. The model was run using eight yearly average source profiles, which were derived from JST in a previous study (Marmur et al., 2005). Profiles in-cluded primary sources from gasoline vehicles (LDGV), diesel vehicles (HDDV), soil dust (SDUST), biomass burning (BURN), and coal fired power plants (CFPP). Sec-ondary source profiles included ammonium sulfate (AMSULF), ammonium bisulfate
25
ACPD
14, 19625–19672, 2014Reactive oxygen species associated
with water-soluble PM2.5
V. Verma et al.
Title Page
Abstract Introduction
Conclusions References
Tables Figures
◭ ◮
◭ ◮
Back Close
Full Screen / Esc
Printer-friendly Version
Interactive Discussion
Discussion
P
a
per
|
Discus
sion
P
a
per
|
Discussion
P
a
per
|
Discussion
P
a
per
|
then related to these CMB-identified PM2.5 source contributions through a stepwise regression analysis using Akaike Information Criterion (AIC) approach (Akaike, 1974), with DTT activity as the dependent variable and sources contributions as the indepen-dent variables. Note, the source profiles used total metals, whereas the fitting data were water-soluble metals; however, using total metals data from the SEARCH data
5
archive for the sampling period showed little effect on the final DTT source apportion-ment. More detailed analysis based on the improved source profiles recently developed by an ensemble approach (Balachandran et al., 2014) is underway and here we only present the study average results from CMB to compare and validate the PMF analysis. Data from YRK, RS and Alabama sites (CTR and BHM), were not included in PMF
10
and CMB as they represent more extreme and generally different conditions than JST and GT, the sites representative of urban Atlanta. These other sites also had insufficient data for their own source apportionment analyses.
3 Results and discussion
3.1 PM emission characteristics
15
3.1.1 Elemental, water-soluble organic and brown carbon (EC, WSOC, BrnC)
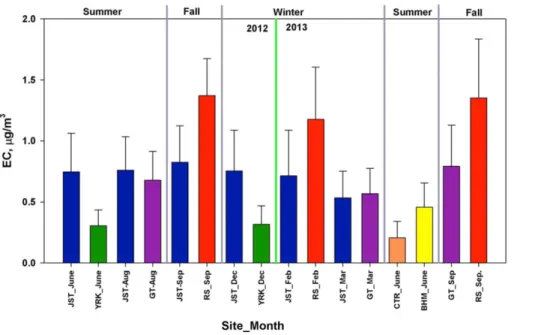
Figure 2a–c shows the ambient concentrations of EC, WSOC and BrnC at all sites for different months of sampling. EC and WSOC are discussed first since they rep-resent the diverse PM emissions characteristics at these sites, followed by BrnC. EC is a marker for incomplete combustion, such as vehicular emissions (Schauer, 2003),
20
ACPD
14, 19625–19672, 2014Reactive oxygen species associated
with water-soluble PM2.5
V. Verma et al.
Title Page
Abstract Introduction
Conclusions References
Tables Figures
◭ ◮
◭ ◮
Back Close
Full Screen / Esc
Printer-friendly Version
Interactive Discussion
Discussion
P
a
per
|
Discus
sion
P
a
per
|
Discussion
P
a
per
|
Discussion
P
a
per
|
The monthly average concentrations of EC (Fig. 2a) are consistent with primary ve-hicular emissions being the dominant EC source; the concentrations are highly hetero-geneous. Large concentration differences were observed for each pair, with highest EC at the RS, followed by urban background sites (JST, GT, and BHM), and lowest concen-trations at the rural sites (YRK and CTR). The JST-GT EC concenconcen-trations were similar,
5
suggesting that GT is not highly influenced by the roadway emissions, and so more representative of EC levels in the metro area, similar to JST. The largest contrast in EC among paired measurements is between urban and rural sites. For both summer and winter seasons, EC is more than double at the urban sites (JST and BHM) compared to their respective paired rural components (YRK and CTR) (mean±standard deviation 10
(1σ) of ratio=2.9±1.6 in summer, and 2.7±0.9 in winter for JST/YRK, and 2.92±1.42
for BHM/CTR). The RS site has the highest concentration of EC in both fall and winter seasons (RS/JST=1.81±0.67 in fall, and 1.9±0.8 in winter, and RS/GT=1.95±0.5
in fall).
There is little seasonal variation in the EC levels across most sites. For
ex-15
ample, the average EC concentrations at JST in summer (0.75±0.25 µg m−3),
fall (0.82±0.30 µg m−3), and winter (0.67±0.33 µg m−3) were similar. The mean
EC concentration at RS was slightly lower in winter (1.18±0.43 µg m−3) than fall (1.37±0.30 µg m−3 in September 2012 and 1.45±0.34 µg m−3 in September 2013).
The marginally lower levels of EC in winter seasons in Atlanta (JST, GT and RS sites)
20
might be attributed to higher rainfall during these periods (December–March; Supple-ment Fig. S1). Precipitation scavenging could have superseded the effect of generally reduced mixing height in winter on primary aerosol concentrations.
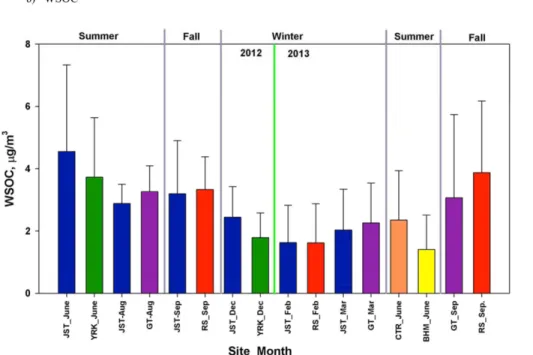
Unlike EC, WSOC was more spatially uniform, but varied substantially between dif-ferent seasons. WSOC concentrations at the paired sites were very similar indicating
25
ACPD
14, 19625–19672, 2014Reactive oxygen species associated
with water-soluble PM2.5
V. Verma et al.
Title Page
Abstract Introduction
Conclusions References
Tables Figures
◭ ◮
◭ ◮
Back Close
Full Screen / Esc
Printer-friendly Version
Interactive Discussion
Discussion
P
a
per
|
Discus
sion
P
a
per
|
Discussion
P
a
per
|
Discussion
P
a
per
|
summertime SOA than wintertime biomass burning on WSOC in the region is appar-ent from a gradually decreasing averaged concappar-entration profile at JST from summer to winter (3.8±2.2 µg m−3, 3.2±1.7 µg m−3 and 2.0±1.1 µg m−3 in summer, fall and winter). Similar decreases are also noted at other sites (3.7±1.9 µg m−3 in summer
to 1.8±0.8 µg m−3 in winter at YRK, and 3.3±1.1 µg m−3and 3.9±2.3 µg m−3 in fall,
5
2012 and 2013, respectively to 1.6±1.3 µg m−3 in winter, 2013 at RS). These results are consistent with a more detailed analysis of the WSOC spatial and seasonal distri-bution conducted two years before in the southeast US (Zhang et al., 2010).
BrnC denotes the water-soluble organic compounds that absorb light in the UV-region of the UV-Vis spectrum (Hecobian et al., 2010). Biomass burning is by far the
10
largest source of these compounds with additional contributions from vehicular sources and possibly aged SOA (Hecobian et al., 2010; Zhang et al., 2011). The spatial pro-file of BrnC (Fig. 2c) is intermediate between EC (heterogeneous) and WSOC (ho-mogeneous), indicating the diversity of its sources. The moderate impact of vehicular emissions on BrnC is probably reflected in generally higher concentrations of BrnC
15
at RS and other urban sites (JST, GT, BHM) than rural (CTR, YRK). However, the strong seasonality is evident from its extreme values in winter periods resulting from biomass burning (average levels at JST in winter=0.97±0.78 M m−1, compared to 0.42±0.25 M m−1in summer and 0.53±0.33 M m−1in fall).
3.1.2 Water-soluble metals
20
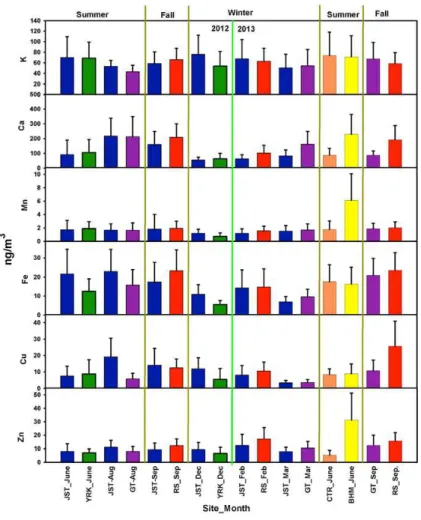
The selected elements (Fig. 3), have a wide range of concentrations at various sites and differing seasonal trends, pointing to heterogeneous sources. A more in-depth dis-cussion on the distribution of the measured water-soluble elements will follow in a sub-sequent publication, here we only briefly discuss the major trends in selected metals. BHM, a site heavily impacted by industrial emissions, has very high concentrations of
25
ACPD
14, 19625–19672, 2014Reactive oxygen species associated
with water-soluble PM2.5
V. Verma et al.
Title Page
Abstract Introduction
Conclusions References
Tables Figures
◭ ◮
◭ ◮
Back Close
Full Screen / Esc
Printer-friendly Version
Interactive Discussion
Discussion
P
a
per
|
Discus
sion
P
a
per
|
Discussion
P
a
per
|
Discussion
P
a
per
|
Rural sites, YRK and CTR, have generally lower metals concentrations, while GT and JST levels are moderate.
Higher rainfall in winter compared to summer months could also affect the metals concentrations since the re-entrainment of mineral dust, which is a major source of metals, is most effective in dry periods. The metals of predominantly crustal and
ve-5
hicular origin (e.g. Ca, Fe, Mn and Cu) are generally higher in summer and fall com-pared to the winter. For example, the average Ca concentration at JST was 155±116,
160±87, and 67±37 ng m−3in summer, fall, and winter, respectively. Exceptions are K and Zn, which despite being associated with crustal dust (K; Coz et al., 2010) or vehic-ular sources (Zn; Liu et al., 2008) are also emitted in biomass burning (Echalar et al.,
10
1995), which could account for a weaker seasonal variability due to multiple sources; average K concentration is 62±25, 59±22 and 65±32 ng m−3in summer, fall and win-ter, while the respective Zn concentration is 9.6±4.7, 9.3±4.8 and 9.9±5.8 ng m−3at
JST.
3.2 PM ROS generation potential
15
Temporal and spatial differences in the water-soluble DTT activity are discussed to provide an overview of the PM ROS generation potential in Southeastern US.
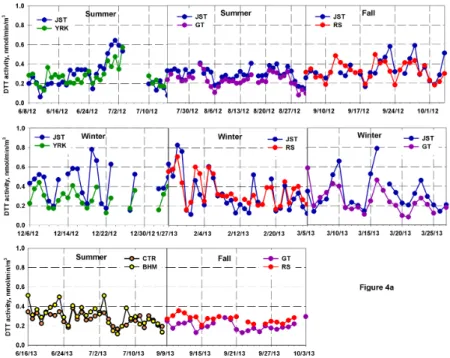
Time series of daily average DTT activity from the sites in different months is shown in Fig. 4a and b. The rate of consumption of DTT is normalized by both the volume of sampled air (DTTv; expressed in units of nmol min−1m−3, Fig. 4a) and the particulate
20
mass (DTTm; expressed in units of nmol min−1µg−1, Fig. 4b). While volume normalized activity is a function of strength of the emission source, and thus an extrinsic property, mass normalized levels represent an intrinsic property of PM, independent of its mass concentration and a characteristic of the specific source.
Our measurements of both volume and mass normalized DTT activity are generally
25
ACPD
14, 19625–19672, 2014Reactive oxygen species associated
with water-soluble PM2.5
V. Verma et al.
Title Page
Abstract Introduction
Conclusions References
Tables Figures
◭ ◮
◭ ◮
Back Close
Full Screen / Esc
Printer-friendly Version
Interactive Discussion
Discussion
P
a
per
|
Discus
sion
P
a
per
|
Discussion
P
a
per
|
Discussion
P
a
per
|
activity of ambient PM is spatially uniform. There is no consistent and substantial dif-ference in DTT activity of ambient PM at the two sites for any paired measurement, except the JST-YRK pair in winter [DTTv(YRK)<DTTv(JST)] and GT-RS pair in fall [DTTm(RS)>DTTm(GT)]. Intrinsic DTT activity is fairly uniform even on day-to-day scales for most sites, suggesting that the sources of ROS-associated aerosol
com-5
ponents don’t change rapidly. There is, however, a substantial daily variability in the extrinsic activity, which reflects variations in emissions, dispersion and sinks, factors that also control overall PM mass concentrations.
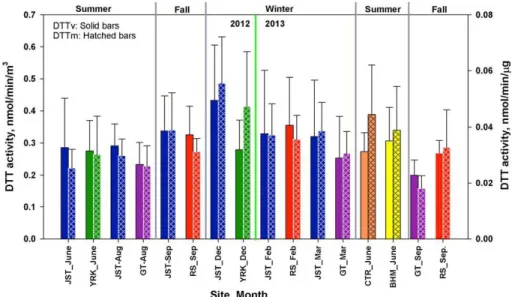
A summary of the spatial and seasonal trends in mean DTT activity (both DTTv and DTTm) for the individual sampling periods and at various sites is shown in Fig. 5. A
sig-10
nificant seasonal variability in both the volume and mass normalized DTT activity is ev-ident; the levels are generally higher in the colder months than summer. A one-sample t-test showed that the DTTv at JST in December was significantly (p≤0.05) higher
from that in June–July (51±34 %), August (48±22 %), and September (27±14 %).
These results are in agreement with a recent study conducted in the Los Angeles
15
Basin, which showed a generally higher DTT activity (both mass and volume normal-ized) of quasi-ultrafine particles in cooler months compared to warmer periods (Saffari et al., 2014). The authors in that study attributed the higher DTT activity to an ele-vated concentration of redox-active semi-volatile organic compounds (SVOC) caused by their enhanced partitioning to the particulate phase and the lowered atmospheric
20
mixing height in winter. Although, SVOC have been suggested to make a substantial contribution to the DTT activity of ultrafine particles (Verma et al., 2011), the PM2.5
samples collected via HiVol filters in our study are not expected to contain a signifi-cant fraction of these species due to losses associated with large flow-rate and long sampling duration (Ashbaugh and Eldred, 2004).
25
ACPD
14, 19625–19672, 2014Reactive oxygen species associated
with water-soluble PM2.5
V. Verma et al.
Title Page
Abstract Introduction
Conclusions References
Tables Figures
◭ ◮
◭ ◮
Back Close
Full Screen / Esc
Printer-friendly Version
Interactive Discussion
Discussion
P
a
per
|
Discus
sion
P
a
per
|
Discussion
P
a
per
|
Discussion
P
a
per
|
winter were observed at other sites too (38±13 % at GT from average of
Au-gust 2012 and September 2013, and 53±24 % at YRK), but not at RS, where av-erage fall level (0.032±0.009 nmol min−1µg−1) was nearly the same as in winter (0.036±0.008 nmol min−1µg−1).
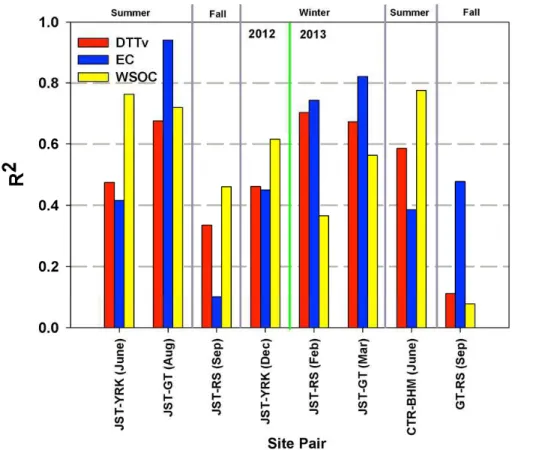
To further assess the spatiotemporal variability in DTTv activity in the region,
corre-5
lation coefficients (R2) were calculated for all of the site pairs and are shown in Fig. 6. To put the DTT activity comparison in a larger context, we have also included the corresponding coefficients for EC and WSOC. A high spatial correlation for a species indicates it has more spatially uniform emission sources in the region, on the scale of distances between the paired sites.
10
The site pair JST-GT shows high correlation coefficients (R2>0.5) for many PM species (DTT, EC and WSOC), which was expected given their spatial proximity and absence of nearby strong sources, e.g., roadways. The other site pairs show disparate patterns for the different PM species depending upon their sources. For example, EC has relatively low correlation coefficients for the urban-rural site pairs, i.e. JST-YRK in
15
both summer (R2=0.42) and winter (0.45), and BHM-CTR (R2=0.39), as expected. Despite relatively close proximity, the low correlation in fall for JST-RS pair (R2=0.10) and GT-RS pair (R2=0.48) for EC is due to the strong influence of freeway emissions (I-85) at the RS site. However, the JST-RS correlation is high in February (R2=0.74), possibly suggesting some contributions from a common source of EC, such as biomass
20
burning.
WSOC on the other hand exhibits high correlations for most site pairs (JST-YRK, JST-GT, CTR-BHM;R2>0.5) in all seasons. The correlations are generally higher in summer (R2>0.70), indicating a more regional influence of SOA formation as a source of WSOC in summertime, compared to biomass burning in winter (R2<0.65). The
25
correlations are generally weaker for the pairs involving RS (R2=0.08–0.46), probably due to the added contribution of freeway emissions to WSOC.
ACPD
14, 19625–19672, 2014Reactive oxygen species associated
with water-soluble PM2.5
V. Verma et al.
Title Page
Abstract Introduction
Conclusions References
Tables Figures
◭ ◮
◭ ◮
Back Close
Full Screen / Esc
Printer-friendly Version
Interactive Discussion
Discussion
P
a
per
|
Discus
sion
P
a
per
|
Discussion
P
a
per
|
Discussion
P
a
per
|
proximity (R2= 0.68 and 0.67 for JST-GT in fall and winter, respectively). Similarly, in summer when the correlations for WSOC are very high even for the far-apart sites (JST-YRK and CTR-BHM), correlations for DTT are only moderate (R2=0.47 and 0.59). It appears that DTT activity is impacted by both regional sources and local emissions associated with individual site characteristics. The role of various emission sources
5
in the DTT activity of ambient PM in different seasons and sites is the major point of discussion in the next section and also the subsequent papers from this study.
3.3 Sources of PM ROS generation potential
Sources of ROS generation potential were identified and apportioned using combina-tion of linear regression, factor analysis and chemical mass balance techniques as
10
described below.
3.3.1 Linear regression of DTT activity with PM chemical composition
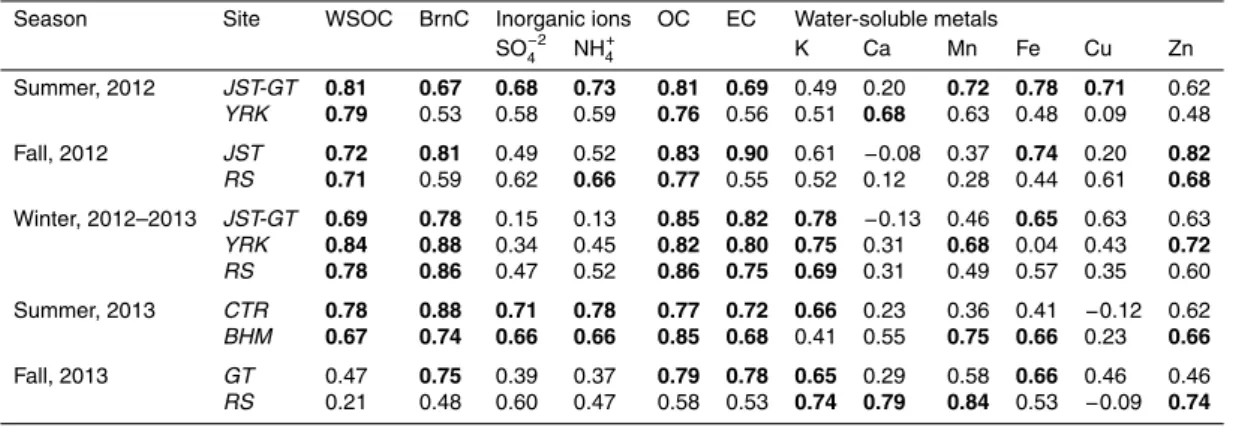
Pearson’s correlation coefficients for the linear regression between DTT activity and the measured chemical components were calculated for each site and season and are shown in Table 2. Considering the limited daily variability in mass normalized DTT
ac-15
tivity at most sites in a given season, the regression was conducted on the volume nor-malized levels of DTT activity (nmol min−1m−3) and chemical components (µg m−3). To consolidate the data for convenience, individual time-series at JST and GT sites from June-to-August were merged (named “JST-GT Summer”), given their similar concentra-tion profiles. Similarly, JST and GT time series from December to March were merged
20
as “JST-GT winter”. The complete regression matrix showing the correlation between all pairs of selected species, for each site and season, is provided in the Supplement (Table S1).
DTT activity is almost always correlated with OC in the present study. OC results from all major sources in the region (e.g. vehicular emissions, SOA, and biomass
burn-25
ACPD
14, 19625–19672, 2014Reactive oxygen species associated
with water-soluble PM2.5
V. Verma et al.
Title Page
Abstract Introduction
Conclusions References
Tables Figures
◭ ◮
◭ ◮
Back Close
Full Screen / Esc
Printer-friendly Version
Interactive Discussion
Discussion
P
a
per
|
Discus
sion
P
a
per
|
Discussion
P
a
per
|
Discussion
P
a
per
|
Thus, the strong correlation of OC underlines the general contribution of PM organic compounds in the ROS generation potential, and also likely accounts for the DTT cor-relation with PM mass, as reported in Fang et al. (2014). However, it does not yield any novel information on the specific PM species or the emission sources associated with the DTT activity. Associations between water-soluble DTT activity and organic
com-5
pounds are consistent with a number of previous studies (Biswas et al., 2009a; Verma et al., 2012; Cho et al., 2005; Yang et al., 2014), but in contrast to other reports showing metals as the major drivers in this reaction (Charrier and Anastasio, 2012).
In summer, DTT activity is well correlated with WSOC at all sites; JST-GT (R=0.81), YRK (R=0.79), CTR (R=0.78) and BHM (R=0.67). Inorganic ions such as SO−42
10
and NH+4 are also correlated with WSOC and DTT activity (R >0.60 at most sites) indicating secondary photochemical formation as their common source in summer. This is consistent with the results of ambient (Verma et al., 2009a) and chamber studies (McWhinney et al., 2013; Li et al., 2009b) suggesting higher DTT activity of secondary organic compounds than their parent gases and primary particles.
15
In addition to WSOC, summertime DTT activity at urban sites, i.e. JST-GT and BHM, is also correlated with certain transition metals (Mn (R=0.72), Fe (0.78), and Cu (0.71) at JST-GT, and Mn (0.75), Fe (0.66) and Zn (0.66) at BHM). At BHM, the iron foundry and coke oven plants are the likely sources of these DTT-correlated metals. None of these metals are strongly correlated with any specific emission markers at JST-GT.
20
However, a moderate correlation of EC with DTT activity (R=0.69) and also some-what with metals (R=0.59, 0.75 and 0.58 for Mn, Fe, and Cu; Supplement Table S1), suggests that vehicular emissions could be one of their common source.
BrnC is also correlated with DTT activity in summer at JST-GT, CTR, and BHM sites (R >0.65). However, its correlation with both WSOC and EC (R >0.65 at all sites;
25
Table S1) does not allow isolating its predominant source. Both vehicular emissions and possibly aged SOA appear to contribute to these chromophores in summer.
ACPD
14, 19625–19672, 2014Reactive oxygen species associated
with water-soluble PM2.5
V. Verma et al.
Title Page
Abstract Introduction
Conclusions References
Tables Figures
◭ ◮
◭ ◮
Back Close
Full Screen / Esc
Printer-friendly Version
Interactive Discussion
Discussion
P
a
per
|
Discus
sion
P
a
per
|
Discussion
P
a
per
|
Discussion
P
a
per
|
(R=0.72), and EC (R=0.90) at JST. Metals such as Fe and Zn are also correlated with DTT activity (R=0.70 and 0.82) and EC (R=0.90 and 0.75) at JST. The stronger correlation of primary emissions (EC) than secondary species (WSOC, SO−42, NH+4) indicates a diminishing effect of photochemistry on the DTT activity. This is even more apparent in fall 2013, when the highest correlation of DTT at GT is with EC (R=0.78),
5
while the correlation with WSOC is low (R=0.47).
However, at the RS site, road-dust suspension also appears to be a significantly contributing factor to DTT activity in fall as indicated from the moderate to strong corre-lation (R=0.61–0.84) of certain metals including those from crustal sources (Cu and Zn in fall 2012, and K, Ca, Mn, and Zn in fall 2013). The added contribution from dust
10
probably dilutes the association of DTT activity with other emission sources. For ex-ample, DTT at RS is not as strongly correlated with EC (R≤0.55) or WSOC (R=0.71 and 0.21 in Fall, 2012 and 2013, respectively) as at JST and GT.
In winter months, DTT activity is again correlated with WSOC at all sites; JST-GT (R=0.69), YRK (R=0.84), and RS (R=0.78), however, this correlation is not
accom-15
panied by a similar correlation with inorganic ions (R <0.55 for SO−42 and NH+4) as in summer months. It implies that another emission source of WSOC – biomass burning, starts contributing more to the DTT activity in winter. This is further reflected in the strong correlation of BrnC and K with DTT activity and WSOC (R >0.65; Table 2 and Supplement Table S1) at all sites. In a study conducted in Los Angeles, the ambient
20
concentrations of K and WSOC were elevated (∼2×) during the 2007 Southern Califor-nia wildfires compared to the post-fire period (Verma et al., 2009b). More importantly, these wood-smoke particles were found to be at least two times more oxidative than the post-fire ambient PM2.5 typically dominated by vehicular emissions. The redox-active
WSOC emitted in the biomass burning particles probably explain the higher intrinsic
25
DTT activity of ambient PM in winter compared to other seasons in the present study (Figs. 4 and 5).
ACPD
14, 19625–19672, 2014Reactive oxygen species associated
with water-soluble PM2.5
V. Verma et al.
Title Page
Abstract Introduction
Conclusions References
Tables Figures
◭ ◮
◭ ◮
Back Close
Full Screen / Esc
Printer-friendly Version
Interactive Discussion
Discussion
P
a
per
|
Discus
sion
P
a
per
|
Discussion
P
a
per
|
Discussion
P
a
per
|
Supplement Table S1) somewhat confounds the contribution of vehicular sources with biomass burning to the DTT activity in winter. Although, EC/OC ratio for wood smoke can be very low (0.2–0.3, Harrison et al., 2012), it is possible that some fraction of EC at the sampling sites is also contributed by biomass burning in addition to the vehicular emissions. Transition metals are also correlated with DTT activity in winter months at
5
JST-GT ([Fe (R=0.65), Cu (R=0.63) and Zn (R=0.63)], and YRK [Mn (R=0.68), and Zn (R=0.72)]. However, the co-variability of major emission markers in winter (i.e. EC, WSOC, K and BrnC) makes it difficult to identify their dominant source(s) at these sites.
3.3.2 Source contributions to DTT activity
10
To provide a more quantitative assessment of the contribution of various sources to the fine particle oxidative properties in urban Atlanta, a PMF analysis was conducted using the DTT activity and measured chemical composition data. The five factors re-solved by PMF are shown in Fig. 7. Factors 1 and 2 are characterized with high WSOC and high inorganic ions (NH+4 and SO−42) loadings, respectively. Both of these factors
15
have higher relative contributions in summer and therefore are thought to be mostly associated with secondary oxidation processes, however a significant EC fraction in factor 1 suggests some contribution of vehicular emissions to SOA. The lack of WSOC loading in secondary factor 2 is curious. Previous PM2.5source apportionment studies
conducted in Southeast US (Zhang et al., 2012; Zhang et al., 2010) also showed a very
20
low but non-zero WSOC fraction in this PMF factor. The results suggest that multiple mechanisms are involved in the formation of secondary WSOC and SO−42. More de-tailed analysis of the specific components of SOA to DTT activity will be reported in the future. Here we assume that factor 2 is more representative of regional secondary aerosols, including some redox-active SOA, as there are no studies showing the DTT
25
activity associated with inorganic ions NH+4 and SO−42.
ACPD
14, 19625–19672, 2014Reactive oxygen species associated
with water-soluble PM2.5
V. Verma et al.
Title Page
Abstract Introduction
Conclusions References
Tables Figures
◭ ◮
◭ ◮
Back Close
Full Screen / Esc
Printer-friendly Version
Interactive Discussion
Discussion
P
a
per
|
Discus
sion
P
a
per
|
Discussion
P
a
per
|
Discussion
P
a
per
|
emissions. This factor is also most significant in summer and fall, which is consistent with Fig. 3 showing a generally lowered concentration of metals in winter. Factor 4 has a clear signature of biomass burning with very high concentrations of BrnC and K, and is prominent in winter. Lastly, the EC peak in factor 5 is a distinct feature suggesting it is linked to primary vehicular emissions. Also consistent with the vehicular sources,
5
this factor does not have an obvious seasonal pattern.
The time-series of reconstituted DTT activity resolved by the five PMF factors, along with the residuals (not predicted), and a distribution of these factors in each season, is shown in Fig. 8. In summer, secondary oxidation processes (WSOC (29 %)+SO−42 (17 %), factors 1 and 2) are the dominant contributors (46 %) to DTT activity, with
addi-10
tional contributions from biomass burning (24 %, factor 4) and vehicle emissions (19 %, factor 5). In fall, the contribution from secondary formation drops to 32 % (22 % associ-ated with WSOC and only 10 % with SO−42factors) with an increase in the contribution from vehicle emissions (25 %). Biomass burning dominates the ROS generation po-tential in winter, contributing 47 % to the DTT activity, while relatively low contribution
15
from secondary formation (20 %) and vehicle emissions (12 %) is observed. Mineral dust (factor 3), possibly including road-dust resuspension also makes a non-zero con-tribution to DTT activity, but is significant only in summer (13 %) and fall (11 %).
Relative loadings of individual species in various PMF factors, and the contributions of each of these factors to the DTT activity, could provide some insights on the specific
20
chemical components in an emission source driving the aerosol oxidative potential. For example, WSOC has been associated with the DTT activity in previous studies (Verma et al., 2012; Biswas et al., 2009a) and our results showing the substantial DTT activity associated with factor 1 (Figs. 7 and 8) support these findings. A few laboratory studies have also noted the capability of transition metals, particularly Fe, Cu and Mn to transfer
25
ACPD
14, 19625–19672, 2014Reactive oxygen species associated
with water-soluble PM2.5
V. Verma et al.
Title Page
Abstract Introduction
Conclusions References
Tables Figures
◭ ◮
◭ ◮
Back Close
Full Screen / Esc
Printer-friendly Version
Interactive Discussion
Discussion
P
a
per
|
Discus
sion
P
a
per
|
Discussion
P
a
per
|
Discussion
P
a
per
|
with WSOC components. The occurrence of trace amount of redox-active metals (Fe, Cu, Mn and Zn) in other factors (1, 2 and 5) might also be contributing to the DTT activity associated with those factors. It is noteworthy that at BHM and RS sites, where metals concentrations tend to be higher (Fig. 3), DTT activity is not significantly different from that of the corresponding paired site (CTR, JST and GT). Overall, these data do
5
not suggest that metals are the only dominant players in driving the DTT activity of water-soluble PM2.5 in the southeast, but they likely play an important role. This is addressed in a subsequent paper where multiple linear regression is used to asses the contributions of specific organic components and metals to the observed DTT activity.
The seasonal contributions of various emission sources to DTT activity were
aver-10
aged over the complete sampling year to estimate their aggregate contributions. Fig-ure 9a shows that the major drivers of DTT activity of fine PM in Atlanta are biomass burning and secondary aerosols, with their respective annual contributions of 35 % and 31 %. This is followed by vehicle emissions contributing 16 % annually, while mineral dust contributes minimally (9 %) to the DTT activity of PM2.5. Together, all of these emis-15
sion sources explained 91 % of the water-soluble DTT activity and 70 % of its variability (R2 between reconstituted and measured DTT activity=0.70; not shown) in Atlanta, demonstrating the robustness of our PMF model.
For the CMB analysis, step-wise regression provided a method for selecting the source contributions that significantly affect DTT activity, the others were removed from
20
the regression to avoid over-fitting. Thus, SDUST, CFPP and AMBSULF were removed from the regression through this process. The final regression was:
DTTv =0.10 LDGV +0.072 HDDV +0.065 BURN +0.023 AMSULF
+0.028 SOC +0.0069 PMOther (1)
PMOther, or the residual, was calculated by difference between the measured PM2.5 25
ACPD
14, 19625–19672, 2014Reactive oxygen species associated
with water-soluble PM2.5
V. Verma et al.
Title Page
Abstract Introduction
Conclusions References
Tables Figures
◭ ◮
◭ ◮
Back Close
Full Screen / Esc
Printer-friendly Version
Interactive Discussion
Discussion
P
a
per
|
Discus
sion
P
a
per
|
Discussion
P
a
per
|
Discussion
P
a
per
|
various sources were; LDGV 0.60, HDDV 0.27, SDUST 0.15, BURN 0.49, CFPP 0.16, AMSULF 0.33, AMBSLF 0.03, and SOC 0.44.
The aggregate contribution of each of these sources to the PM2.5 DTT activity
over the whole study period is also shown in Fig. 9b. Overall, CMB yielded a sim-ilar picture as PMF; biomass burning (BURN) and secondary oxidation processes
5
(SOC+AMSULF) were the dominant sources of DTT activity in Atlanta with contri-butions of 33 and 29 %, respectively, in addition to vehicular sources (LDGV+HDDV, 32 %). CMB-identified vehicle sources also include resuspended dust, which may ex-plain, to some extent, a higher vehicular contribution to DTT activity by CMB compared to PMF.
10
4 Conclusions
Based on a large data set (N=483), the ability of water-soluble PM2.5 to generate
oxidants determined by the DTT assay was linked with aerosol sources in the South-eastern US. Spatial and temporal profiles of DTT activity in the region were produced from more than a year of sampling conducted intermittently at multiple sites, ranging
15
from urban to rural environments. PM chemical components indicated diverse emission characteristics at these sites in different seasons. While WSOC was spatially uniform from widespread summertime SOA formation and wintertime biomass burning emis-sions, primary pollutants such as EC and crustal metals were less uniformly distributed and were higher at the urban sites. The results show that DTT activity per volume of air
20
sampled is also spatially uniform, but has seasonal variability, with significantly higher levels in winter compared to summer and fall.
Despite the spatial uniformity, the moderate correlations of DTT activity between paired sites indicate the influence of both regional and local emissions on the PM’s abil-ity to generate ROS. A simple linear regression conducted between DTT activabil-ity and
25
ACPD
14, 19625–19672, 2014Reactive oxygen species associated
with water-soluble PM2.5
V. Verma et al.
Title Page
Abstract Introduction
Conclusions References
Tables Figures
◭ ◮
◭ ◮
Back Close
Full Screen / Esc
Printer-friendly Version
Interactive Discussion
Discussion
P
a
per
|
Discus
sion
P
a
per
|
Discussion
P
a
per
|
Discussion
P
a
per
|
by vehicle emissions at urban sites. The DTT activity associations with WSOC mod-erated in fall while those with vehicular emissions and dust increased. In winter, DTT activity was best correlated with biomass burning (BrnC and K) at both urban and rural sites.
PMF analysis was conducted on the representative urban Atlanta dataset to
quan-5
tify the contribution from each of these sources to the ROS generating potential of PM. Biomass burning and secondary aerosol formation were quantified as the strongest sources of DTT activity, with their respective study-average (summer 2012 to spring 2013) contribution of 35 %, and 31 %, followed by vehicular emissions (16 %). There was strong seasonality in the contribution from secondary and biomass burning
10
aerosols, i.e. secondary processes dominated in summer accounting for 46 % of the DTT activity, while biomass burning in winter (47 %). The dust contribution was minimal (9 %) and was significant only in summer and fall. Source apportionment conducted using an alternative approach, CMB, also yielded similar study-average contributions from secondary sources (29 %) and biomass burning (33 %), but higher contributions
15
from vehicular emissions (32 %), which is partly due to resuspended dust included in the CMB-identified vehicular source.
This is perhaps the first study integrating an extensive dataset on PM ROS gen-erating potential with chemical components using source apportionment models and was made possible by a recently developed automated DTT analytical system.
Pre-20
vious studies, relying on a small sample size collected from single sites and typically in a specific season have associated similar chemical species to aerosol DTT activity, but often from a limited range of sources. Further analysis is underway to resolve the specific components of SOA and biomass burning that contributed to the DTT activity. Finally, we note that the large spatial distribution of two major sources of DTT activity,
25
ACPD
14, 19625–19672, 2014Reactive oxygen species associated
with water-soluble PM2.5
V. Verma et al.
Title Page
Abstract Introduction
Conclusions References
Tables Figures
◭ ◮
◭ ◮
Back Close
Full Screen / Esc
Printer-friendly Version
Interactive Discussion
Discussion
P
a
per
|
Discus
sion
P
a
per
|
Discussion
P
a
per
|
Discussion
P
a
per
|
The Supplement related to this article is available online at doi:10.5194/acpd-14-19625-2014-supplement.
Acknowledgements. This publication was made possible by US EPA grant R834799. This pub-lication’s contents are solely the responsibility of the grantee and do not necessarily represent the official views of the US EPA. Further, US EPA does not endorse the purchase of any com-5
mercial products or services mentioned in the publication. The authors would like to thank R. Erik Weber who helped in sample collection and sample preparation for DTT, WSOC, BrnC and metals analysis, Janessa R. Rowland and Madhusudan Kamat for assistance with filter ex-tractions and IC-analysis, and the SEARCH personnel for their many contributions supporting the field deployments.
10
References
Akaike, H.: A new look at the statistical model identification, IEEE T. Automat. Contr., 19, 716– 723, 1974.
Artaxo, P., Gerab, F., Yamasoe, M. A., and Martins, J. V.: Fine mode aerosol composition at 3 long-term atmospheric monitoring sites in the Amazon Basin, J. Geophys. Res.-Atmos., 99, 15
22857–22868, doi:10.1029/94jd01023, 1994.
Ashbaugh, L. L. and Eldred, R. A.: Loss of particle nitrate from Teflon sampling filters: effects on measured gravimetric mass in California and in the IMPROVE network, J. Air Waste Manage., 54, 93–104, 2004.
Ayres, J. G., Borm, P., Cassee, F. R., Castranova, V., Donaldson, K., Ghio, A., Harri-20
son, R. M., Hider, R., Kelly, F., Kooter, I. M., Marano, F., Maynard, R. L., Mudway, I., Nel, A., Sioutas, C., Smith, S., Baeza-Squiban, A., Cho, A., Duggan, S., and Froines, J.: Evalu-ating the toxicity of airborne particulate matter and nanoparticles by measuring oxidative stress potential – a workshop report and consensus statement, Inhal. Toxicol., 20, 75–99, doi:10.1080/08958370701665517, 2008.
25
ACPD
14, 19625–19672, 2014Reactive oxygen species associated
with water-soluble PM2.5
V. Verma et al.
Title Page
Abstract Introduction
Conclusions References
Tables Figures
◭ ◮
◭ ◮
Back Close
Full Screen / Esc
Printer-friendly Version
Interactive Discussion
Discussion
P
a
per
|
Discus
sion
P
a
per
|
Discussion
P
a
per
|
Discussion
P
a
per
|
Birch, M. E. and Cary, R. A.: Elemental carbon-based method for monitoring occupational ex-posures to particulate diesel exhaust, Aerosol Sci. Tech., 25, 221–241, 1996.
Biswas, S., Verma, V., Schauer, J. J., Cassee, F. R., Cho, A. K., and Sioutas, C.: Oxidative potential of semi-volatile and non volatile particulate matter (PM) from heavy-duty vehi-cles retrofitted with emission control technologies, Environ. Sci. Technol., 43, 3905–3912, 5
doi:10.1021/es9000592, 2009a.
Biswas, S., Verma, V., Schauer, J. J., Cassee, F. R., Cho, A. K., and Sioutas, C.: Oxidative potential of semi-volatile and non-volatile particulate matter (PM) from heavy-duty vehicles retrofitted with emission control technologies, Environ. Sci. Technol., 43, 3905–3912, 2009b. Castro, L. and Freeman, B.: Reactive oxygen species in human health and disease, Nutrition, 10
17, 161–165, doi:10.1016/S0899-9007(00)00570-0, 2001.
Charrier, J. G. and Anastasio, C.: On dithiothreitol (DTT) as a measure of oxidative potential for ambient particles: evidence for the importance of soluble transition metals, Atmos. Chem. Phys., 12, 9321–9333, doi:10.5194/acp-12-9321-2012, 2012.
Cho, A. K., Sioutas, C., Miguel, A. H., Kumagai, Y., Schmitz, D. A., Singh, M., Eiguren-15
Fernandez, A., and Froines, J. R.: Redox activity of airborne particulate matter at different sites in the Los Angeles Basin, Environ. Res., 99, 40–47, 2005.
Coulter, C. T.: EPA-CMB8.2 Users Manual, Office of Air Quality Planning & Standards, US Environmental Protection Agency, Research Triangle Park, NC, 27711, 2004.
Coz, E., Casuccio, G., Lersch, T. L., Moreno, T., and Artinano, B.: Anthropogenic influenced 20
mineral dust ambient fine particles at an urban site in Barcelona (Spain), Chem. Engineer. Trans., 22, 101–106, doi:10.3303/Cet1022016, 2010.
Delfino, R. J., Sioutas, C., and Shaista, M.: Potential role of ultrafine particles in associations between airborne particle mass and cardiovascular health, Environ. Health Persp., 113 934– 946, 2005.
25
Delfino, R. J., Staimer, N., Tjoa, T., Gillen, D. L., Schauer, J. J., and Shafer, M. M.: Airway inflammation and oxidative potential of air pollutant particles in a pediatric asthma panel, J. Expo. Sci. Env. Epid., 23, 466–473, doi:10.1038/Jes.2013.25, 2013.
DiStefano, E., Eiguren-Fernandez, A., Delfino, R. J., Sioutas, C., Froines, J. R., and Cho, A. K.: Determination of metal-based hydroxyl radical generating capacity of ambient and diesel 30