Objective: Verify the association between anthropometric indicators and the Subjective Global Assessment of Nutritional Status (SGA) and the Screening of Risk for Nutritional Status and Growth (STRONGkids) scales.
Methods: A cross-sectional study with patients from 0 to 18 years admitted in the Hospital das Clínicas, Goiânia (GO), between August and November 2015. Children and adolescents admitted in up to 48 hours were included. Patients who required speciic instruments for assessing their nutritional status and those hospitalized in Intensive Care were excluded. Identiication and anthropometric data was collected and applied to the SGA and STRONGkids. We performed an analysis comparing proportions and did an agreement assessment, where p<0.05 was signiicant.
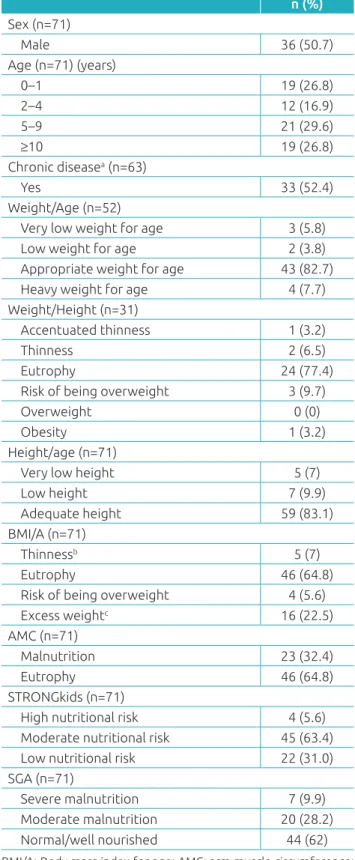
Results: 71 patients were evaluated, of whom 9.6% had low or very low birth weight/age, 9.7% had thinness or accentuated thinness according to the weight/height index, 16.9% had a height impairment, 7% were thin according to the body mass index/age, and 32.4% were malnourished with regard to arm muscle circumference. The STRONGkids detected that 69% of the sample had a moderate or high nutritional risk. According to the SGA, malnutrition prevalence was 38.1%. There was an association between the SGA and body mass index/ age (p=0.022), height/age (p<0.001) and arm muscle circumference (p=0.014). There was no association between the STRONGkids and anthropometric indicators. A correlation was found between: high nutritional risk versus severe malnutrition and low nutritional risk x the well-nourished (p<0.001), but the agreement was weak (k=0.255).
Conclusions: It is recommended to use the STRONGkids as a screening instrument because it has a higher sensitivity for diagnosing patients with a nutritional risk. The SGA should be applied to nutritional assessment due to its association with anthropometry.
Keywords: Child; Adolescent; Anthropometry; Nutritional assessment; Malnutrition; Nutritional status.
Objetivo: Veriicar associação entre indicadores antropométricos e as escalas Avaliação Nutricional Subjetiva Global (ANSG) e Triagem de Risco para Estado Nutricional e Crescimento (STRONGkids).
Métodos: Estudo transversal com pacientes de 0 a 18 anos, internados no Hospital das Clínicas, Goiânia (GO), entre agosto e novembro de 2015. Foram incluídas crianças e adolescentes admitidos em até 48 horas. Excluíram-se pacientes que requeriam instrumentos específicos para avaliar o estado nutricional e os internados em Terapia Intensiva. Coletaram-se dados de identiicação, antropométricos e foram aplicadas a ANSG e a STRONGkids. Feita análise de comparação de proporções e avaliação de concordância, sendo signiicante p<0,05.
Resultados: Avaliaram-se 71 pacientes, dos quais 9,6% com baixo ou muito baixo peso/idade, 9,7% com magreza ou magreza acentuada pelo índice peso/estatura, 16,9% com comprometimento da estatura, 7% com magreza pelo índice de massa corporal/ idade e 32,4% desnutridos pela circunferência muscular do braço. A STRONGkids detectou 69% da amostra com risco nutricional moderado ou alto. Pela ANSG, a prevalência de desnutrição foi de 38,1%. Houve associação entre ANSG e índice de massa corporal/ idade (p=0,022), estatura/idade (p<0,001) e circunferência muscular do braço (p=0,014). Não houve associação entre a STRONGkids e os indicadores antropométricos. As ferramentas se associaram para: risco nutricional elevado versus desnutrição grave e baixo risco nutricional x bem nutridos (p<0,001), porém a concordância foi fraca (k=0,255).
Conclusões: Recomenda-se utilizar o STRONGkids como instrumento de triagem por apresentar maior sensibilidade para diagnosticar pacientes com risco nutricional. A ANSG deve ser aplicada para avaliação nutricional devido à associação com a antropometria.
Palavras‑chave: Criança; Adolescente; Antropometria; Avaliação nutricional; Desnutrição; Estado nutricional.
ABSTRACT
RESUMO
*Corresponding author. E-mail: [email protected] (T.C. de Oliveira).
aUniversidade Federal de Goiás, Goiânia, GO, Brazil.
Received on July 6, 2016; approved on November 13, 2016; available online on July 14, 2017.
THE NUTRITIONAL STATUS OF HOSPITALIZED
CHILDREN AND ADOLESCENTS: A COMPARISON
BETWEEN TWO NUTRITIONAL ASSESSMENT TOOLS
WITH ANTHROPOMETRIC PARAMETERS
Estado nutricional de crianças e adolescentes hospitalizados:
comparação entre duas ferramentas de avaliação
nutricional com parâmetros antropométricos
Thaynara Cristina de Oliveira
a,*, Izabela Zibetti de Albuquerque
a,
INTRODUCTION
he global prevalence of primary malnutrition has decreased in recent decades. However, it is unclear whether the prevalence of secondary malnutrition has also decreased.1 Children with
complex diseases admitted at children’s hospitals share difer‑ ent mechanisms of secondary malnutrition, which are deter‑ mined by the underlying disease, such as the reduction of food intake, poor absorption and increased energy expenditure, among others. It is possible to assume that the prevalence of secondary malnutrition has no parallel with the trend of pri‑ mary malnutrition because it is intrinsically linked to diferent types of morbidities.1,2
Malnutrition is associated with a bad prognosis in hospi‑ talized patients, and it is possible to identify increased risk of infections, increased loss of muscle mass, diiculty in wound healing, longer hospital stays and increased morbidity and mor‑ tality. In children, some additional consequences are added, such as growth and cognitive development impairment as well as low performance at school.3‑5 In this context, it is import‑
ant to identify children with the greatest nutritional risk early on, as it enables physicians/clinicians to provide guidelines for an intervention capable of preventing the worsening of the patient’s nutritional status, or for promoting their recovery.2, 6‑8
Although anthropometric and body composition data are strong predictors of nutritional risk and they are often used as a single criterion in diagnosing the patient, this data alone does not provide a complete approach. Additional information, such as food intake, clinical status and physical examination, among others, makes the diagnosis diferent.4,7 In recent years,
several screening and nutritional assessment tools were developed to identify nutritional risk at an early stage. Currently, there are six tools for hospitalized children and adolescents, however, there is no consensus on which is the best tool to use.8‑10 In clin‑
ical practice, the Screening of Risk for Nutritional Status and Growth (STRONGkids) and the Subjective Global Assessment of Nutritional Status (SGA) have been widely used.8,10
he STRONGkids is considered to be a fast and practical nutritional screening tool, which consists of the analysis of four items: presence of disease with high risk of malnutrition; sub‑ jective clinical evaluation; food intake and presence of vomit‑ ing or diarrhea; and recent weight loss. It is not necessary to perform anthropometric measurements and, depending on the score obtained, children are classiied into high, moder‑ ate or low risk of malnutrition.11 On the other hand, the SGA
demands more time for its application, since it is a more com‑ plete and detailed questionnaire used to evaluate and classify the patient’s nutritional status, and addresses anthropometric measurements, physical examination, food intake, gastrointes‑ tinal symptoms, functional impairment and metabolic stress of
the disease. he child’s nutritional status is assigned to a global ranking of eutrophy/well nourished, moderately malnourished or severely malnourished.12,13
hus, the objective of this study is to evaluate the association of the classiication of nutritional status obtained by anthropo‑ metric indicators, and lean mass with the tools for screening and nutritional assessment, the STRONGkids and the SGA, in pediatric patients and hospitalized adolescents.
METHOD
A cross‑sectional study was conducted with children and adoles‑ cents admitted in the pediatric emergency room or in the pedi‑ atric ward at the Hospital das Clínicas of Universidade Federal de Goiás (HC/UFG), in the period from August to November 2015. he sampling was performed for convenience, having as inclusion criteria children and adolescents (aged 1 month to 17 years), of both genders, who have been admitted to the hospital in up to 48h (time for the application of the question‑ naires). We excluded patients that required speciic instruments to assess their nutritional status and those that were admitted to other wards and the Intensive Care Unit (ICU). he way of feeding (oral, enteral and/or parenteral nutrition) was not an exclusion criterion. he parents who agreed to participate in the study signed an Informed Consent Form, and patients aged over six years signed an Informed Assent Form. he project was approved by the Ethics Committee in Human and Animal Research of the Universidade Federal de Goiás in Goiânia (GO), according to Resolution no. 466/2012.
he collection of data occurred in clinics in up to 48 hours after hospital admission, by researchers trained in the applica‑ tion of questionnaires and in the execution of anthropometry. Initially, identiication data was collected, such as full name, sex, date of birth, mother’s name and diagnosis of the patient’s records. Subsequently, the STRONGkids and SGA tests were applied, according to anthropometric measurements.
he determination of nutritional status by the STRONGkids varies according to the score obtained in the questionnaire, so that patients are classiied as high (4 to‑5 points), moderate (1‑3 points) and low‑risk (0 points). he SGA is a tool that was recently validated for use in the Brazilian population14 and its
In the anthropometric assessment, we measured: weight, height, arm circumference and triceps skinfold thickness, with the calculation of body mass index (BMI) and arm muscle circum‑ ference. Patients were evaluated according to the following anthropometric indicators: weight for age (0‑10 years), weight for height W/H (0‑5 years), height‑for‑age H/A (0‑19 years) and body mass index for age, BMI/A (0‑19 years), all classiied in Z score by the growth curves of the World Health Organization (WHO) in 2006/07,15 with the software WHO Anthro ver‑
sion 3.2.2 and WHO Anthro Plus.16 For an analysis of arm
muscle circumference (AMC), the cutof points of 11 cm17
and 11.5 cm18 were used to determine malnutrition in chil‑
dren under the age of 6 months and between 6 and 12 months respectively. For children over 1 year of age, we applied the ref‑ erence values proposed by Frisancho.19
Initially, we used descriptive statistics procedures (frequen‑ cies relative and absolute) for categorical variables. To com‑ pare proportions, Pearson’s chi‑square test was adopted, with p<0.05 being signiicant. In the case of statistical signif‑ icance, the Adjusted Residual Test was used, considering the absolute value as greater than 1.96 to check local association between categorical variables. To assess agreement between the nutritional screening tools, we applied the Kappa coeicient, and interpreted it according to the value scores proposed by Landis and Koch.20 he analyzes were obtained by means of
the application SPSS statistical package (IBM SPSS Statistics version 19.0; Chicago, IL, USA).
RESULTS
A total of 71 patients were included in the study, of which 50.7% were males and 46.5% had some chronic disease (Table 1). he≈median age was 5 years and 2 months. Renal system dis‑ eases were prevalent, being present in 25.4% of the patients, followed by cardiorespiratory diseases (15.5%), hematolog‑ ical diseases (9.9%), gastrointestinal diseases (8.5%), rheu‑ matic (7%) and metabolic diseases (5.6%). he other patients (28.2%) had no conclusive diagnosis or did not it in other disease groups. he patients had an appropriate mean weight and length at birth of: 3220±559 g (n=65) and 49.1±3.1 cm (n=61), respectively.
When assessed by anthropometric indicators: 9.6% had low or very low birth weight/age; 9.7% thinness or thinness accen‑ tuated by weight/height index; 16.9% had a height impairment; 7% were underweight by BMI/A; and 32.4% were malnour‑ ished by AMC (Table 1). hrough STRONGkids, moderate and high nutritional risk was diagnosed in 69% of the sam‑ ple. hrough the SGA, malnutrition prevalence was 38.1% (Table 1). By correlating the STRONGkids with anthropometric
n (%)
Sex (n=71)
Male 36 (50.7)
Age (n=71) (years)
0–1 19 (26.8)
2–4 12 (16.9)
5–9 21 (29.6)
≥10 19 (26.8)
Chronic diseasea (n=63)
Yes 33 (52.4)
Weight/Age (n=52)
Very low weight for age 3 (5.8)
Low weight for age 2 (3.8)
Appropriate weight for age 43 (82.7)
Heavy weight for age 4 (7.7)
Weight/Height (n=31)
Accentuated thinness 1 (3.2)
Thinness 2 (6.5)
Eutrophy 24 (77.4)
Risk of being overweight 3 (9.7)
Overweight 0 (0)
Obesity 1 (3.2)
Height/age (n=71)
Very low height 5 (7)
Low height 7 (9.9)
Adequate height 59 (83.1)
BMI/A (n=71)
Thinnessb 5 (7)
Eutrophy 46 (64.8)
Risk of being overweight 4 (5.6)
Excess weightc 16 (22.5)
AMC (n=71)
Malnutrition 23 (32.4)
Eutrophy 46 (64.8)
STRONGkids (n=71)
High nutritional risk 4 (5.6) Moderate nutritional risk 45 (63.4) Low nutritional risk 22 (31.0) SGA (n=71)
Severe malnutrition 7 (9.9)
Moderate malnutrition 20 (28.2)
Normal/well nourished 44 (62)
Table 1 Social and clinical characteristics, and nutritional
status of children and adolescents (n=71).
BMI/A: Body mass index for age; AMC: arm muscle circumference; STRONGkids: Screening of Risk for Nutritional Status and Growth; SGA: Subjective Global Assessment of Nutritional Status. aEight patients had
no complete diagnosis; bthe category “thinness” included the categories thinness and accentuated thinness; cthe category “overweight” included
Variables n
STRONGKids
p‑value Nutritional risk
Low Mode‑ rate High
Weight/Age (0–10 years, n=52) Very low weight
for age 4 2 2 0
0.494 Low weight
for age 43 9 32 2
Appropriate
weight for age 2 1 1 0
Heavy weight
for age 3 1 2 0
Weight/Height (0–5 years, n=31) Accentuated
thinness 1 0 1 0
0.395
Thinness 2 1 1 0
Eutrophy 24 4 19 1
Risk of being
overweight 3 1 2 0
Overweight 0 0 0 0
Obesity 1 1 0 0
Height/Age (0–18 years, n=71)
Very low height 5 2 3 0
0.069
Low Height 7 0 5 2
Adequate height 59 20 37 2 BMI/A (0–18 years, n=71)
Thinnessa 5 2 2 1
0.097
Eutrophy 46 10 33 3
Risk of being
overweight 4 1 3 0
Excess weightb 16 9 7 0
AMC (0–18 years, n=69c)
Malnutrition 23 6 15 2
0.691
Eutrophy 46 15 29 2
Table 2 Association between the STRONGkids and
anthropometric parameters of children and adolescents.
STRONGkids: Screening of Risk for Nutritional Status and Growth; BMI/I: Body mass index for age; AMC: arm muscle circumference.
aThe category “thinness” included the categories thinness and
accentuated thinness; bthe category “overweight” included the
categories of overweight, obesity and severe obesity; ctwo patients
did not measure the AMC due to logistical problems.
indicators, there was no statistical signiicance for any param‑ eter analyzed (Table 2).
As for the SGA, it showed a signiicant association with H/A (p<0.001), BMI/A (p=0.022), and AMC (p=0.014) (Table 3). hrough the Adjusted Residual Test, local asso‑ ciations were found between SGA with BMI, AMC and height: low weight versus severe malnutrition, overweight
versus well‑nourished, low and very low height versus severe malnutrition, adequate height versus well‑nourished, AMC of malnutrition versus moderate malnutrition and AMC suited
versus well‑nourished.
The local association between tools was evident in the following topics: high nutritional risk versus severe malnutri‑ tion, and low nutritional risk versus well‑nourished (p<0.001) (Table 4). However, through the Kappa Coeicient, the cor‑ relation between the two tools was found to be weak (k=0.255).
DISCUSSION
In our study, the STRONGkids showed no association with the anthropometric parameter analyzed. he SGA was asso‑ ciated with BMI/A, H/A and AMC, but not with the W/H and W/A. here was an association between the two tools, although it was of low intensity. It should be emphasized that the STRONGkids is a screening tool with the objective of identifying and categorizing nutritional risk, while SGA aims to evaluate and classify nutritional status.
Corroborating our indings, other studies have demon‑ strated that, at the time of hospital admission, there is a pre‑ dominance of children and adolescents with adequate nutri‑ tional status when assessed by anthropometric parameters.3,21‑23
On the other hand, weight loss is frequent during hospitaliza‑ tion, which reinforces the importance of early identiication of children at risk of deteriorating nutritional status. A pro‑ spective study showed that 65% of the children had weight loss during hospitalization and the factors most predictive of its occurrence were: reduced food intake, pain and sever‑ ity of the disease.24
he nutritional screening by the SGA also found a higher prevalence of well‑nourished patients than poorly nourished patients in our sample. A study performed in a pediatric hos‑ pital in Porto Alegre found that 84.2% of the population was normal/well nourished.21 It should be noted that the focus of
this tool is to detect malnutrition and, thus, there is a classiica‑ tion for patients with excess weight, which may overestimate the normal category/well nourished. In contrast, 70% of children in a study conducted in Iran showed some degree of malnu‑ trition through the SGA, despite having adequate nutritional status when assessed by H/A and W/A.23
STRONGkids SGA p‑value Well nourished Moderate malnutrition Severe malnutrition
Low nutritional risk 19* 3 0
0.000
Moderate nutritional risk 25 16 4
High nutritional risk 0 1 3*
SGA: Subjective Global Assessment of Nutritional Status; STRONGkids: Screening of Risk for Nutritional Status and Growth. *>1.96 by the Adjusted Residual Test.
Table 4 Association between the SGA and STRONGkids of children and adolescents.
Variables n SGA p‑value
Well nourished Moderate malnutrition Severe malnutrition
Weight/Age (0–10 years, n=52)
Very low weight for age 4 4 0 0
0.116
Low weight for age 43 27 13 3
Appropriate weight for age 2 1 1 0
Heavy weight for age 3 0 2 1
Weight/Height (0–5 years, n=31)
Accentuated thinness 1 0 0 1
0.359
Thinness 2 1 1 0
Eutrophy 24 14 8 2
Risk of being overweight 3 3 0 0
Overweight 0 0 0 0
Obesity 1 1 0 0
Height/Age (0–18 years, n=71)
Very low height 5 0 3 2*
0.000
Low Height 7 0 4 3*
Adequate height 59 44* 13 2
BMI/A (0–18 years, n=71)
Thinness* 5 1 2 2*
0.022
Eutrophy 46 26 16 4
Risk of being overweight 4 3 0 1
Excess weight** 16 14* 2 0
AMC (0–18 years, n=69a)
Malnutrition 23 9 11* 3
0.014
Eutrophy 46 8 4
Table 3 Association between the SGA and anthropometric parameters of children and adolescents.
SGA: Subjective Global Assessment of Nutritional Status; BMI/I: Body mass index for age; AMC: arm muscle circumference. *The category “thinness” included the categories thinness and accentuated thinness. *>1.96 by the Adjusted Residual Test; **the category “overweight” included the categories of overweight, obesity and severe obesity. aTwo patients did not measure AMC due to logistical problems.
not follow any criteria of the questionnaire, the condition of being hospitalized already considers that he or she is at low nutritional risk. A study carried out in Pelotas also observed a high prevalence of nutritional risk in patients evaluated by the
STRONGkids, with 55.3% of the sample having moderate risk and 16% having high risk.22 A similar frequency was found in
When the nutritional proile is evaluated according to the type of hospital, a multicenter study carried out in the Netherlands noted a higher prevalence of high nutritional risk in university hospitals, when compared to other hospitals, of 15 and 5%, respectively. he researchers suggest that this is due to a higher number of patients being hospitalized with some chronic dis‑ ease in university hospitals, in comparison to others.8
Also with respect to the STRONGkids, there was no sig‑ niicant association between this tool and anthropometric data. his inding can be explained by the greater sensitivity of the tool in diagnosing nutritional risk. A prospective obser‑ vational study with 46 children with inlammatory bowel dis‑ ease also found no association between STRONGkids and diagnosed malnutrition based on anthropometric data pro‑ posed by the WHO.25 his data was diferent from that found
by Luciana et≈al., who demonstrated a statistical association, although weak, between STRONGkids and BMI/A catego‑ ries excess weight versus low nutritional risk, normal weight
versus moderate nutritional risk, and malnutrition versus high nutritional risk.21 A signiicant, although weak, correlation
was also found, between the STRONGkids with BMI/A and H/A in children and adolescents. In the latter, signiicant cor‑ relations between these anthropometric measurements and the STRONGkids were noticed only for the high‑risk group.3
his data indicates that the tool does not show good correla‑ tion with anthropometric indicators commonly used in clini‑ cal practice, and that, when this association occurs, it is weak. Such a divergence between the results can be attributed to the fact that the tool does not contemplate anthropometric data in its research. In spite of dealing with two items closely related to anthropometric measurements, such as poor nutritional status veriied by physical examination, evaluated by a professional, and the occurrence of weight loss, judged by parents, this data is afected by the subjective analysis imposed. Spagnuolo et al. suggest the consideration of STRONGkids in conjunction with other nutritional parameters due to their numerical system of classiication. During this Italian research, many pediatricians pointed out the incompatibility between the clinical judgment of nutritional risk of the patient with the categorization (low, moderate or high risk) produced by the tool.3
In relation to SGA, an association of this tool with anthro‑ pometric parameters has been reported in the literature, and can be observed in our study for the categories low weight ver-sus severely malnourished, excess weight versus well‑nourished, low and very low height versus severely malnourished, adequate height versus well‑nourished, AMC of malnutrition versus mod‑ erately malnourished and adequate AMC versus well‑nourished. In accordance with this result, Campos et al. found a signii‑ cant association between malnutrition classiied by BMI/A and
the group of patients with moderate and severe malnutrition by SGA.21 When this association was evaluated in critically ill
patients admitted in an intensive care unit, a moderate to strong correlation between the weight, height, weight/height, tricipital skinfold, appropriateness of ideal weight and arm muscle cir‑ cumference with the scores of SGA was found. hese indings suggest that SGA can be used in place of anthropometry in crit‑ ically ill children, as it is the irst subjective measure validated to assess the nutritional status of these patients.26 Although an
association between SGA with four objective parameters of nutritional status (weight, height, triceps skinfold thickness and level of serum transferrin) has not been found, Mahdavi et al. suggest that SGA will be able to identify the risk of mal‑ nutrition even before a change occurs in the anthropometric parameters and laboratory tests.23 he low correlation found in
some studies between SGA and the objective parameters can be justiied by some limitations of the tool itself. First, SGA was developed to improve the speciicity at the expense of sensi‑ tivity; second, it does not classify the patient into mild mal‑ nutrition, only into moderate or severe; third, the tool priori‑ tizes chronic nutritional problems, making it diicult to detect acute changes. Despite these limitations and the absence of a numerical system for the inal classiication of nutritional sta‑ tus, the subjectivity of this tool allows the professional to use clinical judgment rather than apply strict criteria, which may not be valid in the health/disease context.23
Although, in some cases, the prevalence of malnutrition has been divergent according to the used tool, an association was found between the SGA and STRONGkids in patients at high nutritional risk and severely malnourished, and at low nutritional risk and well nourished. Although there is no gold standard test, a study evaluated the validity of three screening tools with the SGA, and it was considered to be the most complete method in this study. he STRONGkids showed a sensitivity of 100%, which does not imply a false negative; however, its speciicity was of 7.7%, resulting in a false positive of 92.3%.27 Recent
meta‑analysis assessed the accuracy of ive nutritional screening tools, including the STRONGkids, for hospitalized children and adolescents, and found no evidence for the selection of a single tool as the most accurate in clinical practice. We sug‑ gest, therefore, the use of multiple criteria to select the instru‑ ment to be used, such as reliability between evaluators, ease of use and time needed to use the tool.28 It is worth noting that
the use of screening tools has been recommended by interna‑ tional associations, such as the British Association of Parenteral and Enteral Nutrition and the European Society for Paediatric Gastroenterology, Hepatology and Nutrition.25.27 he assessment
of risk of developing it could promote useful nutritional inter‑ ventions, avoiding the short and long term consequences of malnutrition.3
here is no single parameter to deine malnutrition in pediatrics; consequently, the assessment of nutritional status becomes quite complex and requires an analysis of various cri‑ teria, such as clinical and food history, physical examination, anthropometric and laboratory parameters.3,10,13 Among anthro‑
pometric data, it is worth mentioning that the AMC was the most sensitive method to diagnose the impairment of nutri‑ tional status, with 32.4% of malnourished patients versus 7% with thinness, when evaluated by AMC and BMI/A, respec‑ tively. his parameter is associated with total body mass and indicates the association of malnutrition with the reduction of muscle mass. In addition, evidence shows that this depletion is also present in the low height.29 Nevertheless, there is little
use of AMC in clinical practice.
he major limitation of this study was the fact that many variables addressed in the screening tools and nutritional assess‑ ment depend on the memory and/or the judgment of the par‑ ents, which may have afected the nutritional diagnosis of the patient. Other possible limitations were:
1. Some patients were discharged before 48 hours of admis‑ sion, and did not have time for the application to be applie.
2. Sample heterogeneity.
3. Lack of correlation between nutritional status and clin‑ ical outcome.
4. he majority of patients did not have the growth curve illed out in the child’s handbook, compromising the reliability of the data.
However, we believe that the research was able to reinforce the need for early assessment as a fundamental step to establish adequate nutritional support for patients.
Although the STRONGkids has not presented an associa‑ tion with anthropometric data, its use is recommended solely as a screening instrument because it presents higher sensitiv‑ ity for diagnosing patients at nutritional risk. For the assess‑ ment of nutritional status, we suggest the use of the SGA, because its results were associated with anthropometry data and allowed an overall analysis of the patient. hus, we pro‑ pose that a patient that has moderate or high nutritional risk should be also assessed by the SGA for a nutritional diagnosis and to establish treatment.
Funding
his study did not receive funding.
Conflict of interests
he authors declare no conlict of interests.
REFERENCES
1. Macías-Rosales R, Vásquez-Garibay EM, Larrosa-Haro A, Rojo-Chávez M, Bernal-Virgen A, Romo-Rubio H. Secondary Malnutrition and Overweight in a Pediatric Referral Hospital: Associated Factors. J Pediatr Gastroenterol Nutr. 2009;48:226-32.
2. Mehta NM, Corkins MR, Lyman B, Malone A, Goday PS, Carney LN, et al. Deining Pediatric Malnutrition: A Paradigm Shift Toward Etiology-Related Deinitions. JPEN Parenter Enteral Nutr. 2013;37:460-81.
3. Spagnuolo MI, Liguoro I, Chiatto F, Mambretti D, Guarino A. Application of a score system to evaluate the risk of malnutrition in a multiple hospital setting. Ital J Pediatr. 2013;39:80.
4. Mccarthy H, Dixon M, Crabtree I, Eaton-Evans MJ, Mcnulty H. The development and evaluation of the Screening Tool for the Assessment of Malnutrition in Paediatrics (STAMPª) for use by health care staf. J Hum Nutr Diet. 2012;25:311-8.
5. Simões AP, Palchetti CZ, Patin RV, Mauri JF, Oliveira FL. Estado nutricional de crianças e adolescentes hospitalizados em enfermaria de cirurgia pediátrica. Rev Paul Pediatr. 2010;28:41-7.
6. Moeeni V, Walls T, Day AS. Assessment of nutritional status and nutritional risk in hospitalized Iranian children. Acta Paediatr. 2012;101:e446-51.
7. Araújo MA, Lima LS, Ornelas GC, Logrado MH. Análise comparativa de diferentes métodos de triagem nutricional do paciente internado. Com Ciências Saúde. 2010;21:331-42.
8. Hulst JM, Zwart H, Hop WC, Joosten KF. Dutch national survey to test the STRONGkids nutritional risk screening tool in hospitalized children. Clin Nutr. 2010;29:106-11.
9. Moeeni V, Walls T, Day AS. The STRONGkids nutritional risk screening tool can be used by paediatric nurses to identify hospitalized children at risk. Acta Pædiatr. 2014;103:e528-31.
10. Joosten KF, Hulst JM. Nutritional screening tools for hospitalized children: Methodological considerations. Clin Nutr. 2014;3:1-5.
11. Ling RE, Hedges V, Sullivan PB. Nutritional risk in hospitalised children: Na assessment of two instruments. E Spen Eur E J Clin Nutr Metab. 2011;6:e153-7.
© 2017 Sociedade de Pediatria de São Paulo. Published by Zeppelini Publishers. This is an open access article under the CC BY license (http://creativecommons.org/licenses/by/4.0/).
13. Moeeni V, Day AS. Nutritional Risk Screening Tools in Hospitalised Children. Int J Child Health Nutr. 2012;1:39-43.
14. Carniel MP, Santetti D, Andrade JS, Favero BP, Moschen T, Campos PA, et al. Validation of a subjective global assessment questionare. J Pediatr (Rio J). 2015;91:596-602.
15. WHO Multicentre Growth Reference Study Group. WHO child growth standards based on length/height, weight and age. Acta Paediatr. 2006; Suppl 450:S76-85.
16. World Health Organization. WHO Anthro (version 3.2.2, January 2011) and macros. Geneva: WHO; 2010.
17. Chand S, Shah D. Mid upper arm circumference for detection of severe acute malnutrition in infants aged between one and six months. Indian Pediatr. 2015;52:528-9.
18. World Health Organization, United Nations Children’s Fund. WHO child growth standards and the identiication of severe acute malnutrition in infants and children. A joint statement. Geneva: WHO; 2009.
19. Frisancho AR. New norms of upper limb fat and muscle areas for assessment of nutritional status. Am J Clin Nutr. 1981;34:2540-5.
20. Landis JR, Koch GG. The measurement of observer agreement for categorical data. Biometrics. 1977;33:159-74.
21. Campos LS, Neumann LD, Rabito ER, Mello ED, Vallandro JP. Avaliação do risco nutricional em crianças hospitalizadas: uma comparação da avaliação subjetiva global pediátrica e triagem nutricional STRONGkids com os indicadores antropométricos. Sci Med. 2015;25:1-8.
22. Costa MV, Pastores CA. Herramienta de cribado nutricional versus valoración nutricional antropométrica de niños hospitalizados: ¿Cuál método se associa mejor com la evolución clínica? Arch Latinoam Nutr. 2015;65:12-20.
23. Mahdavi AM, Safaiyan A, Ostadrahimi A. Subjective vs objective nutritional assessment study in children: a cross-sectional study in the northwest of Iran. Nutr Res. 2009;29:269-74.
24. Sermet-Gaudelus I, Poisson-Salomon AS, Colomb V, Brusset MC, Mosser F, Berrier B, et al. Simple pediatric nutritional risk score to identify children at risk of malnutrition. Am J Clin Nutr. 2000;72:64-70.
25. Wiskin AE, Owens DR, Cornelius VR, Wootton AS, Beattie RM. Paediatric nutrition risk scores in clinical practice: children with inflammatory bowel disease. J Hum Nutr Diet. 2012;25:319-22.
26. Vermilyea S, Slicker J, El-Chammas K, Sultan M, Dasgupta M, Hofmann RG, et al. Subjective global nutritional assessment in critically ill children. JPEN J Parenter Enteral Nutr. 2013;37:659-66.
27. Wonoputri N, Djais JT, Rosalina I. Validity of nutritional screening tools for hospitalized children. J Nutr Metab. 2014;2014:143649.
28. Huysentruyt K, Devreker T, Dejonckheere J, Schepper J, Vandenplas Y, Cools F. Accuracy of nutritional screening tools in assessing the risk of undernutrition in hospitalized children. J Pediatr Gastroenterol Nutr. 2015;61:159-66.