International Journal for Quality research UDK - 677:658.562(540)
Short Scientific Paper (1.03)
C.S.Chethan Kumar
1)NVR Naidu
1)1) M S Ramaiah Institute of
Technology, India, {chethan.tpm; nvnaidu}@gmail.com
MINIMIZING THE EIGHTH WASTE OF LEAN- ABSENTEEISM
THROUGH SIX SIGMA METHODOLOGY
Abstract: The garment industries are labour intensive and are subjected to pollution in terms of dust and dyes. This is causing allergy and other huge amount health related issues. As employees are focused on stitching operations they tend to get injured when there is a lapse in attention. In India, garment industries are generally dominated by female workforce. There is a disparity in the male to female ratio. Most of the managers and supervisors are male and there is an increasing case of harassment towards the female workforce. Added to these conditions, the labour laws are no strict to protect the employees in terms of working conditions, job security and proper salaries. As a result there is an increase in employee absenteeism which is hurting the overall company growth and resulting in targets not being met. This research work is implemented in Apple garment industry located in South India.Absenteeism in garment industry is rampant and reaching alarming proportions. According to industry reports, if absenteeism is more than 10% , then the assembly line will be affected in terms of productivity.The majority of the garment industries in India are facing productivity problems due to employee absenteeism. The results after implementing the lean sixsigma methodology in Apple garments is positive and a trend setter for other garment industries to follow. The existing absenteeism of 11.05% is a true reflection of the state of affairs in the garment sector. This research work has shown that absenteeism can be really controlled with the involvement of management.
Keywords: Kaizen, Lean, Six Sigma, Continuous Improvement & Employees Participation, Absenteeism, garment
1. INTRODUCTION
· Research Case : The garment industries are labour intensive and are subjected to pollution in terms of dust and dyes. This is causing allergy and other huge amount health related issues. As employees are focused on stitching operations they tend to get injured when there is a lapse in attention. In India, garment industries are generally dominated by female workforce. There is a disparity in the male to female ratio. Most of the managers and supervisors are male and there is an increasing case of harassment towards the female workforce [6].
Added to these conditions, the labour laws are no strict to protect the employees in terms of working conditions, job security and proper salaries. As a result there is an increase in employee absenteeism which is hurting the overall company growth and resulting in targets not being met. The labour productivity can be enhanced by adopting the incentive plans for better prospects of industries [5]. This research work is implemented in Apple garment industry located in Madurai
· Problem Statement: Absenteeism in garment industry is rampant and reaching alarming proportions[2]. According to industry reports, if absenteeism is more than 10% , then the assembly line will be affected in terms of productivity.
· Goal Statement
To reduce % absenteeism to Minimum [1].
· Team Size: Two
· CTQ (Critical to Quality Characteristic): % absenteeism of employees.
2. MEASURE PHASE
In this phase, after discussions with the managers and supervisors the following data is collected with the help of team members which is indicated in table 1.1 .The variables in terms of Total working days, Total number of staff, total available days and absenteeism is recorded.
Table.1.1: Dpo and percentage absenteeism
Period 3 Months
Total Working Days 60 Total No. of Staffs 285 Total Available Days 17100
Absenteeism 1890
% Absenteeism 11.05%
dpo 0.1105
sigma 2.7
3. ANALYZE PHASE
The past data on absenteeism, department wise & designation wise is collected and analyzed as given in table 1.2.
Table.1.2: Department - wise absenteeism
Department Absenteeism % Absenteeism
Cutting 145 7.68%
Fabric 13 0.69%
Finishing 301 15.93%
House keeping 23 1.22%
Maintenance 25 1.32%
Sample 64 3.39%
Stitching 1318 69.77%
Grand Total 1889 100%
Figure.1.1 Pareto Chart shows that stitching and finishing departments are major contributors for absenteeism
Through brainstorming sessions with the shop supervisors, all potential causes were identified [3,4].
The identified causes are given in figure 1.2.
Co
u
nt
P
erc
en
t
Department
Count
69.8 15.9 7.7 3.4 1.3 1.2 0.7
Cum % 69.8 85.7 1318
93.4 96.8 98.1 99.3 100.0
301 145 64 25 23 13
Percent
Oth er
House kee
ping
Mai ntena
nce Sam
ple Cutting Finishi
ng
Stitchi ng
2000
1500
1000
500
0
100
80
60
40
20
0
Figure.1.1: Pareto Chart for major contributors in terms of absenteeism in various department
Inside the stitching department, the designation wise absenteeism analysis is given in Table 1.3
Table 1.3: Absenteeism in stitching department
Sl. No DESIGNATION Absenteeism % Absenteeism
1 checker 52 3.95%
2 helper 312 23.67%
3 ironer 36 2.73%
4 trimmer 8 0.61%
5 writer 14 1.06%
6 operator - a 464 35.20%
7 operator - a+ 2 0.15%
8 operator - b 207 15.71%
9 operator - b+ 177 13.43%
10 operator - c 41 3.11%
11 others 5 0.38%
Grand Total 1318 100.00%
Figure.1.3: Pareto chart for designation
In stitching department, as indicated in figure 1.3 :Pareto diagram show that Operator A, Helper, Operator B & Operator B+ are major absenteeism [7,8].
The reasons for absenteeism amongst the
operators in stitching department is discussed with the employees and supervisors and the cause and effect diagram is drawn as shown in figure 1.4.
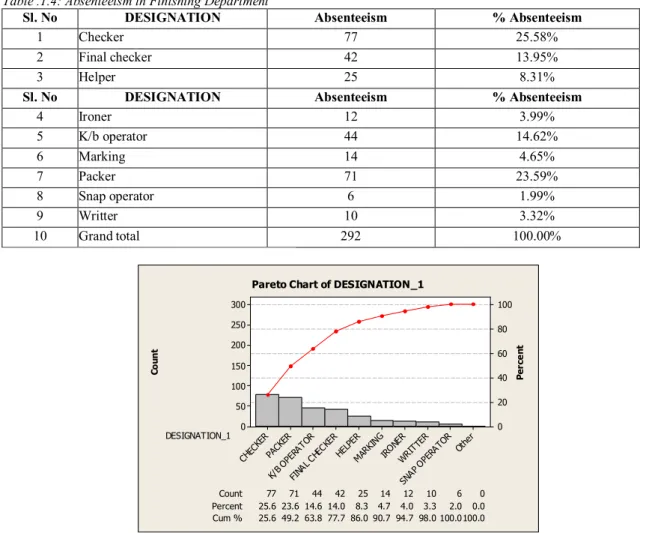
The Absenteeism in finishing department is identified and the analysis results are given in Table .1.4
Table .1.4: Absenteeism in Finishing Department
Sl. No DESIGNATION Absenteeism % Absenteeism
1 Checker 77 25.58%
2 Final checker 42 13.95%
3 Helper 25 8.31%
Sl. No DESIGNATION Absenteeism % Absenteeism
4 Ironer 12 3.99%
5 K/b operator 44 14.62%
6 Marking 14 4.65%
7 Packer 71 23.59%
8 Snap operator 6 1.99%
9 Writter 10 3.32%
10 Grand total 292 100.00%
C
o
u
nt
P
e
r
c
e
nt
DESIGNATION_1
Count 6 0
Percent 25.6 23.6 14.6 14.0 8.3 4.7 4.0
77
3.3 2.0 0.0
Cum % 25.6 49.2 63.8 77.7 86.0 90.7
71
94.7 98.0 100.0100.0
44 42 25 14 12 10
Other
SNAP OPE
RATOR WRIT
TER IRON
ER
MARK ING HEL
PER
FINA L CH
ECKER
K/B OPE
RATO R
PAC KER CHEC
KER
300 250 200 150 100 50 0
100
80
60
40
20
0 Pareto Chart of DESIGNATION_1
Figure.1.5: Pareto for finishing department
In the Finishing department, that Checker, packer, K/B Operator, Final Operator & Helper are major absenteeism as indicated in Figure 1.5.
The reasons for absenteeism amongst the
operators in Finishing department [9,10] is discussed
with the employees and supervisors and the cause
and effect diagram is drawn as shown in Figure 1.6.
Table 1.5: Major Contributors in departments
Sl. No Department Designation
1
Stitching Operator - A
HELPER Operator - B Operator - B+ 2
Finishing CHECKER
PACKER K/B OPERATOR FINAL CHECKER
HELPER
4. IMPROVE PHASE
Through discussions with the managers, supervisors and the employees, the following actions are identified for each cause. The action plans need not be individual or specific in nature rather should be considered to the whole company [11,12].
Table.1.6: Remedial action for improvement
Depart. Design. Actions
Stitching operator - a Training on machine, protective
Gloves to be used helper Protective gloves, masks
should be used operator - b Improving the working
conditions,
Transportation facilities operator - b+ Improving the working conditions, Implementing labour laws
Finishing checker Increase in salary packer Salaries on time k/b operator Training on motivation final checker Incentives to the
operators who exceedingly do well helper Medical help
Implementation: The author conducted brainstorming sessions with the managers, supervisors and the employees. New policies, procedures and incentives are implemented [13,14].
After implementing the some of the action plans, the following data is recorded which is indicated in Table.1.7
Table 1.7: Reduced absenteeism
Period 1 Months
Total Working Days 30 Total No. of Staffs 285 Total Available Days 8550
Absenteeism 496
% Absenteeism 5.80%
Dpo 0.0580
Sigma 3.07
5. CONTROL PHASE
To reduce the employee absenteeism the following control plan is necessary and should be monitored closely by the management [15,16].
Control Plan:
· Labour laws should be implemented in letter and spirit
· Working conditions should drastically improve.
· Medical help should be provided within the plant itself.
· Pick and drop facilities should be provided for all garment employees.
· Incentives should be given by the management for star performers.
· Harassment should be brought the notice of the police.
6. CONCLUSIONS
REFERENCES:
[1] Arsovski, Z., Arsovski, S., Mitrović, Z., Stefanović, M.,: Simulation of Quality Goals: A Missing Link Between Corporate Strategy And Business Process Management.. International Journal for Quality Research, Vol.3, No.4, pp. 317-326
[2] Bhavani, T.A. Suresh D. Tendulkar (2001), ‘Determinants of firm-level export performance: A case study of Indian textile garments and apparel industry”, Journal of International Trade and Economic Development, 10:1, 65-92.
[3] Bruce, M., L. Daly and N. Towers, (2004), “Lean or agile: A solution for supply chain management in the textiles and clothing industry” International Journal of Operations and Production Management, vol. 24, no.2, pp 151-170.
[4] Chandra, P.,(2004) “Competitiveness of Indian Textiles & Garment Industry: Some Perspectives,” A presentation at Indian Institute of Management, Ahmedabad, December.
[5] Chandra, P., (1998),“Technology, Practices, and Competitiveness: The Primary Textiles Industry in Canada, China, and India”, Himalaya Publishing House, Mumbai,.
[6] Chandra,P.,(2005) “The textile and Apparel Industry in India”, Oxford University Press.
[7] Federation of Indian Chambers of Commerce and Industry, (2005), “Trends Analysis of India & China’s Textiles and Apparel Exports to USA - Post MFA”, FICCI, New Delhi, July.
[8] Foster Jr., T., Howard, L., and Shannon, P., (2002), “The Role of Quality Tools In Improving Satisfaction with Government”, The Quality Management Journal, vol. 9, pp.20-31.
[9] George, M., (2002) “Lean Six Sigma, Combining Six Sigma Quality with Lean speed”, McGraw-Hill. [10] Kapuge, A.M. and M. Smith, (2007), “Management practices and performance reporting in the Sri
Lankan apparel sector”, Management Audit Journal, vol. 22, no 3, pp 303- 318.
[11] Karim, S. (2009), “The Impact of Just-in-Time Production Practices on Organizational Performance in the Garments and Textiles Industries in Bangladesh”, Doctoral Thesis, Dhaka University.
[12] Keller, P., (2001), “Recent Trends in Six Sigma”, ASQ’s 55th Annual Quality Congress Proceedings, pp 98-102.
[13] Mihajlović, M. (2010). Quality of Inter-Organizational System (IOS) framework for Supply Chain Management (SCM): Study of six collaborative factors from supplier and customer perspectives. International Journal for Quality Research, 4(3), 181-192.
[14] Mercado, G. (2008). “ Ask the Lean Manufacturing Experts Applying Lean in the Garment Industry” , Thomas Publishing Company
[15] Hoffman, J. and Mehra, S.,(1999), “Management Leadership and Productivity Improvement Programs”, International Journal of Applied Quality Management, vol 2, no. 2, pp. 221-232.
[16] Ray, S., & Das, P. (2011). Improve machining process capability by using Six-Sigma. International Journal for Quality Research, 5(2), 109-122.