Submitted13 January 2016 Accepted 17 February 2016 Published10 March 2016
Corresponding author Philippe Constant,
Academic editor Maria Rosaria Corbo
Additional Information and Declarations can be found on page 15
DOI10.7717/peerj.1782
Copyright
2016 Piché-Choquette et al.
Distributed under
Creative Commons CC-BY 4.0
OPEN ACCESS
H
2
-saturation of high affinity
H
2
-oxidizing bacteria alters the ecological
niche of soil microorganisms unevenly
among taxonomic groups
Sarah Piché-Choquette1, Julien Tremblay2, Susannah G. Tringe3and Philippe Constant1
1INRS-Institut Armand-Frappier, Laval, Quebec, Canada
2Biomonitoring, National Research Council Canada, Montreal, Quebec, Canada 3DOE Joint Genome Institute, Walnut Creek, California, United States of America
ABSTRACT
Soil microbial communities are continuously exposed to H2 diffusing into the soil
from the atmosphere. N2-fixing nodules represent a peculiar microniche in soil where
H2can reach concentrations up to 20,000 fold higher than in the global atmosphere
(0.530 ppmv). In this study, we investigated the impact of H2exposure on soil bacterial
community structure using dynamic microcosm chambers simulating soil H2exposure
from the atmosphere and N2-fixing nodules. Biphasic kinetic parameters governing H2
oxidation activity in soil changed drastically upon elevated H2exposure, corresponding
to a slight but significant decay of high affinity H2-oxidizing bacteria population,
accompanied by an enrichment or activation of microorganisms displaying low-affinity for H2. In contrast to previous studies that unveiled limited response by a few species,
the relative abundance of 958 bacterial ribotypes distributed among various taxonomic groups, rather than a few distinct taxa, was influenced by H2exposure. Furthermore,
correlation networks showed important alterations of ribotype covariation in response to H2exposure, suggesting that H2affects microbe-microbe interactions in soil. Taken
together, our results demonstrate that H2-rich environments exert a direct influence
on soil H2-oxidizing bacteria in addition to indirect effects on other members of the
bacterial communities.
SubjectsMicrobiology, Soil Science
Keywords Soil, Microbial ecology, Correlation network
INTRODUCTION
Soil microbial communities are continuously exposed to molecular hydrogen (H2). Trace
levels of H2(0.530 ppmv) diffuse into the soil from the global atmosphere, yet higher
concentrations can be found in the rhizosphere of N2-fixing legumes (Constant, Poissant
& Villemur, 2009). Indeed, H2is an obligate by-product of nitrogenase in N2-fixing free
living or symbiotic bacteria, with an H2molecule produced for every reduced N2molecule
(Hoffman, Dean & Seefeldt, 2009). It has been estimated that 240,000 L of H2are produced
soil-nodule interface and ending with sub-atmospheric levels a few centimeters away (La Favre & Focht, 1983;Rasche & Arp, 1989;Witty, 1991). Despite the high concentrations of H2found in legumes rhizosphere, a very small proportion escapes to the atmosphere due
to H2-oxidizing bacteria (HOB) thriving in soil. These microorganisms also play a vital
role in the global budget of H2, being responsible for about 80% (60 Tg H2yr−1) of the
global losses of this trace gas from the atmosphere (Constant, Poissant & Villemur, 2009; Ehhalt & Rohrer, 2009).
Aerobic soil bacteria scavenging H2diffusing from the atmosphere and N2-fixing nodules
encompass a broad range of taxonomic groups. These microorganisms generally possess one or up to four different types of [NiFe]-hydrogenases catalyzing the interconversion of H2into protons and electrons (H2↔2H++2e−). These hydrogenases are classified into
four distinct phylogenetic groups, each displaying particular physiological roles (Constant & Hallenbeck, 2012;Vignais & Billoud, 2007). Hydrogenases encompassing group 1h are generally characterized by a high affinity towards H2((app)Km<100 ppmv), conferring
the ability to oxidize atmospheric H2 (Constant et al., 2010). Genome database mining
of hhyLgene encoding the large subunit of high affinity hydrogenases are differentially distributed inActinobacteria, with few representatives ofProteobacteria,Acidobacteriaand
Chloroflexi (Constant et al., 2011a; Constant et al., 2011b). The energy yield associated with the oxidation of atmospheric H2 is insufficient to support chemolithotrophic
growth and compelling experimental evidence suggest that H2 supplies maintenance
energy requirements and mixotrophic growth in high affinity HOB (Constant et al., 2011a;Constant et al., 2011b;Constant et al., 2010;Greening et al., 2014a;Greening et al., 2015). The distribution of the other [NiFe]-hydrogenase groups is broader, including methanogenic archaea andCyanobacteria(Vignais & Billoud, 2007).Ralstonia eutropha
andBradyrhizobium japonicum, part of the knallgas bacteria functional group, are able to scavenge H2diffusing from nodules in the presence of O2, yet they are unable to use
atmospheric H2 due to the low-affinity ((app)Km>1,000 ppmv) and high H2threshold
concentration of their [NiFe]-hydrogenases (Conrad, Aragno & Seiler, 1983). Knallgas bacteria can use H2 as a sole or supplementary energy source in chemolithotrophic or
mixotrophic growth, respectively. The co-occurrence of these two sub-populations of HOB, as defined by substrate affinity, is supported by the biphasic kinetics governing H2
oxidation activity in soil (Häring & Conrad, 1994).
Laboratory incubations simulating H2fluxes from N2-fixing nodules demonstrated that
soil bacterial community composition changed upon H2exposure (Osborne, Peoples &
Janssen, 2010;Stein et al., 2005;Zhang, He & Dong, 2009). However, methods previously used provided a low taxonomic resolution and coverage of bacterial communities responding to H2exposure. Here, we revisited these experiments using a combination of
high-throughput sequencing of the bacterial 16S rRNA gene and an H2metabolism analysis
to compare microbial community structure in dynamic microcosm chambers simulating soil H2exposure from the atmosphere and from N2-fixing nodules, corresponding to
unsaturating and saturating H2concentrations for high affinity hydrogenases, respectively.
indirect impacts on the whole soil bacterial community through competitive and synergistic microbe-microbe interactions.
MATERIALS AND METHODS
Soil sampleSoil sample was collected in an agricultural land located in St. Claude (Québec, Canada) on the south shore of the St. Lawrence River (45.6809◦ N,−71.9969◦ W). The field is managed with fallow, potatoes and maize crop rotation. Potato seedlings (approximately 10 cm height) were present on the site during sampling in July 2013. The top layer of the A-horizon (0–10 cm depth) was collected, stored in plastic bags at 4◦C and processed within a week. Soil was air-dried for 48 h in the laboratory and sieved (2 mm mesh size) through a vibratory sieve shaker AS 200R (Retsch GmbH, Haan, Germany) before preparation of soil microcosms. Soil was classified as sandy clay loam according to soil textural class parameters identified with the hydrometer method (Bouyoucos, 1936). Soil pH was determined with 1:2 soil-water suspensions with an Accumet pH-meter (Fisher Scientific, Hampton, NH). Total carbon (3.1±0.3%) and total nitrogen (0.3±0.0%) content were determined using an elemental combustion system using the protocol described inKhdhiri et al. (2015).
Controlled H2exposure in dynamic soil microcosm chambers
Dynamic microcosm chambers were designed to expose soil to controlled levels of H2(Fig. S1). Microcosm chambers consisted of 0.9 L cell culture flasks (Corning, Tewksbury, MA, USA) equipped with a rubber stopper fitted with two 1/8’’ outside diameter PTFE (Teflon) tubes: the first supplied gas mixture to the microcosm chamber and the second was vented to the atmosphere. Synthetic gas mixtures supplied the microcosm chambers at a flowrate of 40 ml min−1, resulting in a dynamic headspace with a residence time of approximately
22 min in the enclosures. Gas mixtures were bubbled in water before entering in microcosms to prevent soil dryness. Two different H2treatments were applied in parallel incubations.
The first treatment (designated microcosms eH2(a) and eH2(b)), named elevated H2(eH2),
consisted of exposing soil to a dynamic headspace comprising 525 ppmv H2in synthetic air,
simulating H2concentrations detected around N2-fixing nodules in soil (Hunt & Layzell,
1993). The second was a control treatment (designated microcosms aH2(a) and aH2(b)),
named atmospheric H2(aH2), where soil was exposed to a dynamic headspace comprising
0.54 ppmv H2in synthetic air, representing H2concentrations found in the atmosphere.
Both treatments were replicated, resulting in four soil microcosms in total. Each microcosm chamber contained 200 g(dw)soil at the beginning of the incubation period. This amount of
soil ensured sufficient material for the monitoring of microbiological and physicochemical variables throughout the incubation period, while avoiding diffusion limitation of the H2soil uptake rate measurements. Diffusion limitation was precluded since preliminary
experiments using the same microcosm setup showed proportional H2uptake activity as
a function of the amount of soil in the chamber using 150, 200 and 250 g(dw)soil samples
oxidation rate measurements (see below). A decrease in soil pH was observed over the course of the incubation (from pH 5.9 ±0.2 to 5.1±0.1) in all microcosms, without distinction between aH2and eH2treatments. Soil moisture was monitored using standard
gravimetric method and maintained at 26±5% throughout the incubation period. Blank (empty) microcosms incubated prior to the experiment did not show any H2oxidation or
production activity.
H2 uptake activity
High affinity H2 oxidation activity was routinely monitored throughout the incubation
of the soil microcosms. Briefly, microcosms were disconnected from their respective gas supply, flushed 5 min with a synthetic gas mixture (0.54 ppmv H2) and tightly closed with
rubber septum caps. The 5-min flush was shown sufficient to avoid residual H2degassing
that would otherwise have led to an underestimation of H2oxidation rate. A defined
volume of H2 gas mixture (525±10 ppmv H2 GST-Welco, PA, USA.) was injected to
obtain an initial concentration of approximately 3 ppmv in the static headspace. Decrease of the H2mixing ratio was monitored as a function of time by analyzing aliquots (10 ml) of
the headspace air in a ta3000R gas chromatograph equipped with a reduction gas detector (Ametek Process InstrumentsR, DE, USA.) as previously described (Khdhiri et al., 2015). Considering the low level of H2added in the headspace, H2uptake reflected the activity of
high affinity HOB, knallgas bacteria showing low affinity for H2being unable to use these
trace amounts of H2 (Conrad, Aragno & Seiler, 1983). The biphasic kinetic parameters
governing H2oxidation activity in soil (i.e.,(app)Km and(app)Vmax) were measured at the
end of the 10-day incubation period after the addition of specified amounts of pure H2
into the headspace of the microcosms, as previously described (Schuler & Conrad, 1990).
DNA extraction, qPCR and high-throughput sequencing of PCR-amplified bacterial 16S rRNA gene
Soil subsamples (approximately 10 g per subsample, without replacement) were collected in the four microcosms after 0, 1, 3, 5, 7 and 10 incubation days to investigate the taxonomic structure of microbial communities. The extraction of total genomic DNA was performed using the FastDNA SPIN kit for SoilR (MP Biomedicals, Solon, OH, USA.). DNA was eluted in 100µL nuclease-free water. Quality of the DNA was then examined on agarose gels and samples were quantified using Quantifluor dsDNA SystemR (Promega, Fitchburg, WI, USA). The V4 region of bacterial 16S rRNA gene was PCR amplified (Table S1) and sequenced on an Illumina MiSeq 2000 instrument as multiplexed libraries to generate paired-end reads (2×250 bp). Quantification of bacterial 16S rRNA andhhyLgenes was done by qPCR followingKhdhiri et al. (2015).
Quality control of sequencing reads
DUK (Li, Copeland & Han, 2011), a Kmer-based sequence matching tool, was then used to remove common sequencing contaminants as well as PhiX sequences added as control. Afterwards, sequences were trimmed to remove low quality ends and a general quality control was also applied. All reads containing at least a singleN (ambiguous base), an average quality score of less than 30 or more than 15 bases with a quality score under 20 were discarded. The minimum and maximum read length were respectively set to 200 and 300 bases for the assembled paired-reads. Reverse primers were also removed using the
truncate_reverse_primer function implemented in QIIME. Raw sequences were deposited in the Sequence Read Archive of the National Center for Biotechnology Information under the BioprojectPRJNA295403.
Clustering and taxonomic identification of sequencing reads
Processed 2,554,543 high quality reads were clustered into OTUs (Operational Taxonomic Units) using the functionpick_otusimplemented in QIIME along with the USEARCH (Edgar, 2010) clustering algorithm. Sequences dereplication was performed at 100% sequence identity and clusters were formed by denoising unique sequences at 99% identity. Singletons were removed to avoid diversity bias. Remaining clusters were filtered using UCHIME (Edgar et al., 2011) chimera filter inde novomode, followed by a reference-based filter step against the Gold reference database. These 2 chimera scanning steps allow a better removal of chimeras by removing sequences flagged as chimeras by any of the two methods. Chimera-checked clusters were then clustered into OTUs at 97% identity threshold also using the functionpick_otuswith the USEARCH software. Taxonomic identification of OTUs was performed using theassign_taxonomy function along with the naïve Bayesian Ribosomal Database Project (RDP) classifier 2.7 (Wang et al., 2007). Taxonomy was assigned based on the Greengenes taxonomy with the 16S rRNA Greengenes reference database (DeSantis et al., 2006). A rarefaction step was applied to the OTU libraries to standardize all libraries, by random subsampling, to the lowest amount of sequences (74,316 reads) to avoid bias introduced due to unequal sequencing efforts of the samples. This rarefied OTU table comprising the frequency distribution of the OTUs in each sample was used in downstream statistical and co-occurrence network analyses.
Statistical analyses
Statistical analyses were performed using the software R version 3.0.2 (R Development Core Team, 2008). Pairwise comparison of H2 uptake activities in soil microcosms
incubated under aH2and eH2exposure treatments was tested using one-way analysis
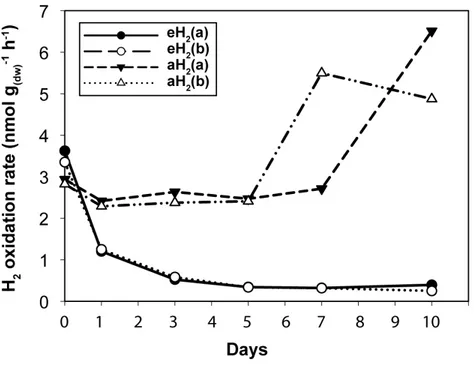
Figure 1 High affinity H2oxidation rates.Time series of the high-affinity H2oxidation rate measured in soil microcosms exposed to aH2or eH2throughout the incubation period.
was done by performing 999 permutations of the OTU table dataset separately across the samples and comparing the observed similarity score of each cluster against the expected values under the null hypothesis using the similarity profile tool (SIMPROF) implemented in the package ‘‘clustsig’’ 1.1 (Clarke, Somerfield & Gorley, 2008). Pairwise comparison of relative abundance of OTUs having a higher contribution than average to explain the two dimensions of the PCA space in soil microcosms incubated under aH2and eH2exposure
treatments was tested using Kruskal–Wallis andpost hocTukey test. Pairwise comparison of relative abundance of all OTUs in soil microcosms incubated under aH2 and eH2
exposure treatments was tested using the likelihood ratio test using the package ‘‘edgeR.’’ Covariation among OTUs during the incubation under controlled H2levels was analyzed
by correlation networks using the package ‘‘WGCNA’’ 1.41 (Langfelder & Horvath, 2008). A detailed methodology for the computation of correlation networks is provided in
Text S1.
RESULTS AND DISCUSSION
Impact of H2 exposure on the distribution and activity of HOB
Agricultural soil microcosms were incubated under two different H2level treatments. The
first treatment simulated soil exposure to atmospheric level of H2(aH2; 0.54 ppmv), while
the second simulated high affinity hydrogenases substrate saturation (eH2; 525 ppmv).
High affinity H2 oxidation rates were not significantly different (ANOVA,P>0.05)
between the two pairs of microcosms at the beginning of the incubation (Fig. 1). The influence of H2 exposure could already be observed after 24 h. From hour 24 to day
Figure 2 Time series of qPCR data.Time series of (A)hhyLand (B) 16S rRNA gene abundance in soil as determined by qPCR.
eH2, while an increase of this uptake rate was measured in microcosms exposed to aH2
levels. This trend was maintained over the course of the incubation, with an oxidation rate of 6.2 ±1.9 and 0.3±0.1 nmol g(dw)−1 h−1in aH2and eH2treatments at the end of
the experiment, respectively. This response of H2oxidation rate was accompanied by an
alteration in the abundance of presumptive high affinity HOB in soil. The abundance of hhyL gene determined by qPCR did not change over the course of the incubation under aH2(exponential regression,P=0.06), while a slight but significant exponential
decay (exponential regression,P=0.02) was observed under eH2(Fig. 2A). Indeed, the
bank under a mixotrophic survival energy mode (Constant et al., 2010;Constant, Poissant & Villemur, 2008;Liot & Constant, 2015), whileMycobacteriumexpress the enzyme in the exponential and stationary phases for mixotrophic growth as well as survival (Berney & Cook, 2010;Greening et al., 2015b; Greening et al., 2014b). Under axenic cultivation conditions, eH2level would be expected to favour an increase ofMycobacteriumbiomass
and persistence of streptomycetes spores. It should be noted that our qPCR data cannot differentiate between active and inactive cells but the decreasing trend ofhhyLcopy number in soil exposed to eH2suggests that H2was not sufficient to promote growth and persistence
of high affinity HOB.
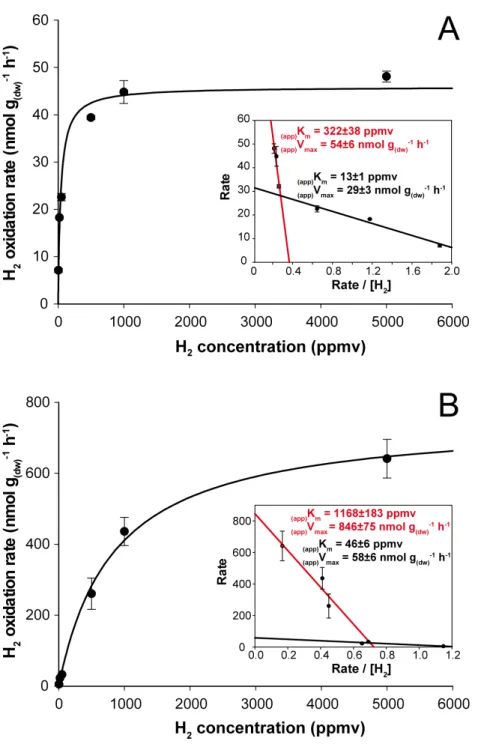
H2soil exposure exerted a significant impact on the kinetic parameters governing H2
oxidation activity in soil. At the end of the incubation, microcosms exposed to aH2level
displayed(app)Kmof 40±5 ppmv (Fig. 3A), while microcosms exposed to eH2showed lower
affinity towards H2with an(app)Kmof 838±163 ppmv (Fig. 3B). Similar observations were
obtained byDong & Layzell (2001), where soil exposed to elevated levels of H2(600 ppmv)
displayed an(app)Kmof 1,028 ppmv H2, while soil exposed to low H2level (0.55 ppmv) was
characterized by an(app)Kmof 40 ppmv. The biphasic kinetic parameters characteristics of low and high affinity HOB were also computed using Eadie-Hofstee plots to highlight high- and low-affinity H2uptake activities in both H2 treatments. The H2 oxidation
activity was mainly catalyzed by bacteria demonstrating intermediate and high-affinity in aH2 treatment (Fig. 3A, insert), while H2-oxidation activity by bacteria displaying
low- and high-affinity for H2were detectable in the eH2treatment (Fig. 3B, insert). Low
H2exposure supported the metabolism of intermediate- to high-affinity HOB, such as
someActinobacteriaspecies ofStreptomyces,RhodococcusandMycobacterium(Berney et al., 2014;Constant et al., 2011b;Golding et al., 2012;Liot & Constant, 2015;Meredith et al., 2014;Schäfer, Friedrich & Lenza, 2013). Triggering of low-affinity H2 oxidation activity
under eH2treatment might be explained by knallgas bacteria such asProteobacteriaspecies
encompassingRalstonia,VariovoraxandBradyrhizobiumusing H2for mixotrophic growth
(Rittenberg & Goodman, 1969), as they are known to exhibit a H2uptake threshold ranging
from 1 to 200 ppmv H2(Conrad, 1996).
Impact of H2 exposure on soil bacterial community structure
Soil subsamples were collected in the microcosms during the incubation period to evaluate the temporal variation of soil bacterial community structure. H2 treatment did not
influence the abundance of 16S rRNA gene in soil (Fig. 2B). This is in contrast with another study that reported more than twofold increase of the amount of bacterial cells upon elevated H2exposure, but a mistake in the reported H2concentration units by the
authors (i.e., the use of a gas mixture of 2,000 ml H2per L of synthetic air) impairs a sound
comparison with the present investigation (Stein et al., 2005). High-throughput sequencing of PCR-amplified 16S rRNA gene unveiled that bacterial communities were dominated by Proteobacteria(34%),Acidobacteria(20%),Actinobacteria (10%),Verrucomicrobia
(8%) andBacteroidetes(5%) (Fig. S2). Species richness was not affected by H2exposure
(ANOVA,P>0.05), with Shannon indices of 9.38±0.05 and 9.34±0.17 for aH2and
Figure 3 Kinetic parameters governing H2oxidation activity in soil microcosms incubated under (A)
aH2and (B) eH2exposure.Michaelis-Menten graphs are presented with Eadie-Hofstee plots highlighting
the biphasic kinetic of the reaction in the inserts.
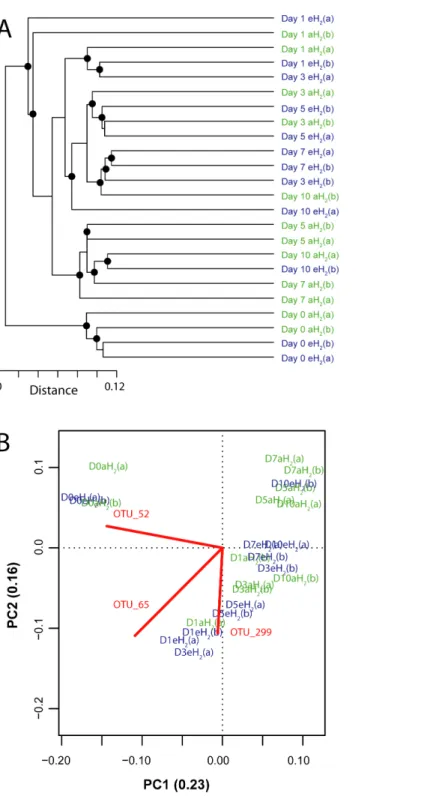
to compare bacterial community profiles from soil subsamples collected in microcosms exposed to different H2concentrations. The four microcosms encompassed the same
cluster before the incubation, indicating high similarity of their initial ribotyping profile
(Fig. 4A). No coherent impact of H2exposure on microbial community structure was
collected after 5 and 7 incubation days were separated with confidence in different clusters, suggesting a response of microbial communities to H2 exposure. This discrimination
was however transient as ribotyping profiles corresponding to the last incubation day could not be discriminated according to their respective H2 treatments (Fig. 4A). The
transient response was likely due to the fact that H2alone was not sufficient to maintain a
sustained change in microbial community structure. Decrease of complex carbon sources and nutrients used along with H2for mixotrophic growth in soil is a potential explanation
for the convergence of the ribotyping profiles after 7 incubations days.
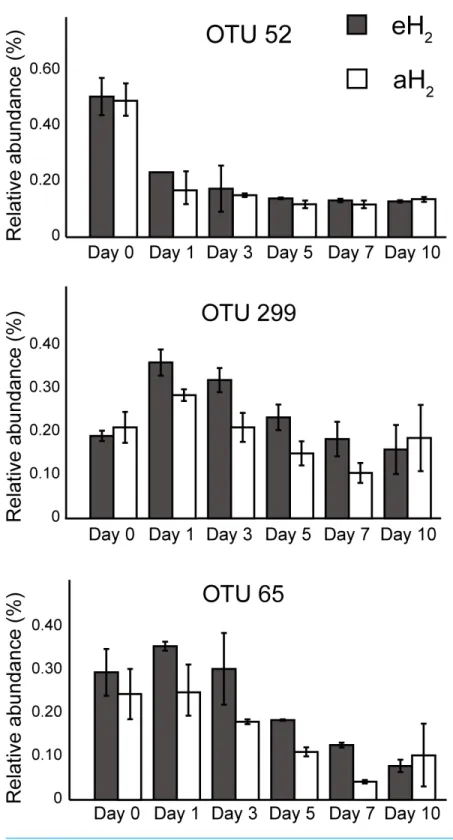
A PCA was computed to identify OTUs contributing to the clusterization of ribotyping profiles. The ordination space defined by the first two components explained 38.6% of the variation observed (Fig. 4B). Three OTUs defined an important proportion of the reduced space represented by both axes (Fig. 5). The relative abundance of OTU 52 (classified as a member of the classBetaproteobacteria) contributed to distinguish the four soil subsamples collected before the incubation from the 20 other subsamples collected after 1, 3, 5, 7 and 10 incubation days along the first axis as it decreased after the beginning of the incubation period (Kruskal–Wallis,P<0.05). Two OTUs classified as members of the orderBacillales
(OTUs 65 and 299) contributed to discriminate both H2treatments in the ordination
space after 5 and 7 incubation days (Kruskal–Wallis,P<0.05). These OTUs were more
abundant in microcosms exposed to eH2until day 10, where they reached a similar relative
abundance in aH2and eH2treatments. The transient response of these OTUs in eH2
treatment could be a direct consequence of H2exposure as representatives of the genus Bacilluspossess putative membrane-bound type 1a and 1d [NiFe]-hydrogenases (Greening et al., 2016).
Conflicting results were obtained in two different studies reporting the impact of H2
soil exposure on bacterial community structure based on 16S rRNA terminal restriction fragment profiles analysis. H2exerted no incidence on ribotyping profile in soil exposed to
250 nmol H2cm−3h−1(500 ppmv H2in artificial air, added at 45 ml min−1), while a single
ribotype related toMycobacteriumincreased in soils upon elevated H2exposure (Osborne,
Peoples & Janssen, 2010). On the other hand, an exposure rate of 33 nmol cm−3 h−1 (79 ppmv H2at 100 cm3min−1) exerted a significant influence on bacterial community
profile, with an increase of T-RFLP peaks belonging toγ-Proteobacteriaand a decrease of
peaks belonging toActinobacteriaandα-Proteobacteriaupon elevated H2exposure (Zhang,
He & Dong, 2009). A likelihood ratio analysis, fitting a negative binomial generalized log-linear model to the sequencing data (McCarthy, Chen & Smyth, 2012;Robinson, McCarthy & Smyth, 2010), unveiled that distribution of 958 OTUs was influenced by H2exposure. The
relative abundance of OTUs responding to H2treatment ranged between 0.001 and 1.8%,
suggesting an incidence of H2on members of the rare biosphere and abundant taxa. The
influence of H2was uneven among different taxonomic groups as different representatives
of the same taxa (i.e., OTUs classified at the phylum and the order taxonomic levels) were found to be favored or disfavored in response to eH2exposure (Table 1). Even though the
uneven response among taxonomic groups impairs prediction of H2exposure on metabolic
Figure 4 Influence of H2exposure on bacterial ribotyping profile.(A) UPGMA agglomerative
Figure 5 OTUs of interest to explain the PCA.Time series of the relative abundance of the 3 OTUs having a higher contribution than average to explain the two dimensions of the PCA space in soil microcosms. The average and standard deviation measured in replicated microcosms are represented. The closest taxonomic affiliations of OTUs 52, 299 and 65 are, respectively, the bacterial orderMND1
Table 1 Summary of OTUs showing different relative abundance in eH2and aH2treatments
(Likeli-hood ratio test,P<0.05). Altogether, 406 OTUs were more abundant in eH2and 552 were more
abun-dant in aH2. The eH2and aH2rows indicate the treatment in which the identified phylotypes are more abundant. A single or the two most abundant OTUs are identified for each phylum. A list of the 958 OTUs whose distribution was influenced by H2treatments is provided in the raw data file accompanying the ar-ticle.
Treatments Phyla Most abundant OTU (order level)
Proteobacteria(27.6%) Myxococcales
Planctomycetes(10.6%) Gemmatales, Phycisphaerales
Bacteroidetes(9.6%) Sphingobacteriales
Chloroflexi(9.1%) Ktedonobacteria
Acidobacteria(7.1%) Acidobacteriales, Solibacterales
Verrucomicrobia(6.2%) Verrucomicrobiales
Actinobacteria(5.9%) Actinomycetales, Solirubrobacterales
Elusimicrobia(3.0%) FAC88
Gemmatimonadetes(2.7%) Gemmatimonadales
Firmicutes(1.5%) Clostridiales, Bacillales
Archaea(1.0%) Methanobacteriales
Armatimonadetes(0.7%) CH21
Chlorobi(0.2%) SM1B09
eH2
Others (14.8%) –
Proteobacteria(33.9%) Rhodospirillales, Myxococcales
Acidobacteria(11.4%) Solibacterales
Planctomycetes(11.1%) Gemmatales
Chloroflexi(6.2%) Ktedonobacteria, A4b
Bacteroidetes(5.1%) Sphingobacteriales
Actinobacteria(4.3%) Actinomycetales, Acidimicrobiales
Firmicutes(3.8%) Clostridiales
Verrucomicrobia(3.4%) Spartobacteriales
Gemmatimonadetes(2.7%) Gemmatimonadales
Archaea(1.8%) SD-NA (Crenarchaeota)
Elusimicrobia(1.4%) Elusimicrobiales, MVP-88
Armatimonadetes(1.3%) Chthonomonadales, CH21
Chlorobi(0.9%) SM1B09
aH2
Others (12.7%) –
have considerably underestimated the response of soil microbial communities to H2
exposure.
Impact of H2 exposure on the co-occurrence of OTUs
Correlation networks were computed to investigate the impact of H2exposure on the
covariation of OTUs throughout the incubation period and identify OTUs for which the distribution is influenced by H2. Two separate networks were computed: the first for
elevated H2exposure (eH2network) and a second for low H2exposure (aH2network).
significances of measured H2 oxidation rate in explaining network structure were 0.33
and 0.98 in aH2 and eH2networks, again pointing out a significant impact of H2on
soil microbial community structure. Indeed, module eigengenes of five modules were significantly correlated with high-affinity H2oxidation rate time series in eH2network,
while no module was related to the activity in aH2network (Fig. S3). Together, these 5
modules represent 1,140 OTUs, which is more than a third of the whole eH2network (3,154
OTUs). OTUs belonging to one module were hindered by eH2exposure, while members
of the four other modules were favored by eH2treatment. The OTUs belonging to these
five modules were members of the rare biosphere as well as more abundant ribotypes, with relative abundance ranging between 0.001% and 4.3% encompassingProteobacteria,
Chloroflexi,Acidobacteriaas well as other phyla (Fig. S4). Clustering of these OTUs at the class and order levels unveiled that none of the taxonomic groups were restricted to the five modules correlated with H2oxidation rate, supporting the previous observation
that response to H2exposure and the distribution of hydrogenase genes is uneven within
each taxonomic group. The 38 modules in eH2network whose eigengene showed no
significant correlation with H2oxidation rate are ecologically relevant observations since
they represent indirect impacts of H2exposure on soil microbial communities and highlight
a previously overlooked role of H2in shaping potential microbe-microbe cooperation and
competition interactions. Deciphering the impact of these complex interactions on soil biogeochemical processes was beyond the scope of this study but will deserve attention in future investigations.
CONCLUSION
In conclusion, this exploratory study validated our hypothesis that elevated H2exposure
influences the activity of HOB, leading to direct impacts on the HOB but also indirect impact on the whole soil bacterial community through competitive and synergistic microbe-microbe interactions. Indeed, H2soil exposure has an impact on the ecological niche of
bacteria unevenly distributed among taxonomic groups beyond the alteration of HOB reported in early investigations. Our study was limited to a single farmland soil, with two replicated microcosms per treatment. Nonetheless, considering the significant impact that H2exposure has brought to soil bacterial communities, it is reasonable to expect a similar
effect on other soil types. Considering the steep H2concentration gradient surrounding
N2-fixing nodules, from 20,000 ppmv to sub-atmospheric levels along a 4.5 cm radius, the
response of microorganisms might vary as a function of the distance from H2 diffusing
sources as well as soil types, physicochemical conditions and the structural and functional structure of microbial community (Hartmann et al., 2015). The impact of H2and HOB
on soil microbial communities will definitely deserve more attention in soil microbiology. There is a need to further study whether elevated H2 exposure also exerts noticeable
changes in soil ecological functions other than H2oxidation, such as carbon metabolism,
(Zhou et al., 2011). A metagenomics approach on the matter might provide further answers on this rather ubiquitous microniche as well as the succession of hydrogenases along H2
concentration gradients in the environment.
ADDITIONAL INFORMATION AND DECLARATIONS
Funding
This work has been supported by a Natural Sciences and Engineering Research Council of Canada Discovery grant to PC and by the Community Sequencing Program of the Joint Genome Institute (US Department of Energy) to PC, JT and SGT. The work conducted by the US Department of Energy Joint Genome Institute, a DOE Office of Science User Facility, is supported by the Office of Science of the US Department of Energy under Contract No. DE-AC02-05CH11231. The funders had no role in study design, data collection and analysis, decision to publish, or preparation of the manuscript.
Grant Disclosures
The following grant information was disclosed by the authors:
Natural Sciences and Engineering Research Council of Canada Discovery.
Community Sequencing Program of the Joint Genome Institute (US Department of Energy).
US Department of Energy Joint Genome Institute. DOE Office of Science User Facility.
Office of Science of the US Department of Energy: DE-AC02-05CH11231.
Competing Interests
The authors declare there are no competing interests.
Author Contributions
• Sarah Piché-Choquette conceived and designed the experiments, performed the experiments, analyzed the data, contributed reagents/materials/analysis tools, wrote the paper, prepared figures and/or tables, reviewed drafts of the paper.
• Julien Tremblay and Susannah G. Tringe analyzed the data, contributed reagents/mate-rials/analysis tools, reviewed drafts of the paper.
• Philippe Constant conceived and designed the experiments, analyzed the data, contributed reagents/materials/analysis tools, wrote the paper, prepared figures and/or tables, reviewed drafts of the paper.
DNA Deposition
The following information was supplied regarding the deposition of DNA sequences: Raw sequences were deposited in the Sequence Read Archive of the National Center for Biotechnology Information under the BioprojectPRJNA295403.
Data Availability
Supplemental Information
Supplemental information for this article can be found online athttp://dx.doi.org/10.7717/
peerj.1782#supplemental-information.
REFERENCES
Berney M, Cook GM. 2010.Unique flexibility in energy metabolism allows mycobacteria to combat starvation and hypoxia.PLoS ONE5:e8614
DOI 10.1371/journal.pone.0008614.
Berney M, Greening C, Hards K, Collins D, Cook GM. 2014.Three different [NiFe] hydrogenases confer metabolic flexibility in the obligate aerobeMycobacterium smegmatis.Environmental Microbiology16:318–330DOI 10.1111/1462-2920.12320. Bouyoucos G-J. 1936.Directions for making mechanical analyses of soils by the
hydrom-eter method.Soil Science42:225–230DOI 10.1097/00010694-193609000-00007. Clarke KR, Somerfield PJ, Gorley RN. 2008.Testing of null hypotheses in exploratory
community analyses: similarity profiles and biota-environment linkage.Journal of Experimental Marine Biology and Ecology366:56–69
DOI 10.1016/j.jembe.2008.07.009.
Conrad R. 1996.Soil microorganisms as controllers of atmospheric trace gases (H2, CO,
CH4, OCS, N2O, and NO).Microbiological Reviews60:609–640.
Conrad R, Aragno M, Seiler W. 1983.The inability of hydrogen bacteria to utilize atmo-spheric hydrogen is due to threshold and affinity for hydrogen.FEMS Microbiology Letters18:207–210DOI 10.1111/j.1574-6968.1983.tb00479.x.
Constant P, Chowdhury SP, Hesse L, Conrad R. 2011a.Co-localization of atmospheric H2oxidation activity and high affinity H2-oxidizing bacteria in non-axenic soil
and sterile soil amended withStreptomycessp. PCB7.Soil Biology and Biochemistry
43:1888–1893DOI 10.1016/j.soilbio.2011.05.009.
Constant P, Chowdhury SP, Hesse L, Pratscher J, Conrad R. 2011b.Genome data mining and soil survey for the novel group 5 NiFe -hydrogenase to explore the diver-sity and ecological importance of presumptive high-affinity H2-oxidizing Bacteria. Applied and Environmental Microbiology 77:6027–6035DOI 10.1128/AEM.00673-11. Constant P, Chowdhury SP, Pratscher J, Conrad R. 2010.Streptomycetes contributing
to atmospheric molecular hydrogen soil uptake are widespread and encode a putative high-affinity [NiFe]-hydrogenase.Environmental Microbiology12:821–829
DOI 10.1111/j.1462-2920.2009.02130.x.
Constant P, Hallenbeck PC. 2012. Hydrogenase. In: Pandey A, Chang J-S, Hallenbeck PC, Larroche C, eds.Biohydrogen. San Diego: Elsevier B.V, 75–102.
Constant P, Poissant L, Villemur R. 2008.Isolation ofStreptomycessp. PCB7, the first microorganism demonstrating high-affinity uptake of tropospheric H2.ISME Journal
2:1066–1076DOI 10.1038/ismej.2008.59.
Constant P, Poissant L, Villemur R. 2009.Tropospheric H2budget and the response
of its soil uptake under the changing environment.Science of the Total Environment
DeSantis TZ, Hugenholtz P, Larsen N, Rojas M, Brodie EL, Keller K, Huber T, Dalevi D, Hu P, Andersen GL. 2006.Greengenes, a chimera-checked 16S rRNA gene database and workbench compatible with ARB.Applied and Environmental
Micro-bioly72:5069–5072DOI 10.1128/AEM.03006-05.
Dong Z, Layzell DB. 2001.H2oxidation, O2uptake and CO2fixation in hydrogen
treated soils.Plant and Soil229:1–12DOI 10.1023/A:1004810017490. Dong Z, Wu L, Kettlewell B, Caldwell CD, Layzell DB. 2003.Hydrogen
fertiliza-tion of soils—is this a benefit of legumes in rotafertiliza-tion?Plant, Cell & Environment
26:1875–1879DOI 10.1046/j.1365-3040.2003.01103.x.
Edgar RC. 2010.Search and clustering orders of magnitude faster than BLAST. Bioinfor-matics26:2460–2461DOI 10.1093/bioinformatics/btq461.
Edgar RC, Haas BJ, Clemente JC, Quince C, Knight R. 2011.UCHIME improves sensitivity and speed of chimera detection.Bioinformatics27:2194–2200
DOI 10.1093/bioinformatics/btr381.
Ehhalt DH, Rohrer F. 2009.The tropospheric cycle of H2: a critical review.Tellus B
61:500–535DOI 10.1111/j.1600-0889.2009.00416.x.
Golding AL, Zou Y, Yang X, Flynn B, Dong Z. 2012.Plant growth promoting H2
-oxidizing bacteria as seed inoculants for cereal crops.Agricultural Sciences3:510–516
DOI 10.4236/as.2012.34060.
Greening C, Berney M, Hards K, Cook GM, Conrad R. 2014a.A soil actinobacterium scavenges atmospheric H2using two membrane-associated, oxygen-dependent NiFe
hydrogenases.Proceedings of the National Academy of Sciences of the United States of
America111:4257–4261DOI 10.1073/pnas.1320586111.
Greening C, Biswas A, Carere CR, Jackson CJ, Taylor MC, Stott MB, Cook GM, Morales SE. 2016.Genomic and metagenomic surveys of hydrogenase distribution indicate H is a widely utilised energy source for microbial growth and survival.ISME Journal
10:761–777DOI 10.1038/ismej.2015.153.
Greening C, Constant P, Hards K, Morales SE, Oakeshott JG, Russell RJ, Taylor MC, Berney M, Conrad R, Cook GM. 2015.Atmospheric hydrogen scavenging: from enzymes to ecosystems.Applied and Environmental Microbiology 81:1190–1199
DOI 10.1128/AEM.03364-14.
Greening C, Villas-Boas SG, Robson JR, Berney M, Cook GM. 2014b.The growth and survival ofMycobacterium smegmatisis enhanced by co-metabolism of atmospheric H2.PLoS ONE9:e103034DOI 10.1371/journal.pone.0103034.
Häring V, Conrad R. 1994.Demonstration of two different H2-oxidizing activities in soil
using an H2consumption and a tritium exchange assay.Biology and Fertility of Soils
17:125–128DOI 10.1007/BF00337744.
Hartmann M, Frey B, Mayer J, Mader P, Widmer F. 2015.Distinct soil microbial diver-sity under long-term organic and conventional farming.ISME Journal9:1177–1194
DOI 10.1038/ismej.2014.210.
Hoffman BM, Dean DR, Seefeldt LC. 2009.Climbing nitrogenase: toward a mecha-nism of enzymatic nitrogen fixation.Accounts of Chemical Research42:609–619
Hunt S, Layzell DB. 1993.Gas exchange of legume nodules and the regulation of nitrogenase activity.Annual Review of Plant Physiology and Plant Molecular Biology
44:483–511DOI 10.1146/annurev.pp.44.060193.002411.
Khdhiri M, Hesse L, Popa ME, Quiza L, Lalonde I, Meredith LK, Röckmann T, Constant P. 2015.Soil carbon content and relative abundance of high affinity H2-oxidizing bacteria predict atmospheric H2soil uptake activity better than
soil microbial community composition.Soil Biology and Biochemistry85:1–9
DOI 10.1016/j.soilbio.2015.02.030.
Kuczynski J, Stombaugh J, Walters WA, González A, Caporaso JG, Knight R. 2011. Using QIIME to analyze 16S rRNA gene sequences from microbial communities.
Current Protocols in Bioinformatics36:10.7.1–10.7.20.
La Favre JS, Focht DD. 1983.Conservation in soil of H2liberated from N2fixation by
Hup−nodules.Applied and Environmental Microbiology 46:304–311.
Langfelder P, Horvath S. 2008.WGCNA: an R package for weighted correlation network analysis.BMC Bioinformatics9:559DOI 10.1186/1471-2105-9-559.
Langille MGI, Zaneveld J, Caporaso JG, McDonald D, Knights D, Reyes JA, Clemente JC, Burkepile DE, Vega Thurber RL, Knight R, Beiko RG, Huttenhower C. 2013. Predictive functional profiling of microbial communities using 16S rRNA marker gene sequences.Nature Biotechnology31:814–821DOI 10.1038/nbt.2676.
Legendre P, Gallagher E. 2001.Ecologically meaningful transformations for ordination of species data.Oecologia129:271–280 DOI 10.1007/s004420100716.
Li M, Copeland A, Han J. 2011. DUK-A Fast and efficient Kmer based sequence
matching tool.Available athttps:// publications.lbl.gov/ islandora/ object/ ir%3A155200 (accessed 17 February 2016).
Liot Q, Constant P. 2015.Breathing air to save energy—new insights into the eco-physiological role of high-affinity [NiFe]-hydrogenase inStreptomyces avermitilis.
MicrobiologyOpen5:47–59DOI 10.1002/mbo3.310.
Magoc T, Salzberg SL. 2011.FLASH: fast length adjustment of short reads to improve genome assemblies.Bioinformatics27:2957–2963
DOI 10.1093/bioinformatics/btr507.
McCarthy DJ, Chen Y, Smyth GK. 2012.Differential expression analysis of multifactor RNA-Seq experiments with respect to biological variation.Nucleic Acids Research
40:4288–4297DOI 10.1093/nar/gks042.
Meredith LK, Rao D, Bosak T, Klepac-Ceraj V, Tada KR, Hansel CM, Ono S, Prinn RG. 2014.Consumption of atmospheric hydrogen during the life cycle of soil-dwelling actinobacteria.Environmental Microbiology Reports6:226–238
DOI 10.1111/1758-2229.12116.
Osborne CA, Peoples MB, Janssen PH. 2010.Detection of a reproducible, single-member shift in soil bacterial communities exposed to low levels of hydrogen.
Applied and Environmental Microbiology 76:1471–1479DOI 10.1128/AEM.02072-09. Rasche ME, Arp DJ. 1989.Hydrogen inhibition of nitrogen reduction by
nitro-genase in isolated soybean nodule bacteroids.Plant Physiology91:663–668
R Development Core Team. 2008.R: a language and environment for statistical comput-ing. Vienna: R Foundation for Statistical Computing.
Rittenberg SC, Goodman NS. 1969.Mixotrophic growth ofHydrogenomonas eutropha.
Journal of Bacteriology98:617–622.
Robinson MD, McCarthy DJ, Smyth GK. 2010.edgeR: a Bioconductor package for differential expression analysis of digital gene expression data.Bioinformatics
26:139–140DOI 10.1093/bioinformatics/btp616.
Schäfer C, Friedrich B, Lenza O. 2013.Novel, oxygen-insensitive group 5 [NiFe]-hydrogenase inRalstonia eutropha.Applied and Environmental Microbiology
79:5137–5145DOI 10.1128/AEM.01576-13.
Schuler S, Conrad R. 1990.Soils contain two different activities for oxidation of hydro-gen.FEMS Microbiology Letters73:77–83DOI 10.1111/j.1574-6968.1990.tb03927.x. Stein S, Selesi D, Schilling R, Pattis I, Schmid M, Hartmann A. 2005.Microbial activity and bacterial composition of H2-treated soils with net CO2fixation.Soil Biology & Biochemistry37:1938–1945DOI 10.1016/j.soilbio.2005.02.035.
Tremblay J, Singh K, Fern A, Kirton ES, He S, Woyke T, Lee J, Chen F, Dangl JL, Tringe SG. 2015.Primer and platform effects on 16S rRNA tag sequencing.Frontiers in Microbiology6:1–15DOI 10.3389/fmicb.2015.00771.
Vignais PM, Billoud B. 2007.Occurrence, classification, and biological function of hy-drogenases: an overview.Chemical Reviews107:4206–4272DOI 10.1021/cr050196r. Wang Q, Garrity GM, Tiedje JM, Cole JR. 2007.Naïve bayesian classifier for rapid
assignment of rRNA sequences into the new bacterial taxonomy.Applied and
Environmental Microbiology73:5261–5267DOI 10.1128/AEM.00062-07.
Witty JF. 1991.Microelectrode measurements of hydrogen concentrations and gradients in legume nodules.Journal of Experimental Botany42:765–771
DOI 10.1093/jxb/42.6.765.
Zhang Y, He X, Dong ZM. 2009.Effect of hydrogen on soil bacterial community structure in two soils as determined by terminal restriction fragment length poly-morphism.Plant and Soil320:295–305DOI 10.1007/s11104-009-9894-3.