BGD
12, 13215–13240, 2015
pH buffering in neutral-alkaline soils
W. Luo et al.
Title Page
Abstract Introduction
Conclusions References
Tables Figures
◭ ◮
◭ ◮
Back Close
Full Screen / Esc
Printer-friendly Version
Interactive Discussion
Discussion
P
a
per
|
Discussion
P
a
per
|
Discussion
P
a
per
|
Discussion
P
a
per
|
Biogeosciences Discuss., 12, 13215–13240, 2015 www.biogeosciences-discuss.net/12/13215/2015/ doi:10.5194/bgd-12-13215-2015
© Author(s) 2015. CC Attribution 3.0 License.
This discussion paper is/has been under review for the journal Biogeosciences (BG). Please refer to the corresponding final paper in BG if available.
Contrasting pH bu
ff
ering patterns in
neutral-alkaline soils along a 3600 km
transect in northern China
W. Luo1,5, P. N. Nelson2, M.-H. Li1,3, J. Cai1,5, Y. Zhang1,5, Y. Zhang4, Y. Shan1, R. Wang1,5, X. Han1, and Y. Jiang1
1
State Key Laboratory of Forest and Soil Ecology, Institute of Applied Ecology, Chinese Academy of Sciences, Shenyang 110164, China
2
College of Science, Technology and Engineering, James Cook University, Cairns, Qld 4870, Australia
3
Swiss Federal Research Institute WSL, Zuercherstrasse 111, 8903 Birmensdorf, Switzerland 4
College of Environment Science, Shenyang University, Shenyang 110044, China 5
University of Chinese Academy of Sciences, Beijing 100049, China
Received: 23 June 2015 – Accepted: 28 July 2015 – Published: 17 August 2015
Correspondence to: Y. Jiang ([email protected])
BGD
12, 13215–13240, 2015
pH buffering in neutral-alkaline soils
W. Luo et al.
Title Page
Abstract Introduction
Conclusions References
Tables Figures
◭ ◮
◭ ◮
Back Close
Full Screen / Esc
Printer-friendly Version
Interactive Discussion
Discussion
P
a
per
|
Discussion
P
a
per
|
Discussion
P
a
per
|
Discussion
P
a
per
|
Abstract
Soil pH buffering capacity (pHBC) plays a crucial role in predicting acidification rates, yet its large-scale patterns and controls are poorly understood, especially for neutral-alkaline soils. Here, we evaluated the spatial patterns and drivers of pHBC along a 3600 km long transect (1900 km sub-transect with carbonate containing soils and 5
1700 km sub-transect with non-carbonate containing soils) across northern China. Soil pHBC was greater in the carbonate containing soils than in the non-carbonate contain-ing soils. Acid addition decreased soil pH in the non-carbonate containcontain-ing soils more markedly than in the carbonate containing soils. Within the carbonate soil sub-transect, soil pHBC was positively correlated with cation exchange capacity (CEC), carbonate 10
content and exchangeable sodium (Na) concentration, but negatively correlated with initial pH and clay content, and not correlated with soil organic carbon (SOC) content. Within the non-carbonate sub-transect, soil pHBC was positively related to initial pH, clay content, CEC and exchangeable Na concentration, but not related to SOC content. Carbonate content was the primary determinant of pHBC in the carbonate containing 15
soils and CEC was the main determinant of buffering capacity in the non-carbonate containing soils. Soil pHBC was positively related to aridity index and carbonate con-tent across the carbonate containing soil sub-transect. Our results indicated that mech-anisms controlling pHBC differ among neutral-alkaline soils of northern China, espe-cially between carbonate and non-carbonate containing soils, leading to different rates, 20
risks, and impacts of acidification. This understanding should be incorporated into the acidification risk assessment and landscape management in a changing world.
1 Introduction
Chronic acid deposition can potentially alter biogeochemistry of ecosystems, acidify soils, reduce availability of some nutrients, aggravate aluminum and manganese tox-25
BGD
12, 13215–13240, 2015
pH buffering in neutral-alkaline soils
W. Luo et al.
Title Page
Abstract Introduction
Conclusions References
Tables Figures
◭ ◮
◭ ◮
Back Close
Full Screen / Esc
Printer-friendly Version
Interactive Discussion
Discussion
P
a
per
|
Discussion
P
a
per
|
Discussion
P
a
per
|
Discussion
P
a
per
|
in terrestrial ecosystems (Blake et al., 1999; Chen et al., 2013; de Vries et al., 2014; Hoegh-Guldberg, 2007; Vet et al., 2014; Yang et al., 2012; Bolan et al., 2003). The primary components of acid deposition around the world are nitrogen oxides and sulfur dioxide, largely originating from agricultural fertilizer application and fossil-fuel combus-tion (Barak, 1997; Dentener et al., 2006; Lu et al., 2014; Pan et al., 2013). Emerging 5
evidence indicates that soil acidity may play a crucial role in regulating vegetation com-munity structure and functions. For instance, soil acidity was shown to explain most of the variations in herb species richness in calcareous grasslands in the UK (van den Berg et al., 2011). Thus, it is imperative to focus our attention on the direction and rate of soil acidification processes.
10
Soil pHBC and acid inputs can be considered as two determinants of the soil acidifi-cation processes. Whereas acid inputs are fairly well documented, the patterns of soil pHBC across landscapes are not (Yang et al., 2012; Wong et al., 2013). Soil pHBC reg-ulates the effect of acid deposition on terrestrial ecosystems by influencing the extent of soil pH change (Magdoffand Bartlett, 1985; Lu et al., 2015; Nelson and Su, 2010). 15
Hence, measurement or estimation of soil pHBC is clearly beneficial for predicting the rate of soil acidification in response to predicted rates of acid deposition (Vet et al., 2014; Wong et al., 2013; Lu et al., 2015).
Recent studies have revealed that soil pHBC is governed mostly by acidic functional groups, dissolution/precipitation of carbonates and cation exchange capacity (CEC), 20
in soils with pH>4.5 (Aitken, 1992; Bloom, 2000; Nelson and Su, 2010). Soil organic matter is a pH buffer, mostly due to weakly acidic functional groups such as carboxyl and phenol (Aitken, 1992; Bloom, 2000). Soil carbonates and non-acidic exchangeable cations can also buffer pH; carbonates consume added H+and exchangeable non-acid cations exchange with H+, removing it from solution. In addition, climate can also influ-25
car-BGD
12, 13215–13240, 2015
pH buffering in neutral-alkaline soils
W. Luo et al.
Title Page
Abstract Introduction
Conclusions References
Tables Figures
◭ ◮
◭ ◮
Back Close
Full Screen / Esc
Printer-friendly Version
Interactive Discussion
Discussion
P
a
per
|
Discussion
P
a
per
|
Discussion
P
a
per
|
Discussion
P
a
per
|
bonates in soils with high pH (>7.5), by CEC in soils with intermediate pH (4.5–7.5) and by aluminum compounds in soils with low pH (<4.5) (Bowman et al., 2008; Lieb et al., 2011). However, the controls of soil pHBC in neutral-alkaline soils have not re-ceived as much attention as those in acidic soils (Yang et al., 2012; Wong et al., 2013). The arid and semi-arid regions of northern China comprise one of the largest con-5
tiguous biomes with neutral-alkaline soils on the earth’s surface (Dixon et al., 2014). In these regions, soil pH in the surface layer has declined significantly over the last two decades, with an overall decrease of 0.63 units (Yang et al., 2012). Atmospheric nitrogen deposition (dry and wet) is expected to remain high over the next 50 years (Dentener et al., 2006; Liu et al., 2013; Yan et al., 2011; Zhao, 2009). High atmospheric 10
sulfur deposition (dry and wet) is also predicted to continue in the short term in these regions, despite stricter regulation of sulfur dioxide emissions being implemented in recent years (Pan et al., 2013; Zhang et al., 2012; Zhao, 2009; Hijmans et al., 2005). Hence, soil acidification may continue for a long time (Guo et al., 2010; Pan et al., 2013; Lieb et al., 2011), posing a severe ecological threat to these ecosystems (Den-15
tener et al., 2006; Dixon et al., 2014; Yang et al., 2012). Nonetheless, there has been no comprehensive assessment of the extent, trends and mechanisms of soil pH decline in response to acid deposition across these ecosystems.
To address this knowledge gap, we evaluated the spatial patterns and controls of soil pHBC along a 3600 km transect across the neutral-alkaline soils of northern China. We 20
BGD
12, 13215–13240, 2015
pH buffering in neutral-alkaline soils
W. Luo et al.
Title Page
Abstract Introduction
Conclusions References
Tables Figures
◭ ◮
◭ ◮
Back Close
Full Screen / Esc
Printer-friendly Version
Interactive Discussion
Discussion
P
a
per
|
Discussion
P
a
per
|
Discussion
P
a
per
|
Discussion
P
a
per
|
2 Materials and methods
2.1 Study area and sampling
The arid and semi-arid regions of northern China are extensive, have strong spatial climatic variability and are important for global ecological security. These regions are predominantly characterized by a dry, continental climate. Mean annual precipitation 5
(MAP) ranges from 34 to 436 mm, generally decreasing from east to west, and mean annual temperature (MAT) ranges from −3 to 10◦C, generally increasing from east to west. The most common soil types are chestnut soil, brown calcic soil and gray-brown desert soil (Chinese classification), distributed in that order along a gradient from east to west. Some soils in these regions contain considerable carbonate but 10
others do not; soil fertility and pH are significantly affected by carbonate content (Yang et al., 2012). The main vegetation types are meadow grasslands, typical grasslands and desert grasslands, distributed in that order from east to west. More details are given by Luo et al. (2013) and Wang et al. (2014).
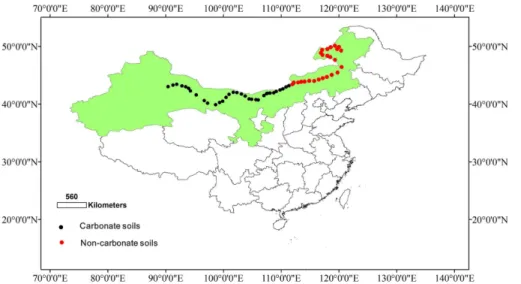
In early August 2012, a soil survey of the region was conducted and a total of 52 sam-15
pling sites were selected along a 3600 km long transect (including a 1900 km section with carbonate containing soils and a 1700 km section with non-carbonate containing soils) extending from eastern Inner Mongolia to central-eastern Xinjiang in northern China (Fig. 1). The sampling sites, which were spaced at approximately 50–100 km in-tervals, had minimal animal grazing and other anthropogenic disturbance, according to 20
visual inspection of the vegetation. At each sampling site, two main plots (50 m×50 m) were selected, 1000 m apart from each other, and five sub-plots (1 m×1 m each) were established within each main plot (one in each corner and one in the center). A com-posite topsoil sample (0–10 cm) was prepared from cores taken from 10 locations in each sub-plot using a soil corer (2.5 cm diameter), after removing litter. Each soil sam-25
BGD
12, 13215–13240, 2015
pH buffering in neutral-alkaline soils
W. Luo et al.
Title Page
Abstract Introduction
Conclusions References
Tables Figures
◭ ◮
◭ ◮
Back Close
Full Screen / Esc
Printer-friendly Version
Interactive Discussion
Discussion
P
a
per
|
Discussion
P
a
per
|
Discussion
P
a
per
|
Discussion
P
a
per
|
2.2 Measurements
Soil pHBC was measured by titration (Aitken and Moody, 1994). Air-dried soil was passed through 2.0 mm sieve in order to remove roots and gravel. For each titration, 2 g of air-dried soil (<2.0 mm) was weighed into each of seven polyethylene tubes, and each tube received 20 mL HNO3 solution with a concentration of 0, 0.016, 0.032,
5
0.064, 0.080, 0.128 or 0.256 M. The suspensions were shaken at 25◦C for 24 h, left still at 25◦C for a further 6 days, re-suspended by shaking for 2 min, and then the pH was measured.
Soil pHBC was calculated from the titration data following the method described by Nelson and Su (2010). The sigmoid function
10
pH=pHmin+
a
1+e−(A−Abmid)
(1)
whereAis the amount of acid added (inserted as a negative value) andAmid,a,band
pHmin are fitted constants, was fitted to the titration data by iteration using SigmaPlot®. In 34 cases Eq. (1) could not be solved because the iteration did not converge, due to the titration data covering only a small portion of the sigmoid relationship. In those 15
cases a simpler exponential decay function was fitted to the data instead (withA as a positive value):
pH=pHmin+ae−bA (2)
Buffer curves for 27 carbonate and 25 non-carbonate containing soil samples were ob-tained in this way, and six of them are presented in Fig. S1. Similar relationships were 20
BGD
12, 13215–13240, 2015
pH buffering in neutral-alkaline soils
W. Luo et al.
Title Page
Abstract Introduction
Conclusions References
Tables Figures
◭ ◮
◭ ◮
Back Close
Full Screen / Esc
Printer-friendly Version
Interactive Discussion
Discussion
P
a
per
|
Discussion
P
a
per
|
Discussion
P
a
per
|
Discussion
P
a
per
|
To calculate pHBC for soils fitted with the sigmoid function, Eq. (1) was rearranged to obtainAas a function of pH, and then differentiated to obtain
pHBC= ab
(a+pHmin−pH)(pH−pHmin) (3)
To calculate pHBC for soils fitted with the exponential function, Eq. (2) was rearranged and differentiated to obtain
5
pHBC= 1
b(pH−pHmin)
(4)
As soil pHBC changes with pH, an appropriate value had to be chosen to examine the relationships between pHBC and possible explanatory variables. Following Nelson and Su (2010), we used pHBCmid as the dependent parameter in the statistical anal-yses. The pHBCmid is the pHBC at the inflection point of the titration curve (i.e. Amid).
10
However, the inflection point could not be estimated where an exponential function was used. In those cases, we used the value of pHBC at the initial pH of the soils, which is a reasonable approximation of the value pHBCmid would have if the buffer curve
had been extended to higher values of pH using additions of alkali. We also calculated the value of pHBC at a particular pH obtained in all titrations, that is pH=7.5 for the 15
carbonate containing soils, and pH=6 and 5 for the non-carbonate containing soils. To simulate the effects of acid deposition on pH dynamics, the effects of the 0.016 M HNO3 treatment (comparable to the average cumulative amount of acid de-posited over 10 years) on the soils were examined. Soil inorganic carbon (SIC) con-tent was determined by measuring the volume of CO2 released from 10 g of air-dried
20
BGD
12, 13215–13240, 2015
pH buffering in neutral-alkaline soils
W. Luo et al.
Title Page
Abstract Introduction
Conclusions References
Tables Figures
◭ ◮
◭ ◮
Back Close
Full Screen / Esc
Printer-friendly Version
Interactive Discussion
Discussion
P
a
per
|
Discussion
P
a
per
|
Discussion
P
a
per
|
Discussion
P
a
per
|
with 50 mL NH4OAc (1 M, pH=7.0), and measuring concentrations in the extracts us-ing atomic absorption spectrophotometer (AA6800, Japan). Cation exchange capacity (CEC) was calculated as the sum of charge equivalents of exchangeable K, Na, Ca and Mg (Aprile and Lorandi, 2012). The ratio of CEC to clay content (CCR) was calculated to obtain an index of clay mineralogy (Shaw et al., 1998).
5
Soil organic carbon (SOC) content was measured using an elemental analyzer (2400II CHN elemental analyzer, Perkin-Elmer, USA) with a combustion temperature of 950◦C and a reduction temperature of 640◦C, at the Stable Isotope Facility of the University of California, Davis, after removing carbonate using 0.5 M HCl according to the approach of Harris et al. (2001).
10
Relationships between climate and soil pHBC were analyzed using the indices MAP, MAT and aridity index (AI). We extracted the MAP, MAT and potential evaporation (PET) from a global climate dataset (http://www.worldclim.org/, Hijmans et al., 2005), and AI was calculated as 1−MAP/PET (Delgado-Baquerizo et al., 2013).
2.3 Statistical analysis
15
Before numerical and statistical analysis, all variables were averaged at the site level. An independent samplet test was used to test for differences between the carbonate and non-carbonate containing parts of the transect. Ordinary least squares linear re-gression was used to determine the relationships between soil pHBC and other soil variables (SIC, SOC, CEC, clay, pH, exchangeable Na) and climate variables (AI, MAP 20
and MAT) in the carbonate soil and non-carbonate soil subsets, separately. In order to further illuminate the impacts of climate on the patterns of soil pHBC, we divided the transect into an arid part (AI>0.8) and a semi-arid part (AI<0.8), according to the criterion of Arora (2002).
Thereafter, stepwise multiple regressions were applied to identify the most influential 25
BGD
12, 13215–13240, 2015
pH buffering in neutral-alkaline soils
W. Luo et al.
Title Page
Abstract Introduction
Conclusions References
Tables Figures
◭ ◮
◭ ◮
Back Close
Full Screen / Esc
Printer-friendly Version
Interactive Discussion
Discussion
P
a
per
|
Discussion
P
a
per
|
Discussion
P
a
per
|
Discussion
P
a
per
|
Soil pHBCmid(or its estimate for the buffer curves that did not fit a sigmoid function) was significantly correlated with the values of pHBC at pH=7.5 (carbonate contain-ing soils) or at pH=6 and 5 (non-carbonate containing soils) (Fig. S2). Therefore, we show only the results for pHBCmid, which we refer to hereafter simply as pHBC. All sta-tistical analyses were conducted using the stasta-tistical package SPSS 17.0 (SPSS Inc., 5
Chicago, IL, USA, 2004).
3 Results
The magnitude of soil pHBC varied widely, ranging from 27.2 to 188.5 mmol H+kg−1pH unit−1 for the carbonate containing soils and from 10.4 to 58.4 mmol H+kg−1pH unit−1 for the non-carbonate containing soils (Ta-10
ble 1). Mean pHBC was much greater in the carbonate containing soils (87.7 mmol H+kg−1pH unit−1) than in the non-carbonate containing soils (25.7 mmol H+kg−1pH unit−1) (Table 1). When 0.016 M HNO3 (comparable to the average cumulative amount of acid deposited over 10 years) was added to the soils, the average decrease in pH was 0.21 units for the carbonate containing soils and 0.44 15
units for the non-carbonate containing soils (Fig. 2).
Soil pHBC was significantly correlated with carbonate content in the carbonate containing soils, accounting for 48 % of the variation (Table 2, Fig. 3). Soil pHBC of both carbonate and non-carbonate containing soils was positively correlated with CEC (P <0.01 for both) and exchangeable Na concentration (P <0.01 for both) but was not 20
related to SOC content (P >0.05) (Table 2, Fig. 3). Soil pHBC was negatively corre-lated with clay content and initial pH in the carbonate containing soils (P <0.05 for both) but was positively correlated with those two parameters in the non-carbonate containing soils (P <0.05 for both) (Table 2, Fig. 3).
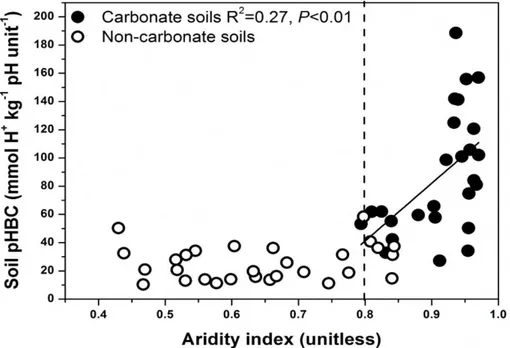
Soil pHBC was significantly related to AI in the carbonate containing soils (P <0.01) 25
BGD
12, 13215–13240, 2015
pH buffering in neutral-alkaline soils
W. Luo et al.
Title Page
Abstract Introduction
Conclusions References
Tables Figures
◭ ◮
◭ ◮
Back Close
Full Screen / Esc
Printer-friendly Version
Interactive Discussion
Discussion
P
a
per
|
Discussion
P
a
per
|
Discussion
P
a
per
|
Discussion
P
a
per
|
soils in the arid regions (AI>0.8) was higher than that of soils in the semi-arid regions (AI<0.8) along the whole transect (Fig. 4).
When all soil variables were entered into a stepwise multiple linear regression, with soil pHBC as the dependent variable, carbonate content was the only significant ex-planatory variable for the carbonate containing soils and CEC was the only significant 5
explanatory variable for the non-carbonate containing soils. None of the other soil or climate variables provided significant extra explanatory power (i.e. those variables were removed from multiple stepwise regression using a cutoffvalue ofP =0.05) (Table 2).
The carbonate containing soils and the non-carbonate containing soils had sim-ilar clay contents but the former had higher pH than the latter (Table 1). In the 10
non-carbonate containing soils, CEC was closely related to clay content (R2=0.83,
P <0.001) (Fig. S3), with a narrow range of CCR (0.18–0.46 cmol (+) kg−1 clay) (Ta-ble 1). In the carbonate containing soils, CEC was unrelated to clay content; CCR covered a much wider range and was inversely related to clay content, ranging from 0.26 cmol (+) kg−1 clay at the highest clay content (21.1 %) to 5.26 cmol (+) kg−1 clay 15
at the lowest clay content (1.4 %) (Table 1, Fig. S3). The initial pH of soils was nega-tively correlated with carbonate content in the carbonate containing soils, accounting for 16 % of the variation (P <0.05) (Fig. S5).
4 Discussion
4.1 Soil pHBC and potential consequences of soil acidification
20
Our results demonstrated substantially greater pHBC in the carbonate containing soils than in the non-carbonate containing soils (Table 1). Stepwise regression of the rela-tionships between soil pHBC and other variables identified carbonate and CEC (both positive influence) as the most significant explanatory variables for pHBC, in the car-bonate and non-carcar-bonate containing soils, respectively (Table 2). These results may 25
BGD
12, 13215–13240, 2015
pH buffering in neutral-alkaline soils
W. Luo et al.
Title Page
Abstract Introduction
Conclusions References
Tables Figures
◭ ◮
◭ ◮
Back Close
Full Screen / Esc
Printer-friendly Version
Interactive Discussion
Discussion
P
a
per
|
Discussion
P
a
per
|
Discussion
P
a
per
|
Discussion
P
a
per
|
Van Breemen, 1983). In the carbonate containing soils, the primary buffering process is acid neutralization, i.e. CO23−+2H+↔HCO−3+H+ and HCO−3+H+↔H2O+CO2↑.
If sufficient carbonate is present, the added acid may be consumed with little or no decrease in pH (Van Breemen, 1983). In contrast, cation exchange reactions were the primary buffering process in non-carbonate containing soils. In this process, non-acidic 5
cations such as Ca2+, Mg2+, K+ and Na+ held on soil surfaces exchange with added H+, limiting the change in soil pH (Bowman et al., 2008; Van Breemen, 1983).
Our acid-addition experiment found that soil pH declined in the carbonate containing and non-carbonate containing soils but the magnitude of pH change was smaller in the former group (0.21 vs. 0.44 units) (Fig. 2). In the carbonate containing soils, acid 10
addition will have little effect on soil pH until all the carbonate has been dissolved. However, net addition of acid always reduces the acid neutralizing capacity of soil. In line with our results, soils derived from carbonate parent materials in arid and semi-arid grasslands of China have acidified from the 1980s to the 2000s (Yang et al., 2012). Soil pH in Russian forest soils derived from carbonate parent has also significantly declined 15
from 1893 to 2004 (Lapenis et al., 2004).
In the carbonate containing soils, sustained long-term acid deposition releases a large amount of carbon dioxide into the atmosphere, altering the carbon balance of these globally important drylands (Yang et al., 2012). On the other hand, lowering the pH of carbonate containing soils would, to some degree, improve their quality and thus 20
increase the vegetation cover and biological productivity. In the non-carbonate contain-ing soils, an increase in soil acidity may reduce availability of some nutrient cations, such as Ca and Mg, and enhance availability of some toxic cations, such as aluminum (Al) and manganese (Mn), which might limit plant growth and increase susceptibility to low temperature, drought and herbivory stress in these ecosystems (Blake et al., 1999; 25
Lieb et al., 2011; Chen et al., 2013).
BGD
12, 13215–13240, 2015
pH buffering in neutral-alkaline soils
W. Luo et al.
Title Page
Abstract Introduction
Conclusions References
Tables Figures
◭ ◮
◭ ◮
Back Close
Full Screen / Esc
Printer-friendly Version
Interactive Discussion
Discussion
P
a
per
|
Discussion
P
a
per
|
Discussion
P
a
per
|
Discussion
P
a
per
|
deposition at the scale of our measurements is unknown. Secondly, our study did not assess the biological activity, nutrient uptake by plants, and leaching or accumulation of solutes that occur in the field and influence soil pH and response to acid addition (Aitken and Moody, 1994). Nevertheless, the knowledge about pHBC acquired in this study is fundamental for predicting acidification rates in soils of the region (Aitken and 5
Moody, 1994).
4.2 Effects of soil properties on soil pHBC
Linear regression showed that the soil pHBC was positively correlated with CEC for both carbonate containing and non-carbonate containing soils (Table 2, Fig. 3). This is consistent with the findings of Aitken (1992), who demonstrated that CEC accounted 10
for up to 76 % of the variations in pHBC of acidic soils in eastern Queensland, Australia. Likewise, Xu et al. (2012) also showed a strong positive relationship between soil pHBC and CEC across 18 acidic soils from tropical to sub-tropical regions in China (R2=
0.71,P <0.001).
Linear regression did not demonstrate a clear relationship between soil pHBC and 15
SOC content in either carbonate or non-carbonate containing soils (Table 2, Fig. 3). These results were inconsistent with previous studies, which have shown that SOC content played an important role in soil pHBC (Aitken, 1992; Magdoff and Bartlett, 1985; Nelson and Su, 2010; Geissen et al., 2013). The discrepancy between our re-sults and previous rere-sults is probably caused by different quantities and types of or-20
ganic matter involved. In the carbonate containing soils, the low SOC content and the small range of SOC content (due to aridity and low net primary production) can help explain the lack of significant relationship between pHBC and SOC content. Moreover, those soils had a wide range of clay mineralogy, and the effect of this variability on CEC and hence pHBC may have masked any effect of SOC. However, in the non-carbonate 25
BGD
12, 13215–13240, 2015
pH buffering in neutral-alkaline soils
W. Luo et al.
Title Page
Abstract Introduction
Conclusions References
Tables Figures
◭ ◮
◭ ◮
Back Close
Full Screen / Esc
Printer-friendly Version
Interactive Discussion
Discussion
P
a
per
|
Discussion
P
a
per
|
Discussion
P
a
per
|
Discussion
P
a
per
|
Over recent decades it has become clear that soil particle size distribution, partic-ularly clay content, plays a crucial role in determining soil pHBC (Aitken et al., 1990; Weaver et al., 2004). For instance, Aitken et al. (1990) demonstrated that soil pHBC is primarily determined by clay content; it explained approximately 32 % of the vari-ance in the pHBC of acidic topsoils in Australia. In our study we found that pHBC was 5
positively correlated with clay content for the non-carbonate containing soils but that the relationship was negative for the carbonate containing soils (Table 1, Fig. 3). The difference between the behaviour of the two soil subsets was apparently due to diff er-ences in their clay mineralogy. The close relationship between CEC and clay content of the non-carbonate containing soils meant that both parameters were similarly related 10
to pHBC (Fig. S3). The CCR values of those soils indicated that clay mineralogy was dominated by kaolin and illite (Shaw et al., 1998). On the other hand, in the carbon-ate containing soils there was a negative relationship between CCR and clay content, and a negative relationship between pHBC and clay content (Fig. S3). The soils with higher clay content had lower CCR values, reflecting clay mineralogy dominated by 15
kaolin, whereas the soils with lower clay content had higher CCR values, indicating dominantly smectitic clay mineralogy (Shaw et al., 1998). Kaolin is a 1 : 1 clay min-eral with low CEC whereas smectite is an expanding 2 : 1 clay minmin-eral with high CEC. Previous work has shown higher soil pHBC in the presence of clay minerals having high surface area and CEC, such as chlorite and smectite (Aitken and Moody, 1994). 20
Similarly, Xu et al. (2012) oberserved that soils rich in smectite usually have a large capacity to absorb H+ and contribute to higher soil pHBC than soils rich in kaolinite. Thus clay content is not a good predictor of pHBC across the neutral-alkaline soils in northern China. It is a reasonable predictor of pHBC only if it is closely related to CEC, i.e. where clay mineralogy is fairly uniform.
25
BGD
12, 13215–13240, 2015
pH buffering in neutral-alkaline soils
W. Luo et al.
Title Page
Abstract Introduction
Conclusions References
Tables Figures
◭ ◮
◭ ◮
Back Close
Full Screen / Esc
Printer-friendly Version
Interactive Discussion
Discussion
P
a
per
|
Discussion
P
a
per
|
Discussion
P
a
per
|
Discussion
P
a
per
|
there was a positive relationship between pHBC and initial pH (Table 2, Fig. 3). The car-bonate containing soils had high pH and high pHBC, presumably due to the carcar-bonate and high saturation with non-acidic exchangeable cations. However, for the carbonate containing soils, the relationship between initial soil pH and pHBC was negative (Ta-ble 2, Fig. 3). This negative relationship appeared to be directly associated with the 5
negative relationship between carbonate content and initial pH in the carbonate con-taining soil subset (Fig. S5). In carbonate concon-taining soils, pH is largely determined by the carbonate equilibrium, which is influenced by the suite of exchangeable and dis-solved cations and anions present (Bloom, 2000). In our study, there was a significant positive effect of soil exchangeable Na concentration on soil pHBC among the carbon-10
ate containing soils (Table 2, Fig. 3). Therefore, in soils containing significant amounts of carbonate, exchangeable Na content appears to have more of an influence on pHBC than carbonate content.
4.3 Effects of climatic variables on soil pHBC
Linear regression showed that soil pHBC increased with increasing aridity; the buffer 15
strength of soils in the arid region (AI>0.8), which were the carbonate containing soils, was significantly greater than that of soils in the semi-arid region (AI<0.8) (Fig. 2). Under arid conditions, in which potential evapotranspiration greatly exceeds precipita-tion, carbonate tends to accumulate in the topsoil (Cross and Schlesinger, 2001; Wang et al., 2012). In less arid regions, leaching processes prevent the accumulation of car-20
bonate. Thus, soil carbonate content decreased to zero with increasing precipitation from west to east along the climatic gradient (Fig. S1). In the east, where the soils do not contain carbonate, soil CEC was the most significant explanatory variable for soil pHBC. Climate can also affect soil pHBC through its effect on biological processes, and water availability is the most limiting factor for plant growth in our study area (Luo 25
BGD
12, 13215–13240, 2015
pH buffering in neutral-alkaline soils
W. Luo et al.
Title Page
Abstract Introduction
Conclusions References
Tables Figures
◭ ◮
◭ ◮
Back Close
Full Screen / Esc
Printer-friendly Version
Interactive Discussion
Discussion
P
a
per
|
Discussion
P
a
per
|
Discussion
P
a
per
|
Discussion
P
a
per
|
regimes can exert large effects on soil pHBC because of their direct and biologically mediated influence on soil variables such as carbonate content and CEC.
Atmospheric wet nitrogen and sulfur depositions in rainfall and snowfall play a cru-cial role in soil acidification (Dentener et al., 2006), and the amounts deposited will be greater in semi-arid regions than arid regions because of the greater precipitation. 5
Precipitation has important effects on acid addition not just because of the solutes de-posited, but also because of the leaching of water through the profile. In areas with sufficient precipitation to leach the topsoil, the main alkali material in soil (carbonate) is removed downwards (Jenny, 1941). In addition, once pH reaches 6 or less, the leach-ing of non-acidic cations becomes important, because it leads to an accumulation of 10
the less mobile and acidic Al3+ as an exchangeable cation (Jenny, 1941). Finally, in wetter soils weathering occurs more rapidly, which tends to result in a lowering of CEC. Therefore, lower soil pHBC in soils of semi-arid regions compared to arid regions, in combination with greater acid inputs, indicates that semi-arid regions would be much more sensitive to global changes such as elevated nitrogen deposition and altered 15
precipitation regimes.
5 Conclusions
We found that soil pHBC was primarily associated with carbonate, being higher in the carbonate containing soils than non-carbonate containing soils. In the carbonate con-taining soils pHBC was primarily related to carbonate content and in the non-carbonate 20
containing soils it was primarily related to CEC. There was little or no relationship be-tween pHBC and SOC content in either carbonate or non-carbonate containing soils. Effects of clay content and initial pH on soil pHBC differed between the two soil groups. Lower soil pHBC and higher acid inputs in the semi-arid regions (AI<0.8) than in the arid regions (AI>0.8) make soils much more sensitive to future acid deposition in the 25
BGD
12, 13215–13240, 2015
pH buffering in neutral-alkaline soils
W. Luo et al.
Title Page
Abstract Introduction
Conclusions References
Tables Figures
◭ ◮
◭ ◮
Back Close
Full Screen / Esc
Printer-friendly Version
Interactive Discussion
Discussion
P
a
per
|
Discussion
P
a
per
|
Discussion
P
a
per
|
Discussion
P
a
per
|
landscape scales. Our findings are the beginning of a data compilation and analysis exercise that will focus on soil pHBC as an effective parameter to assess acidification risks, acidification rates, and potential management interventions. Models for realisti-cally predicting acidification risks and rates and in this environment should incorporate the different mechanisms controlling pHBC in carbonate and non-carbonate-containing 5
soils.
The Supplement related to this article is available online at doi:10.5194/bgd-12-13215-2015-supplement.
Acknowledgements. We thank all members of the Field Expedition Team from the Institute of Applied Ecology, Chinese Academy of Sciences for field assistance. The algebraic help
10
provided by Carolyn R. Scherzer Diedricks is gratefully acknowledged. This work was financially supported by the National Science Foundation of China (41371251) and by the National Basic Research Program of China (2011CB403204).
References
Aitken, R. L.: Relationships between extractable Al, selected soil properties, pH buffer capacity
15
and lime requirement in some acidic Queensland soils, Aust. J. Soil Res., 30, 119–130, 1992.
Aitken, R. L. and Moody, P. W.: The effects of valence and ionic-strength on the measuement of pH buffer capacity, Aust. J. Soil Res., 32, 975–984, 1994.
Aitken, R. L., Moody, P. W., and McKinley, P. G.: Lime requirement of acidic Queensland soils. I.
20
Relationships between soil properties and pH buffer capacity, Aust. J. Soil Res., 28, 695–701, 1990.
Aprile, F. and Lorandi, R.: Evaluation of cation exchange capacity (CEC) in tropical soils using four different analytical methods, J. Agr. Sci., 4, 278–289, 2012.
Arora, V. K.: The use of the aridity index to assess climate change effect on annual runoff, J.
25
BGD
12, 13215–13240, 2015
pH buffering in neutral-alkaline soils
W. Luo et al.
Title Page
Abstract Introduction
Conclusions References
Tables Figures
◭ ◮
◭ ◮
Back Close
Full Screen / Esc
Printer-friendly Version
Interactive Discussion
Discussion
P
a
per
|
Discussion
P
a
per
|
Discussion
P
a
per
|
Discussion
P
a
per
|
Barak, P., Jobe, B. O., Krueger, A. R., Peterson, L. A., and Laird, D. A.: Effects of long-term soil acidification due to nitrogen fertilizer inputs in Wisconsin, Plant Soil, 197, 61–69, 1997. Blake, L., Goulding, K. W. T., Mott, C. J. B., and Johnston, A. E.: Changes in soil chemistry
accompanying acidification over more than 100,years under woodland and grass at Rotham-sted Experimental Station, UK, Eur. J. Soil Sci., 50, 401–412, 1999.
5
Bowman, W. D., Cleveland, C. C., Halada,Ĺ., Hreško, J., and Baron, J. S.: Negative impact of nitrogen deposition on soil buffering capacity, Nat. Geosci., 1, 767–770, 2008.
Chen, D., Lan, Z., Bai, X., Grace, J. B., and Bai, Y.: Evidence that acidification-induced declines in plant diversity and productivity are mediated by changes in below-ground communities and soil properties in a semi-arid steppe, J. Ecol., 101, 1322–1334, 2013.
10
Cross, A. F. and Schlesinger, W. H.: Biological and geochemical controls on phosphorus frac-tions in semiarid soils, Biogeochemistry, 52, 155–172, 2001.
de Vries, W., Dobbertin, M. H., Solberg, S., van Dobben, H. F., and Schaub, M.: Impacts of acid deposition, ozone exposure and weather conditions on forest ecosystems in Europe: an overview, Plant Soil, 380, 1–45, 2014.
15
Delgado-Baquerizo, M., Maestre, F. T., Gallardo, A., Bowker, M. A., Wallenstein, M. D., Quero, J. L., Ochoa, V., Gozalo, B., Garcia-Gomez, M., Soliveres, S., Garcia-Palacios, P., Berdugo, M., Valencia, E., Escolar, C., Arredondo, T., Barraza-Zepeda, C., Bran, D., Carreira, J. A., Chaieb, M., Conceicao, A. A., Derak, M., Eldridge, D. J., Escudero, A., Espinosa, C. I., Gaitan, J., Gatica, M. G., Gomez-Gonzalez, S., Guzman, E., Gutierrez, J. R., Florentino, A., Hepper, E.,
20
Hernandez, R. M., Huber-Sannwald, E., Jankju, M., Liu, J., Mau, R. L., Miriti, M., Monerris, J., Naseri, K., Noumi, Z., Polo, V., Prina, A., Pucheta, E., Ramirez, E., Ramirez-Collantes, D. A., Romao, R., Tighe, M., Torres, D., Torres-Diaz, C., Ungar, E. D., Val, J., Wamiti, W., Wang, D., and Zaady, E.: Decoupling of soil nutrient cycles as a function of aridity in global drylands, Nature, 502, 672–670, 2013.
25
Dentener, F., Drevet, J., Lamarque, J., Bey, I., Eickhout, B., Fiore, A., Hauglustaine, D., Horowitz, L., Krol, M., and Kulshrestha, U.: Nitrogen and sulfur deposition on re-gional and global scales: a multimodel evaluation, Global Biogeochem. Cy., 20, GB4003, doi:10.1029/2005GB002672, 2006.
Dixon, A., Faber-Langendoen, D., Josse, C., Morrison, J., and Loucks, C.: Distribution mapping
30
BGD
12, 13215–13240, 2015
pH buffering in neutral-alkaline soils
W. Luo et al.
Title Page
Abstract Introduction
Conclusions References
Tables Figures
◭ ◮
◭ ◮
Back Close
Full Screen / Esc
Printer-friendly Version
Interactive Discussion
Discussion
P
a
per
|
Discussion
P
a
per
|
Discussion
P
a
per
|
Discussion
P
a
per
|
Geissen, V., Wang, S., Oostindie, K., Huerta, E., Zwart, K., Smit, A., Ritsema, C., and Moore, D.: Effects of topsoil removal as a nature management technique on soil functions, Catena, 101, 50–55, 2013.
Guo, J. H., Liu, X. J., Zhang, Y., Shen, J. L., Han, W. X., Zhang, W. F., Christie, P., Goulding, K. W. T., Vitousek, P. M., and Zhang, F. S.: Significant acidification in major Chinese croplands,
5
Science, 327, 1008–1010, 2010.
Harris, D., Horwath, W. R., and van Kessel, C.: Acid fumigation of soils to remove carbonates prior to total organic carbon or carbon-13 isotopic analysis, Soil Sci. Soc. Am. J., 65, 1853– 1856, 2001.
Hijmans, R. J., Cameron, S. E., Parra, J. L., Jones, P. G., and Jarvis, A.: Very high resolution
10
interpolated climate surfaces for global land areas, Int. J. Climatol., 25, 1965–1978, 2005. Hoegh-Guldberg, O., Mumby, P. J., Hooten, A. J., Steneck, R. S., Greenfield, P., Gomez, E.,
Harvell, C. D., Sale, P. F., Edwards, A. J., Caldeira, K., Knowlton, N., Eakin, C. M., Iglesias-Prieto, R., Muthiga, N., Bradbury, R. H., Dubi, A., and Hatziolos, M. E.: Coral reefs under rapid climate change and ocean acidification, Science, 318, 1737–1742, 2007.
15
Jenny, H.: Factors of Soil Formation: a System of Quantitative Pedology, McGraw-Hill, New York, 1941.
Kissel, D., Sonon, L., and Cabrera, M.: Rapid measurement of soil pH buffering capacity, Soil Sci. Soc. Am. J., 76, 694–699, 2012.
Lapenis, A. G., Lawrence, G. B., Andreev, A. A., Bobrov, A. A., Torn, M. S., and Harden, J.
20
W.: Acidification of forest soil in Russia: from 1893 to present, Global Biogeochem. Cy., 18, GB1037, doi:10.1029/2003GB002107, 2004.
Lieb, A. M., Darrouzet-Nardi, A., and Bowman, W. D.: Nitrogen deposition decreases acid buffering capacity of alpine soils in the southern Rocky Mountains, Geoderma, 164, 220– 224, 2011.
25
Liu, X., Zhang, Y., Han, W., Tang, A., Shen, J., Cui, Z., Vitousek, P., Erisman, J. W., Goulding, K., and Christie, P.: Enhanced nitrogen deposition over China, Nature, 494, 459–462, 2013. Lu, X., Mao, Q., Gilliam, F. S., Luo, Y., and Mo, J.: Nitrogen deposition contributes to soil
acidi-fication in tropical ecosystems, Glob. Change Biol., 20, 3790–3801, 2014.
Lu, X., Mao, Q., Mo, J., Gilliam, F. S., Zhou, G., Luo, Y., Zhang, W., and Huang, J.: Divergent
30
BGD
12, 13215–13240, 2015
pH buffering in neutral-alkaline soils
W. Luo et al.
Title Page
Abstract Introduction
Conclusions References
Tables Figures
◭ ◮
◭ ◮
Back Close
Full Screen / Esc
Printer-friendly Version
Interactive Discussion
Discussion
P
a
per
|
Discussion
P
a
per
|
Discussion
P
a
per
|
Discussion
P
a
per
|
Luo, W., Jiang, Y., Lu, X., Wang, X., Li, M.-H., Bai, E., Han, X., and Xu, Z.: Patterns of plant biomass allocation in temperate grasslands across a 2500-km transect in northern China, PLoS One, 8, e71749, doi:10.1371/journal.pone.0071749, 2013.
Magdoff, F. R. and Bartlett, R. J.: Soil pH buffering revisited, Soil Sci. Soc. Am. J., 49, 145–148, 1985.
5
Nelson, P. N. and Su, N.: Soil pH buffering capacity: a descriptive function and its application to some acidic tropical soils, Soil Res., 48, 201–207, 2010.
Pan, Y. P., Wang, Y. S., Tang, G. Q., and Wu, D.: Spatial distribution and temporal variations of atmospheric sulfur deposition in Northern China: insights into the potential acidification risks, Atmos. Chem. Phys., 13, 1675–1688, doi:10.5194/acp-13-1675-2013, 2013.
10
Rogovska, N. P., Blackmer, A. M., and Mallarino, A. P.: Relationships between soybean yield, soil pH, and soil carbonate concentration, Soil Sci. Soc. Am. J., 71, 1251–1256, 2007. Roscoe, R., Buurman, P., and Velthorst, E.: Disruption of soil aggregates by varied amounts of
ultrasonic energy in fractionation of organic matter of a clay Latosol: carbon, nitrogen and δ13C distribution in particle-size fractions, Eur. J. Soil Sci., 51, 445–454, 2000.
15
Shaw, R. J., Coughlan, K. J., and Bell, L. C.: Root zone sodicity, in: Sodic Soils: Distribution, Properties, Management and Environment Consequences, edited by: Summer, M. E. and Naidu, R., Oxford University Press, New York, 95–106, 1998.
Singh, B., Odeh, I., and McBratney, A.: Acid buffering capacity and potential acidification of cotton soils in northern New South Wales, Soil Res., 41, 875–888, 2003.
20
Tan, K. H.: Principles of Soil Chemistry, CRC Press, New York, 2011.
Van Breemen, N., Mulder, J., and Driscoll, C. T.: Acidification and alkalinization of soils, Plant Soil, 75, 283–308, 1983.
van den Berg, L. J., Vergeer, P., Rich, T. C., Smart, S. M., Guest, D., and Ashmore, M. R.: Di-rect and indiDi-rect effects of nitrogen deposition on species composition change in calcareous
25
grasslands, Glob. Change Biol., 17, 1871–1883, 2011.
Vet, R., Artz, R. S., Carou, S., Shaw, M., Ro, C.-U., Aas, W., Baker, A., Bowersox, V. C., Den-tener, F., Galy-Lacaux, C., Hou, A., Pienaar, J. J., Gillett, R., Cristina Forti, M., Gromov, S., Hara, H., Khodzher, T., Mahowald, N. M., Nickovic, S., Rao, P. S. P., and Reid, N. W.: A global assessment of precipitation chemistry and deposition of sulfur, nitrogen, sea salt,
30
BGD
12, 13215–13240, 2015
pH buffering in neutral-alkaline soils
W. Luo et al.
Title Page
Abstract Introduction
Conclusions References
Tables Figures
◭ ◮
◭ ◮
Back Close
Full Screen / Esc
Printer-friendly Version
Interactive Discussion
Discussion
P
a
per
|
Discussion
P
a
per
|
Discussion
P
a
per
|
Discussion
P
a
per
|
Wang, C., Wang, X., Liu, D., Wu, H., Lu, X., Fang, Y., Cheng, W., Luo, W., Jiang, P., Shi, J., Yin, H., Zhou, J., Han, X., and Bai, E.: Aridity threshold in controlling ecosystem nitrogen cycling in arid and semi-arid grasslands, Nature Commun. 5, 4799, doi:10.1038/ncomms5799, 2014. Wang, D., Hamm, L. M., Giuffre, A. J., Echigo, T., Rimstidt, J. D., De Yoreo, J. J., Grotzinger, J.,
and Dove, P. M.: Revisiting geochemical controls on patterns of carbonate deposition through
5
the lens of multiple pathways to mineralization, Faraday Discuss., 159, 371–386, 2012. Weaver, A. R., Kissel, D. E., Chen, F., West, L. T., Adkins, W., Rickman, D., and Luvall, J. C.:
Mapping soil pH buffering capacity of selected fields in the coastal plain, Soil Sci. Soc. Am. J., 68, 662–668, 2004.
Wong, M., Webb, M., and Wittwer, K.: Development of buffer methods and evaluation of
pedo-10
transfer functions to estimate pH buffer capacity of highly weathered soils, Soil Use Manage., 29, 30–38, 2013.
Xu, R., Zhao, A., Yuan, J., and Jiang, J.: pH buffering capacity of acid soils from tropical and subtropical regions of China as influenced by incorporation of crop straw biochars, J. Soil. Sediment., 12, 494–502, 2012.
15
Yan, Y., Xu, X., Xin, X., Yang, G., Wang, X., Yan, R., and Chen, B.: Effect of vegetation coverage on aeolian dust accumulation in a semiarid steppe of northern China, Catena, 87, 351–356, 2011.
Yang, Y., Ji, C., Ma, W., Wang, S., Wang, S., Han, W., Mohammat, A., Robinson, D., and Smith, P.: Significant soil acidification across northern China’s grasslands during 1980s–
20
2000s, Glob. Change Biol., 18, 2292–2300, 2012.
Zhang, X., van Geffen, J., Liao, H., Zhang, P., and Lou, S.: Spatiotemporal variations of
tropo-spheric SO2 over China by SCIAMACHY observations during 2004–2009, Atmos. Environ.,
60, 238–246, 2012.
Zhao, Y., Duan, L., Xing, J., Larssen, T., Nielsen, C. P., and Hao, J.: Soil acidification in China:
25
BGD
12, 13215–13240, 2015
pH buffering in neutral-alkaline soils
W. Luo et al.
Title Page
Abstract Introduction
Conclusions References
Tables Figures
◭ ◮
◭ ◮
Back Close
Full Screen / Esc
Printer-friendly Version
Interactive Discussion
Discussion
P
a
per
|
Discussion
P
a
per
|
Discussion
P
a
per
|
Discussion
P
a
per
|
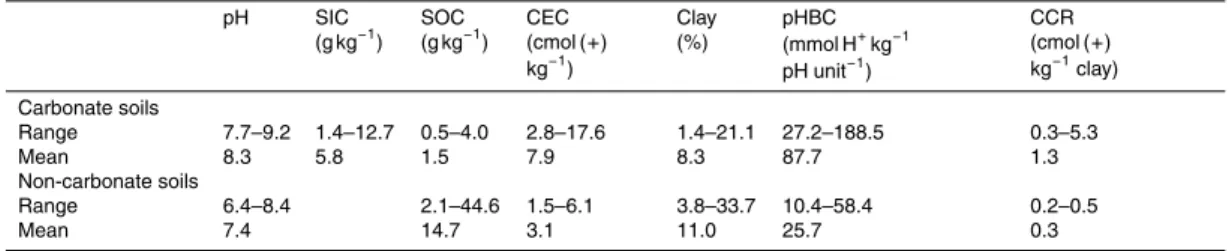
Table 1.Physicochemical properties of the carbonate containing soils and the non-carbonate containing soils along the transect across northern China.
pH SIC
(g kg−1) SOC (g kg−1)
CEC (cmol (+) kg−1)
Clay (%)
pHBC (mmol H+kg−1 pH unit−1)
CCR (cmol (+) kg−1clay) Carbonate soils
Range 7.7–9.2 1.4–12.7 0.5–4.0 2.8–17.6 1.4–21.1 27.2–188.5 0.3–5.3
Mean 8.3 5.8 1.5 7.9 8.3 87.7 1.3
Non-carbonate soils
Range 6.4–8.4 2.1–44.6 1.5–6.1 3.8–33.7 10.4–58.4 0.2–0.5
Mean 7.4 14.7 3.1 11.0 25.7 0.3
BGD
12, 13215–13240, 2015
pH buffering in neutral-alkaline soils
W. Luo et al.
Title Page
Abstract Introduction
Conclusions References
Tables Figures
◭ ◮
◭ ◮
Back Close
Full Screen / Esc
Printer-friendly Version
Interactive Discussion
Discussion
P
a
per
|
Discussion
P
a
per
|
Discussion
P
a
per
|
Discussion
P
a
per
|
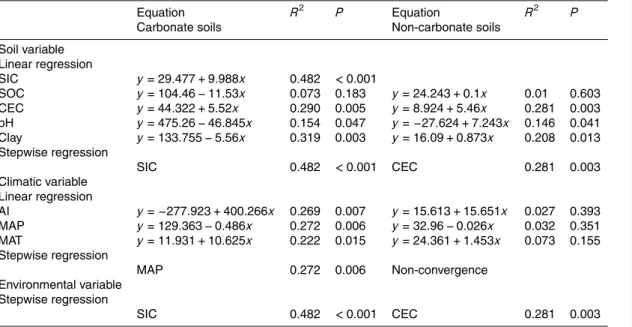
Table 2.Summary of regression models (linear and stepwise) for the effects of soil, climatic and all environmental variables on soil pH buffering capacity in the carbonate containing soils and the non-carbonate containing soils.
Equation R2 P Equation R2 P
Carbonate soils Non-carbonate soils
Soil variable Linear regression
SIC y=29.477+9.988x 0.482 <0.001
SOC y=104.46−11.53x 0.073 0.183 y=24.243+0.1x 0.01 0.603 CEC y=44.322+5.52x 0.290 0.005 y=8.924+5.46x 0.281 0.003 pH y=475.26−46.845x 0.154 0.047 y=−27.624+7.243x 0.146 0.041 Clay y=133.755−5.56x 0.319 0.003 y=16.09+0.873x 0.208 0.013 Stepwise regression
SIC 0.482 <0.001 CEC 0.281 0.003
Climatic variable Linear regression
AI y=−277.923+400.266x 0.269 0.007 y=15.613+15.651x 0.027 0.393 MAP y=129.363−0.486x 0.272 0.006 y=32.96−0.026x 0.032 0.351 MAT y=11.931+10.625x 0.222 0.015 y=24.361+1.453x 0.073 0.155 Stepwise regression
MAP 0.272 0.006 Non-convergence Environmental variable
Stepwise regression
SIC 0.482 <0.001 CEC 0.281 0.003
BGD
12, 13215–13240, 2015
pH buffering in neutral-alkaline soils
W. Luo et al.
Title Page
Abstract Introduction
Conclusions References
Tables Figures
◭ ◮
◭ ◮
Back Close
Full Screen / Esc
Printer-friendly Version
Interactive Discussion
Discussion
P
a
per
|
Discussion
P
a
per
|
Discussion
P
a
per
|
Discussion
P
a
per
|