Submitted6 November 2015 Accepted 31 January 2016 Published23 February 2016
Corresponding author
Jason E. Bond, jbond@auburn.edu
Academic editor Scott Edwards
Additional Information and Declarations can be found on page 26
DOI10.7717/peerj.1719
Copyright 2016 Garrison et al.
Distributed under
Creative Commons CC-BY 4.0
OPEN ACCESS
Spider phylogenomics: untangling the
Spider Tree of Life
Nicole L. Garrison1, Juanita Rodriguez1, Ingi Agnarsson2,
Jonathan A. Coddington3, Charles E. Griswold4, Christopher A. Hamilton1,
Marshal Hedin5, Kevin M. Kocot6, Joel M. Ledford7and Jason E. Bond1
1Department of Biological Sciences and Auburn University Museum of Natural History, Auburn University,
Auburn, AL, United States
2Department of Biology, University of Vermont, Burlington, VT, United States
3Department of Entomology, National Museum of Natural History, Smithsonian Institution, Washingtion,
DC, United States
4Arachnology, California Academy of Sciences, San Francisco, CA, United States 5Department of Biology, San Diego State University, San Diego, CA, United States
6Department of Biological Sciences and Alabama Museum of Natural History, University of Alabama—Tuscaloosa,
Tuscaloosa, AL, United States
7Department of Plant Biology, University of California, Davis, Davis, CA, United States
ABSTRACT
peculiar features of each family may in fact be synapomorphic for the pair. Leptonetids now are seen as a possible sister group to the Entelegynae, illustrating possible intermediates in the evolution of the more complex entelegyne genitalic condition, spinning organs and respiratory organs.
SubjectsEvolutionary Studies, Taxonomy, Zoology
Keywords Arachnida, Molecular systematics, Araneae, Spider phylogeny, Web evolution
INTRODUCTION
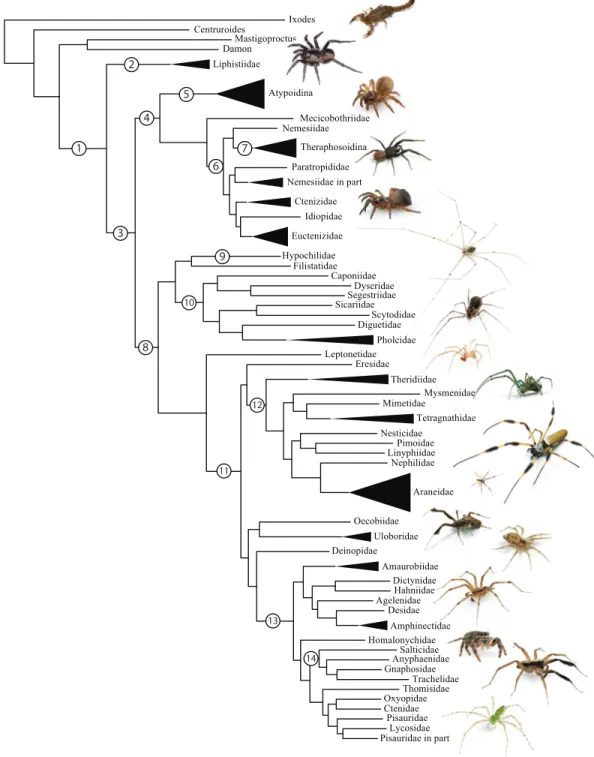
Spiders (Order Araneae;Fig. 1) are a prototypical, hyperdiverse arthropod group comprising >45,000 described species (World Spider Catalog, 2016) distributed among 3,958 genera and 114 families; by some estimates the group may include >120,000 species (Agnarsson, Coddington & Kuntner, 2013). Spiders are abundant, generalist predators that play dominant roles in almost every terrestrial ecosystem. The order represents an ancient group that has continued to diversify taxonomically and ecologically since the Devonian (>380 mya). They are relatively easy to collect and identify, and are one of few large arthropod orders to have a complete online taxonomic catalog with synonymies and associated literature (World Spider Catalog, 2016).
In addition to their remarkable ecology, diversity, and abundance, spiders are known for the production of extraordinary biomolecules like venoms and silks as well as their utility as models for behavioral and evolutionary studies (reviewed inAgnarsson, Codding-ton & Kuntner, 2013). Stable and complex venoms have evolved over millions of years to target predators and prey alike. Although few are dangerous to humans, spider venoms hold enormous promise as economically important insecticides and therapeutics (Saez et al., 2010;King & Hardy, 2013). Moreover, no other animal lineage can claim a more varied and elegant use of silk. A single species may have as many as eight different silk glands, producing a variety of super-strong silks deployed in almost every aspect of a spider’s life (Garb, 2013): safety lines, dispersal, reproduction (sperm webs, eggsacs, pheromone trails), and prey capture (Blackledge, Kuntner & Agnarsson, 2011). Silken prey capture webs, particularly the orb, have long been considered a key characteristic contributing to the ecological and evolutionary success of this group (reviewed inBond & Opell, 1998). Moreover, spider silks are promising biomaterials, already benefiting humans in myriad ways—understanding the phylogenetic basis of such super-materials will facilitate efforts to reproduce their properties in biomimetic materials like artificial nerve constructs, implant coatings, and drug delivery systems (Blackledge, Kuntner & Agnarsson, 2011;Schacht & Scheibel, 2014).
Mastigoproctus Liphistiidae Centruroides Damon Ixodes Atypoidina Nemesiidae Mecicobothriidae Theraphosoidina Idiopidae Euctenizidae Ctenizidae Paratropididae Nemesiidae in part
Diguetidae Hypochilidae Dyseridae Caponiidae Filistatidae Segestriidae Sicariidae Pholcidae Scytodidae Leptonetidae Araneidae Nephilidae Nesticidae Pimoidae Linyphiidae Mysmenidae Mimetidae Tetragnathidae Theridiidae Eresidae Uloboridae Oecobiidae Desidae Agelenidae Amaurobiidae Amphinectidae Dictynidae Deinopidae Hahniidae Homalonychidae Gnaphosidae Trachelidae Salticidae Anyphaenidae Thomisidae Pisauridae Lycosidae Pisauridae in part
Oxyopidae Ctenidae 1 2 3 4 7 6 8 9 10 5 11 12 13 14
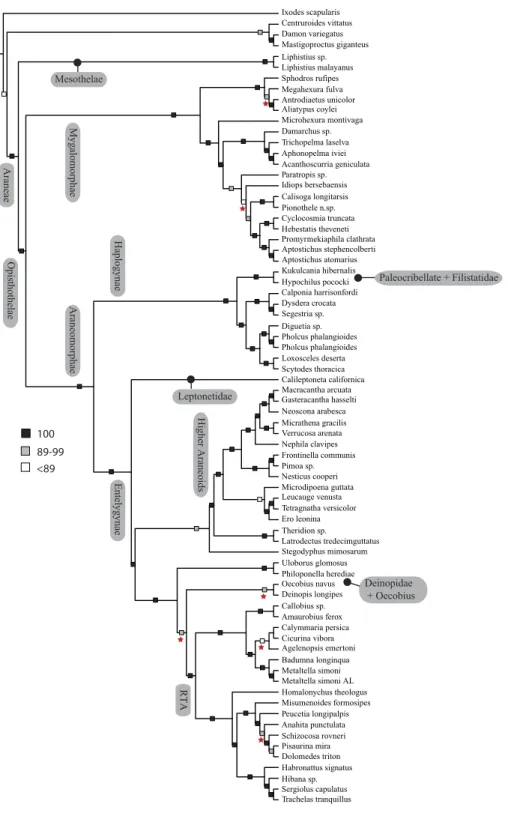
Figure 1 Summary, preferred tree, of spider relationships based on phylogenomic analyses shown in
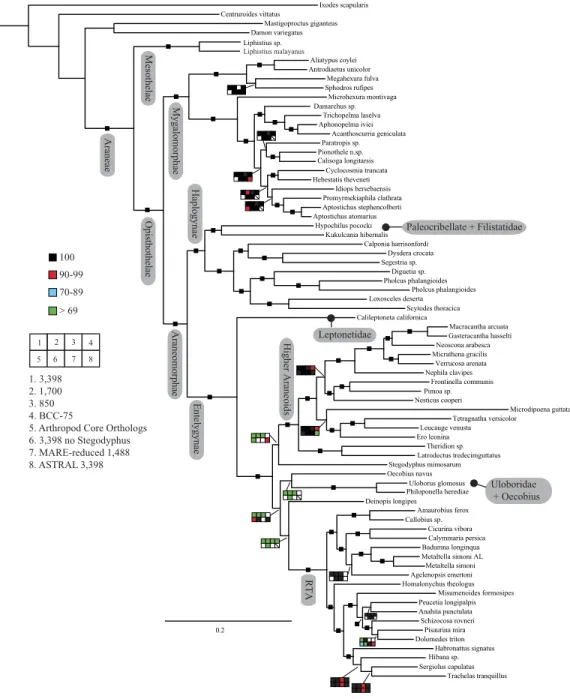
Figure 2 Summary of phylogenomic analyses (matrices outlined inTable 2) summarized on the phylo-genetic hypothesis based on ExaML analysis of dataset 1 (3,398 OGs). Box plots indicate bootstrap value ranges for each node across matrices 1–7; single solid blocks indicate bootstrap values of 100% in all anal-yses.
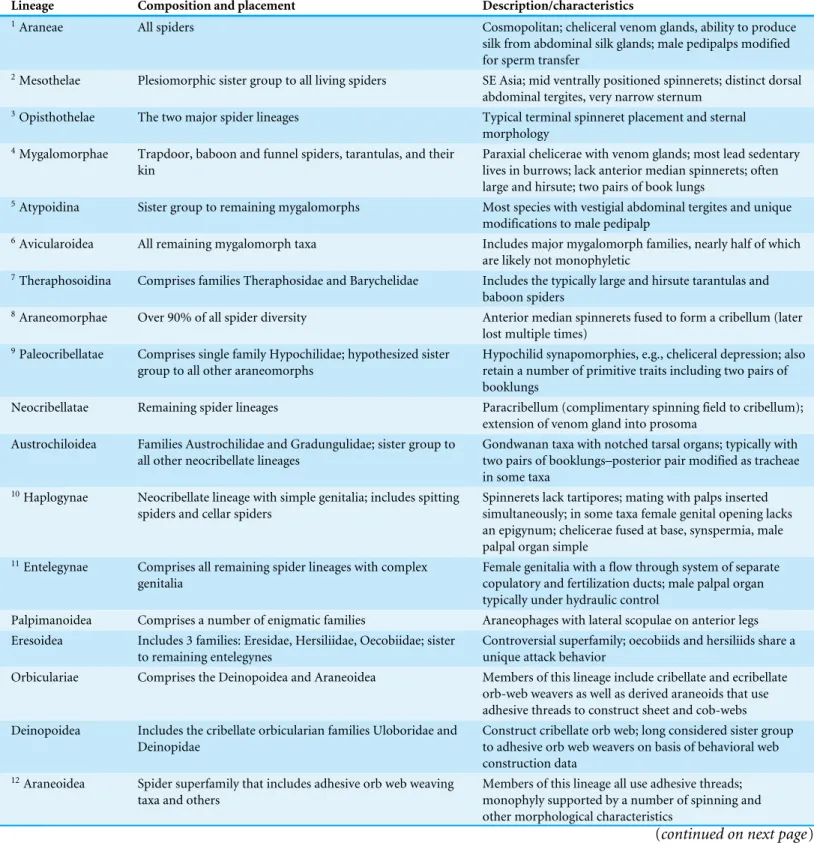
Table 1 Major spider lineages referenced throughout the text.Superscripts (column 1) reference node labels inFig. 1(summary of family level relationships).
Lineage Composition and placement Description/characteristics
1Araneae All spiders Cosmopolitan; cheliceral venom glands, ability to produce
silk from abdominal silk glands; male pedipalps modified for sperm transfer
2Mesothelae Plesiomorphic sister group to all living spiders SE Asia; mid ventrally positioned spinnerets; distinct dorsal abdominal tergites, very narrow sternum
3Opisthothelae The two major spider lineages Typical terminal spinneret placement and sternal
morphology 4Mygalomorphae Trapdoor, baboon and funnel spiders, tarantulas, and their
kin
Paraxial chelicerae with venom glands; most lead sedentary lives in burrows; lack anterior median spinnerets; often large and hirsute; two pairs of book lungs
5Atypoidina Sister group to remaining mygalomorphs Most species with vestigial abdominal tergites and unique
modifications to male pedipalp
6Avicularoidea All remaining mygalomorph taxa Includes major mygalomorph families, nearly half of which
are likely not monophyletic
7Theraphosoidina Comprises families Theraphosidae and Barychelidae Includes the typically large and hirsute tarantulas and baboon spiders
8Araneomorphae Over 90% of all spider diversity Anterior median spinnerets fused to form a cribellum (later
lost multiple times) 9Paleocribellatae Comprises single family Hypochilidae; hypothesized sister
group to all other araneomorphs
Hypochilid synapomorphies, e.g., cheliceral depression; also retain a number of primitive traits including two pairs of booklungs
Neocribellatae Remaining spider lineages Paracribellum (complimentary spinning field to cribellum);
extension of venom gland into prosoma Austrochiloidea Families Austrochilidae and Gradungulidae; sister group to
all other neocribellate lineages
Gondwanan taxa with notched tarsal organs; typically with two pairs of booklungs–posterior pair modified as tracheae in some taxa
10Haplogynae Neocribellate lineage with simple genitalia; includes spitting spiders and cellar spiders
Spinnerets lack tartipores; mating with palps inserted simultaneously; in some taxa female genital opening lacks an epigynum; chelicerae fused at base, synspermia, male palpal organ simple
11Entelegynae Comprises all remaining spider lineages with complex genitalia
Female genitalia with a flow through system of separate copulatory and fertilization ducts; male palpal organ typically under hydraulic control
Palpimanoidea Comprises a number of enigmatic families Araneophages with lateral scopulae on anterior legs
Eresoidea Includes 3 families: Eresidae, Hersiliidae, Oecobiidae; sister to remaining entelegynes
Controversial superfamily; oecobiids and hersiliids share a unique attack behavior
Orbiculariae Comprises the Deinopoidea and Araneoidea Members of this lineage include cribellate and ecribellate
orb-web weavers as well as derived araneoids that use adhesive threads to construct sheet and cob-webs Deinopoidea Includes the cribellate orbicularian families Uloboridae and
Deinopidae
Construct cribellate orb web; long considered sister group to adhesive orb web weavers on basis of behavioral web construction data
12Araneoidea Spider superfamily that includes adhesive orb web weaving taxa and others
Members of this lineage all use adhesive threads; monophyly supported by a number of spinning and other morphological characteristics
Table 1(continued)
Lineage Composition and placement Description/characteristics
13RTA Large diverse lineage of spiders that includes wolf, jumping, running, fishing, and crab spiders
Defined primarily by the presence of a projection on the male palp–the retrolateral tibial apophysis (RTA) 14Dionycha Subclade of the RTA lineage, comprises about 1/3 of all
spider diversity
Defined as a group based on their two clawed condition with flanking tufts of setae for adhesion to smooth surfaces Lycosoidea Large superfamily comprising 10 families including fishing
and wolf spiders
Monophyly of this superfamily is based on a number of morphological features (not universal) including a grate-shaped tapetum, an oval-grate-shaped calamistrum, and male palpal features
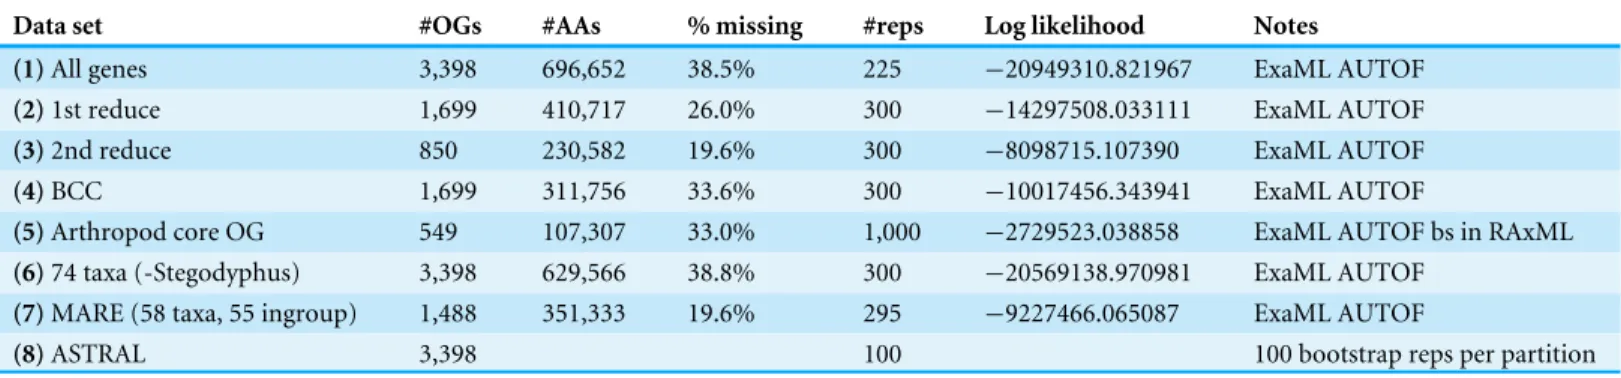
Table 2 Summary of all phylogenomic analyses. Data matrix numbers correspond toFig. 2, inset.
Data set #OGs #AAs % missing #reps Log likelihood Notes
(1)All genes 3,398 696,652 38.5% 225 −20949310.821967 ExaML AUTOF
(2)1st reduce 1,699 410,717 26.0% 300 −14297508.033111 ExaML AUTOF
(3)2nd reduce 850 230,582 19.6% 300 −8098715.107390 ExaML AUTOF
(4)BCC 1,699 311,756 33.6% 300 −10017456.343941 ExaML AUTOF
(5)Arthropod core OG 549 107,307 33.0% 1,000 −2729523.038858 ExaML AUTOF bs in RAxML
(6)74 taxa (-Stegodyphus) 3,398 629,566 38.8% 300 −20569138.970981 ExaML AUTOF
(7)MARE (58 taxa, 55 ingroup) 1,488 351,333 19.6% 295 −9227466.065087 ExaML AUTOF
(8)ASTRAL 3,398 100 100 bootstrap reps per partition
within which Austrochiloidea is sister to the major clades Haplogynae (Node 10) and Entelegynae (Node 11), each weakly to moderately supported by few morphological features. Haplogynes have simple genitalia under muscular control whereas entelegynes have hydraulically activated, complex genitalia, with externally sclerotized female epigyna. Entelegynes comprise multiple, major, hyperdiverse groups, including the ‘‘RTA clade’’ (RTA=retrolateral tibial apophysis, Node 13), its subclade Dionycha (e.g., jumping
spiders;Ramírez, 2014, Node 14), and the Orbiculariae—the cribellate and ecribellate orb weavers and relatives (seeHormiga & Griswold, 2014).
Incongruence between the traditional spider classification scheme and (non-phylogenomic) molecular systematics likely has one primary cause: too few data. Non-molecular datasets to date have been restricted to a relatively small set of morphological and/or behavioral characters whereas molecular analyses addressing deep spider relationships have largely employed relatively few, rapidly evolving loci (e.g., 28S and 18S rRNA genes, Histone 3, and a number of mitochondrial DNA markers).
The first analyses of spider relationships using genome-scale data, scored for 40 taxa by Bond et al. (2014) and for 14 taxa by Fernández, Hormiga & Giribet (2014), considerably refined understanding of spider phylogeny, the former explicitly calling into question long held notions regarding the tempo and mode of spider evolution. Using transcriptome-derived data, Bond et al. (2014)recovered the monophyly of some major groups (araneomorphs and mygalomorphs) but reshuffled several araneomorph lineages (haplogynes, paleocribellates, orbicularians, araneoids (Node 12) and the RTA clade). Notably, Bond et al. (2014)and Fernández, Hormiga & Giribet (2014)rejected Orbiculariae, which included both cribellate (Deinopoidea) and ecribellate orb weavers (Araneoidea). Instead they suggested either that the orb web arose multiple times, or, more parsimoniously, that it arose once and predated the major diversification of spiders. Despite significant advances in understanding of spider phylogeny, only a small percentage of spider families were sampled and monophyly of individual families could not be tested in previous phylogenomic studies. Denser taxon sampling is needed to warrant changes in higher classification and to more definitively address major questions about spider evolution.
Herein, we apply a spider-specific core ortholog approach with significantly increased taxon and gene sampling to produce a more complete and taxon specific set of alignments for phylogenetic reconstruction and assessment of spider evolutionary pattern and process. Existing genome-derived protein predictions and transcriptome sequences from a representative group of spiders and arachnid outgroups were used to create a custom core ortholog set specific to spiders. Taxon sampling was performed to broadly sample Araneae with an emphasis on lineages whose phylogenetic placement is uncertain and included previously sequenced transcriptomes, gene models from completely sequenced genomes, and novel transcriptome sequences generated by our research team. This resulted in a data set comprising 70 spider taxa plus five additional arachnid taxa as outgroups. We test long-held notions that the orb web, in conjunction with ecribellate adhesive threads, facilitated diversification among araneoids and present the most completely sampled phylogenomic data set for spiders to date using an extensive dataset of nearly 3,400 putative genes (∼700 K amino acids). Further, we test the hypothesis of a non-monophyletic Orbiculariae,
MATERIALS & METHODS
Sampling, extraction, assembly
Spider sequence data representing all major lineages were collected from previously published transcriptomic and genomic resources (N=53) and supplemented with
newly sequenced transcriptomes (N =21) to form the target taxon set for the
current study. Existing sequence data were acquired via the NCBI SRA database (http://www.ncbi.nlm.nih.gov/sra). Raw transcriptome sequences were downloaded, converted to fastq file format, and assembled using Trinity (Grabherr et al., 2011). Genomic data sets in the form of predicted proteins were downloaded directly from the literature (Sanggaard et al., 2014) for downstream use in our pipeline. Newly sequenced spiders were collected from a variety of sources, extracted using the TRIzol total RNA extraction method, purified with the RNeasy mini kit (Qiagen) and sequenced in-house at the Auburn University Core Genetics and Sequencing Laboratory using an Illumina Hi-Seq 2500. This produced 100bp paired end reads for each newly sequenced spider transcriptome, which were then assembled using Trinity. Proteins were predicted from each transcriptome using the program TransDecoder (Haas et al., 2013).
Core ortholog approach and data processing
We employed a core ortholog approach for putative ortholog selection and implicitly compared the effect of using a common arthropod core ortholog set and one compiled for spiders; the arthropod core ortholog set was deployed as described inBond et al. (2014). To generate the spider core ortholog set, we used an all-versus-all BLASTP method (Altschul et al., 1990) to compare the transcripts of the amblypygidDamon variegatus, and the spiders Acanthoscurria geniculata, Dolomedes triton, Ero leonina, Hypochilus pococki,
Leucauge venusta,Liphistius malayanus,Megahexura fulva,Neoscona arabesca,Stegodyphus
mimosarum, andUloborus sp..Acanthoscurria geniculataandStegodyphus mimosarumwere
represented by predicted transcripts from completely sequenced genomes while the other taxa were represented by our new Illumina transcriptomes. An e-value cut-off of 10–5 was used. Next, based on the BLASTP results, Markov clustering was conducted using OrthoMCL 2.0 (Li, Stoeckert & Roos, 2003) with an inflation parameter of 2.1.
was then employed as a tree-based approach to screen each candidate OG for evidence of paralogy. First, nodes with support values below 0.95 were collapsed into polytomies. Next, the maximally inclusive subtree was selected where all taxa were represented by no more than one sequence or, in cases where more than one sequence was present for any taxon, all sequences from that taxon formed a monophyletic group or were part of the same polytomy. Putative paralogs (sequences falling outside of this maximally inclusive subtree) were then deleted from the input alignment. In cases where multiple sequences from the same taxon formed a clade or were part of the same polytomy, all sequences but the longest were deleted. Lastly, in order to eliminate orthology groups with poor taxon sampling, all groups sampled for fewer than 7 of the 11 taxa and all groups not sampled
forMegahexura fulva(taxon with greatest number of identified OGs) were discarded. The
remaining alignments were used to build profile hidden Markov models (pHMMs) for HaMStR with hmmbuild and hmmcalibrate from the HMMER package (Eddy, 2011).
shortest sequence not meeting this criterion. This step was necessary for downstream single-gene phylogenetic tree reconstruction. As a final filtering step, OGs sampled for fewer than 10 taxa were discarded.
In some cases, a taxon was represented in an OG by two or more sequences (splice variants, lineage-specific gene duplications (= inparalogs), overlooked paralogs, or
exogenous contamination). In order to select the best sequence for each taxon and exclude any overlooked paralogs or exogenous contamination, we built trees in FastTree 2 (Price, Dehal & Arkin, 2010) and used PhyloTreePruner to select the best sequence for each taxon as described above. Remaining OGs were then concatenated using FASconCAT (Kück & Meusemann, 2010). The OGs selected by our bioinformatic pipeline were further screened in seven different ways (subsets listed inTable 2). OGs were first sorted based on amount of missing data; the half with the lowest levels was pulled out as matrix 2 (1,699 genes). From matrix 2, a smaller subset of OGs optimized for gene occupancy was extracted, resulting in matrix 3 (850 genes). The full supermatrix (matrix 1) was also optimized using the programs MARE (Meyer, Meusemann & Misof, 2011) and BaCoCa (Base Composition Calculator;
Kück & Struck, 2014). MARE assesses the supermatrix by partition, providing a measure of tree-likeness for each gene and optimizes the supermatrix for information content. The full supermatrix was optimized with an alpha value of 5, to produce matrix 7 (1,488 genes, 58 taxa). From the MARE-reduced matrix, genes having no missing partitions for any of the remaining taxa (n=50) were extracted to form a starting matrix for the BEAST analyses
(details below). Matrix assessment was also conducted using BaCoCa, which provides a number of descriptive supermatrix statistics for evaluating bias in amino acid composition and patterns in missing data. This program was used to assess patterns of non-random clusters of sequences in the data, which could potentially mislead phylogenetic analyses. Matrix 4 represents a 50% reduction of the full supermatrix using BaCoCa derived values for phylogenetically informative sites as a guide; essentially reducing missing data from absent partitions and gaps. This matrix is similar, but not identical to matrix 2. Matrix 5 resulted from application of arthropod core OGs fromBond et al. (2014)to the extended taxon set. Matrix 6 represents the full spider core OG matrix (matrix 1) withStegodyphus
pruned from the tree. OGs for each matrix were concatenated using FASconCAT (Kück & Meusemann, 2010).
Phylogenetics
analyses were conducted on the Auburn University CASIC HPC and Atrax (Bond Lab, Auburn University).
A coalescent-based method as implemented in ASTRAL (Accurate Species TRee ALgorithm;Mirarab et al., 2014) was used to infer a species tree from a series of unrooted gene trees. The ASTRAL approach is thought to be more robust to incomplete lineage sorting, or deep coalescence, than maximum likelihood analysis of concatenated matrices and works quickly on genome-scale datasets (Mirarab et al., 2014). We first constructed individual gene trees for all partitions contained within matrix 1. Gene trees were generated using ML based on 100 RAxML random addition sequence replicates followed by 100 bootstrap replicates (Table 2). Subsequent species tree estimation was inferred using ASTRAL v4.7.6, from all individual unrooted gene trees (and bootstrap replicates), under the multi-species coalescent model.
A chronogram was inferred in a Bayesian framework under an uncorrelated lognormal relaxed clock model (Drummond et al., 2006;Drummond, 2007) using Beast v1.8.1 (Drummond et al., 2012). For this analysis we used 43 partitions of a matrix which included complete partitions for all taxa derived from the MARE-optimized matrix 7. The model of protein evolution for each partition was determined using the perl script ProteinModelSelection.pl in RAxML. BEAST analyses were run separately for each partition using eight calibration points based on fossil data. The most recent common ancestor (MRCA) of Mesothelae + all remaining spiders was given a lognormal prior of (mean in real space) 349 Ma (SD=0.1) based on the Mesothelae fossilPalaeothele montceauensis(Selden,
1996). The MRCA of extant araneomorphs was given a lognormal prior of (mean in real space) 267 Ma (SD =0.2) based on the fossilTriassaraneus andersonorum(Selden et al.,
1999). The MRCA of extant mygalomorphs was given a lognormal prior of (mean in real space) 278 Ma (SD=0.1) based on the fossilRosamygale grauvogeli(Selden & Gall, 1992).
The MRCA of Haplogynae + Hypochilidae was given a lognormal prior of (mean in real space) 278 Ma (SD=0.1) based on the fossilEoplectreurys gertschi(Selden & Penney, 2010).
The MRCA of Deinopoidea (cribellate orb-weavers) was given a lognormal prior of (mean in real space) 195 Ma (SD =0.3) based on the fossilMongolarachne jurassica(Selden,
Shih & Ren, 2013). The MRCA of ecribellate orb-weavers was given a lognormal prior of (mean in real space) 168 Ma (SD=0.4) based on the fossilMesozygiella dunlopi(Penney
& Ortu, 2006). The MRCA of Nemesiidae, excludingDamarchus, was given a lognormal prior of (mean in real space) 168 Ma (SD=0.4) based on the nemesiid fossilCretamygale chasei(Selden, 2002). Finally, the MRCA of Antrodiaetidae was given a lognormal prior of (mean in real space) 168 Ma (SD=0.4) based on the fossilCretacattyma raveni(Eskov &
95% highest posterior density dates obtained for the BEAST analysis were incorporated as constraints for node ages of the eight fossil calibrated nodes. The analysis was performed using the TN algorithm, cross validation of branch-length variation and rate variation modeled as a gamma distribution with an alpha shape parameter.
To detect diversification rate shifts, we performed a Bayesian analysis of diversification in BAMM (Bayesian Analysis of Macroevolutionary Mixtures;Rabosky et al., 2014). For this analysis we used the chronogram obtained by the r8s analysis in order to maximize taxon sampling. To account for non-random missing speciation events, we quantified the percentage of taxa sampled per family (World Spider Catalog, 2015) and incorporated these into the analysis. We also accounted for missing families sampled. The MCMC chain was run for 100,000,000 generations, with sampling every 10,000 generations. Convergence diagnostics were examined using coda (Plummer et al., 2006) in R. Ten percent of the runs were discarded as burn-in. The 95% credible set of shift configurations was plotted in the R package BAMMtools (Rabosky et al., 2014).
Character state reconstructions of web type following Blackledge et al. (2009)were performed using a maximum likelihood approach. The ML approach was implemented using the rayDISC command in the package corHMM (Beaulieu, O’Meara & Donoghue, 2013) in R (Ihaka & Gentleman, 1996). This method allows for multistate characters, unresolved nodes, and ambiguities (polymorphic taxa or missing data). Three models of character evolution were evaluated under the ML method: equal rates (ER), symmetrical (SYM) and all rates different (ARD). A likelihood-ratio test was performed to select among these varying models of character evolution.
RESULTS
Summary of genomic data
for the spider core ortholog set generated for this study. Our new HaMStR spider core ortholog set andAcanthoscurria geniculataBLAST database file can be downloaded from the Dryad Data Repository at doi:10.5061/dryad.6p072.
Phylogenetic analyses
Seven super matrices were generated for downstream non time-calibrated analyses (Fig. 2), one drawn from the arthropod core set and six using the spider core set. Data set sizes, summarized inTable 2, ranged from a maximum of 3,398 OGs with a higher percentage of missing cells (38.5%), 850 OGs with 19.6% missing, to 549 OGs (arthropod core set) with 33% missing data. Two matrices were generated using automated filtering approaches implemented by BaCoCa (Kück & Struck, 2014) and MARE (Meyer, Meusemann & Misof, 2011). In BaCoCa we sorted partitions using number of informative sites, capturing the top half (1,700 OGs) of the matrix containing the most informative sites. RCFV values generated by BaCoCa were <0.05 for all taxa in all partitions for each of the matrices, indicating homogeneity in base composition. Additionally, there was no perceptible taxonomic bias observed in shared missing data (Figs. S1–S6). The MARE optimized matrix comprised 58 taxa and 1,488 genes with 19.6% missing data. For graphical representations of gene occupancy for each matrix, seeFigs. S7–S12. Blast2GO (Conesa et al., 2005) gene ontology distributions of molecular function for OGs recovered from both the spider and arthropod ortholog sets (Figs. S13andS14) can be found in theSupplemental Information.
Our phylogenetic analyses (seeTable 2 and ‘Discussion’), the results of which are summarized in Fig. 2, consistently recover many well-supported monophyletic groups: Araneae, Mygalomorphae, Araneomorphae, Synspermiata (i.e., Haplogynae excluding Filistatidae and Leptonetidae), Entelegynae, the RTA clade, Dionycha, and Lycosoidea. Within Mygalomorphae, Atypoidina and Avicularioidea are monophyletic; Nemesiidae is polyphyletic. Filistatidae (Kukulcania) emerges as the sister group to Hypochilus. Interestingly, Leptonetidae emerges as the sister group to Entelegynae. Eresidae is sister to Araneoidea, similar to findings of Miller et al. (2010). Deinopoidea is polyphyletic. Oecobiidae is sister to Uloboridae, which are together sister to Deinopidae plus the RTA clade. Homalonychidae and by implication the entire Zodarioidea (Miller et al., 2010), is sister to Dionycha plus Lycosoidea. Hahniidae, represented by the cryphoecineCalymmaria, is sister to Dictynidae. Thomisidae belongs in Lycosoidea as proposed byHomann (1971)
andPolotow, Carmichael & Griswold (2015)(see alsoRamírez, 2014).
Coalescent-based species-tree analysis in ASTRAL employed unrooted gene trees based on the 3,398 gene matrix as input and inferred a well-supported tree (most nodes >95% bs;Fig. 3). With few exceptions the topology recovered using this approach was congruent with the likelihood-based supermatrix analysis. Conflicting nodes, some corresponding to key araneomorph lineages, which were moderately to weakly supported in concatenated analyses, are summarized inFig. 2.
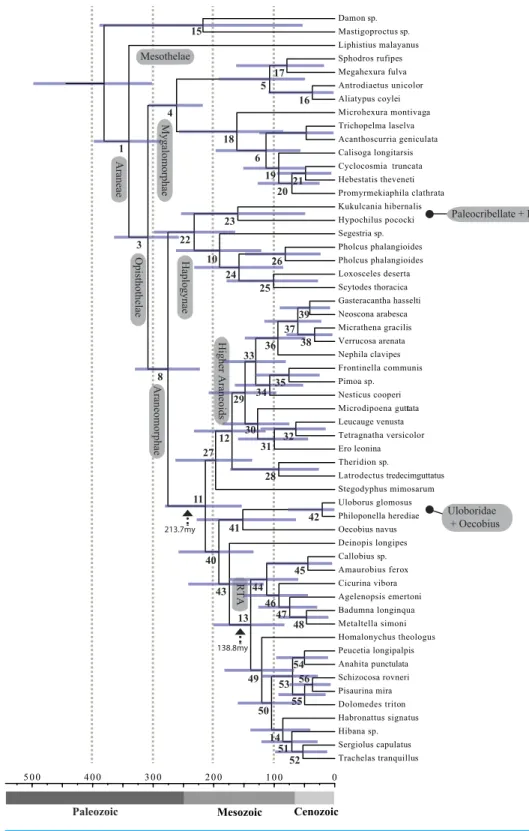
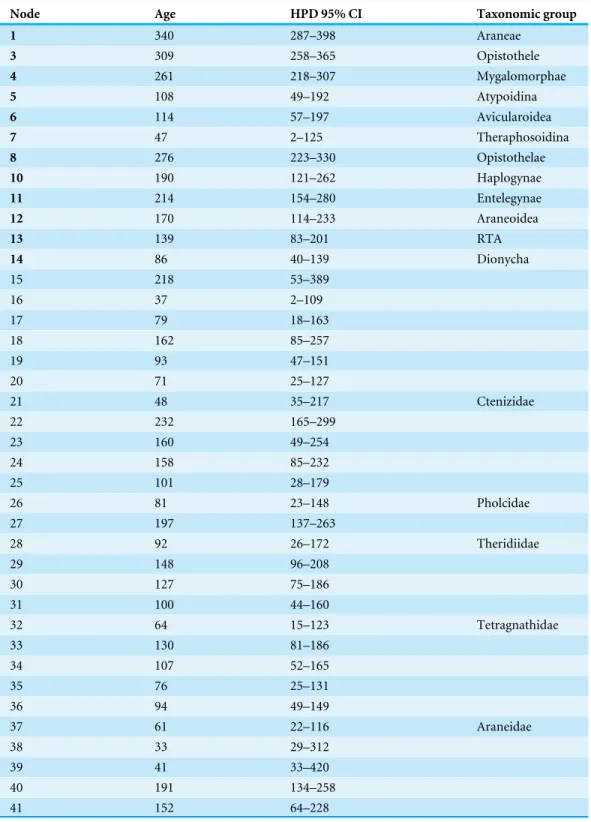
Table 3 Posterior probabilities (PP), ages (Ma), and 95% confidence intervals (CI) for the highest pos-terior density (HPD) recovered by the BEAST analysis. Node numbers correspond toFig. 5. Node num-bers in bold correspond to numnum-bers inFig. 1andTable 1.
Node Age HPD 95% CI Taxonomic group
1 340 287–398 Araneae
3 309 258–365 Opistothele
4 261 218–307 Mygalomorphae
5 108 49–192 Atypoidina
6 114 57–197 Avicularoidea
7 47 2–125 Theraphosoidina
8 276 223–330 Opistothelae
10 190 121–262 Haplogynae
11 214 154–280 Entelegynae
12 170 114–233 Araneoidea
13 139 83–201 RTA
14 86 40–139 Dionycha
15 218 53–389
16 37 2–109
17 79 18–163
18 162 85–257
19 93 47–151
20 71 25–127
21 48 35–217 Ctenizidae
22 232 165–299
23 160 49–254
24 158 85–232
25 101 28–179
26 81 23–148 Pholcidae
27 197 137–263
28 92 26–172 Theridiidae
29 148 96–208
30 127 75–186
31 100 44–160
32 64 15–123 Tetragnathidae
33 130 81–186
34 107 52–165
35 76 25–131
36 94 49–149
37 61 22–116 Araneidae
38 33 29–312
39 41 33–420
40 191 134–258
41 152 64–228
Table 3(continued)
Node Age HPD 95% CI Taxonomic group
42 21 28–126 Uloboridae
43 174 117–242
44 112 60–174
45 44 4–113
46 92 44–149
47 74 29–126
48 47 34–243
49 120 68–182
50 104 57–160
51 71 28–121
52 52 36–130
53 70 28–120 Lycosoidea
54 50 35–735
55 49 15–93
56 37 27–211
(95% CI[223–330]); RTA+Deinopoidea—Stegodyphus+Araneoidea at 214 Ma (95%
CI[154–280]); RTA—Dionycha at 138.8 Ma (Fig. 4).
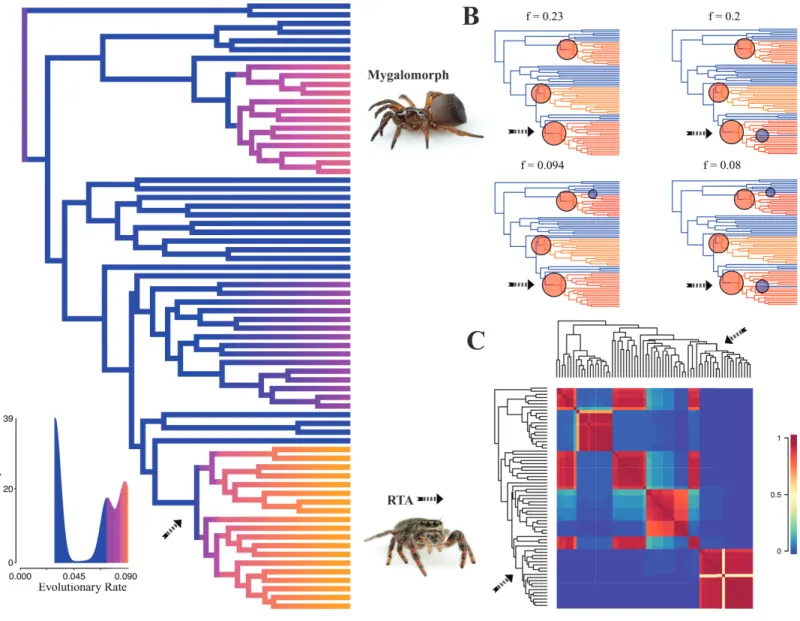
Diversification rate shift analysis estimated three instances of significant diversification shifts within spiders (95% credibility). The highest rate shift is within the RTA+Dionycha +Lycosoidea (Fig. 5) followed by Avicularioidea and within Araneoidea (f =0.23; 0.21; Fig. 5).
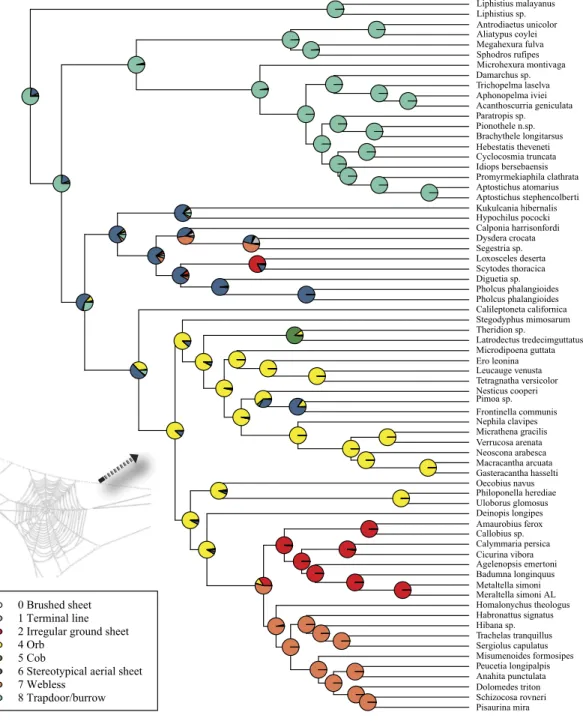
Maximum likelihood ancestral state reconstruction of web type (Fig. 6) shows that the spider common ancestor likely foraged from a subterranean burrow, sometimes sealed by a trapdoor. The ancestral condition for araneomorphs may have been a stereotypical aerial sheet. Entelegynae ancestors probably spun orbs, which were subsequently lost at least three times. RTA taxa largely abandoned webs to become hunting spiders. Precise location of these character state shifts depends upon sufficient sampling; denser sampling reduces the number of unobserved evolutionary events. While this analysis contains only 47 of 114 spider families, the sequence and overall mapping to the spider backbone phylogeny is strongly supported.
DISCUSSION
A
B
C
Figure 5 Time-calibrated phylogeny of spiders with branches colored by reconstructed net diversification rates (A).Rates on branches are means of the marginal densities of branch-specific rates. Inset histogram shows posterior density of speciation rates. Smaller phylogenies (B) show the four distinct shift configurations with the highest posterior probability. For each distinct shift configuration, the locations of rate shifts are shown as red (rate increases) and blue (rate decreases) circles, with circle size proportional to the marginal probability of the shift. The macroevolutionary cohort analysis (C) displays the pairwise probability that any two species share a common macroevolutionary rate dynamic. Dashed arrow indicates position of RTA clade on each tree.
the orb web. It shows that the Haplogynae are polyphyletic with Filistatidae as sister to Hypochilidae and Leptonetidae as sister to Entelegynae. It also suggests a position for two enigmatic families—Hahniidae and Homalonychidae—and provides an alternate view of RTA relationships and the contents of Dionycha clade.
Data characteristics and development of spider core orthologs
Figure 6 ML ancestral state reconstructions of web type on the time-calibrated phylogeny of spiders.
Circle areas correspond to probability of ancestral states. The arrow points to the origin of the orb web at the MRCA of Entelegynae excluding Leptonetidae.
in the ortholog detection and filtering stages of phylogenomic analyses (Bond et al., 2014;
Fernández, Hormiga & Giribet, 2014).Lemmon et al. (2009)and a number of other authors (Roure, Baurain & Philippe, 2013;Dell’Ampio et al., 2014;Xia, 2014) have discussed the potential negative effects of such missing data in large phylogenomic (transcriptome-based) datasets. Recent studies argue that the phylogenetic signal from transcriptomes can conflict with alternative reduced representation approaches like targeted sequence capture (Jarvis et al., 2014;Brandley et al., 2015;Prum et al., 2015). From vast amounts of bird genome protein-coding data,Jarvis et al. (2014)concluded that these loci were not only insufficient (low support values), but also misleading due to convergence and high levels of incomplete lineage sorting during rapid radiations.
Simulation studies now predict that 10s–100s of loci will resolve most phylogenies, albeit this is sensitive to factors such as population size or speciation tempos (Knowles & Kubatko, 2011;Leache & Rannala, 2011;Liu & Yu, 2011). To mitigate the impacts of paralogy, incomplete lineage sorting, and missing data, we developeda prioria set of spider core orthologs that comprise a database consisting of over 4,500 genes that are expected to be recovered from most whole spider RNA extractions and are likely orthologous. We summarize the annotations for each of the genes in the HaMStR pHMM file inTable S3.
Our approach enhances repeatability, downstream assessment, scalability (taxon addition), and data quality. Studies that employ pure clustering approaches like OMA stand-alone (Altenhoff et al., 2013) may produce more data (i.e., more ‘‘genes’’) on the front end; however, they present some problems in terms of ease of scalability. Although adding more genes is one strategy, it is increasingly clear that taxon sampling and data quality are very important (Lemmon & Lemmon, 2013;Bond et al., 2014).
A modified view of spider evolution and key innovations
Once considered the ‘‘crowning achievement of aerial spiders’’ (Gertsch, 1979), the orb web and consequent adaptive radiation of araneoid spiders (ecribellate orb weavers and their relatives) has captured the imagination of spider researchers for over a century. The evolution of adhesive threads and the vertical orientation of the orb web, positioned to intercept and retain flying insects, has been long considered a ‘‘key innovation’’ that allowed spiders to inhabit a new adaptive zone (Bond & Opell, 1998). It is important to note that several prior authors speculated about orb web adaptive value, such asLevi (1980),Opell (1979),Opell (1982)andCoddington (1986)althoughBond & Opell (1998)quantified the pattern in a formal phylogenetic framework. Over 25% of all described spider species are araneoids. Given orb weaver monophyly on quantitative phylogenies (Griswold et al., 1998;
Blackledge et al., 2009), rigorous empirical studies tended to confirm the orb as a prime cause of spider diversification (Bond & Opell, 1998). Nevertheless, a lack of correlation of the orb web and species richness has been apparent for some time.Griswold et al. (1998)
noted that over 50% of Araneoidea no longer build recognizable orb webs and suggested that ‘‘the orb web has been an evolutionary base camp rather than a summit.’’
study (Fig. 6) favors the latter: the orb evolves at the base of the araneoid+deinopoid+
RTA clade, but is lost at least three times independently. Large amounts of morphological and behavioral data (albeit often correlated with features essential to the orb) still support the single origin hypothesis (Coddington, 1986;Coddington, 1991;Scharff & Coddington, 1997;Griswold et al., 1998;Agnarsson, Coddington & Kuntner, 2013). Our results suggest both that the orb web originated earlier than previously supposed, and that heretofore-unsuspected clades of spiders descend from orb weavers. In a sense, this ancient origin hypothesis reconciles the implications of genomic data with the classical evidence for multiple, homologous, complex, co-adapted character systems.
Recent discoveries of large, cribellate orb web-weaving taxa from the late Triassic agree with our molecular dates. Diverse Mesozoic deinopoids (Selden, Ren & Shih, 2015) are consistent with the ‘‘orb web node’’ at 213 Ma (Fig. 4andTable 3). Under this view, modern uloborids and deinopids are distinct remnants of this diverse group.Selden, Ren & Shih (2015)previously noted that if other extant taxa ‘‘emerged from the deinopoid stem or crown group it would render the whole-group Deinopoidea paraphyletic’’; we discuss this scenario in detail below.
Contrary to the contemporary paradigm that the evolution of the orb web and adhesive sticky threads elevated rates of diversification among the araneoid spiders, our BAMM analysis (Fig. 5) indicates that the highest rates of diversification likely occurred among the RTA spiders followed by mygalomorphs and then araneoids as a distant third, the latter driven–in part–by the secondarily non-orb weaving theridiids and linyphiids. These results imply that other foraging strategies (e.g., cursorial hunting and irregular sheets) were a more ‘‘successful’’ strategy than the orb. Indeed, the point estimate for the RTA node during the early Cretaceous (138.8 Ma;Fig. 4andTable 3) precedes the subsequent diversification of the RTA clade at 125–100 Ma.
This date coincides with the Cretaceous Terrestrial Revolution (KTR). Angiosperms radiated extensively at 125–90 Ma (Crane & Friis, 1987; Wang, Zhang & Jarzembowski, 2013), as did various plant-dependent insect lineages, including beetles (McKenna et al., 2009;Mckenna et al., 2015), lepidopterans (Wahlberg, Wheat & Peña, 2013), ants (Moreau et al., 2006) and holometabolous insects in general (Misof et al., 2014), although some insect lineages do not show a pulse (e.g., darkling beetles;Kergoat et al., 2014). Spiders, as important insect predators, may also have diversified rapidly along with their prey (e.g.,
date back to 150–125 Ma and diversified during the KTR (LaPolla, Dlussky & Perrichot, 2013;Ward, 2014;Legendre et al., 2015). A major increase in these insect groups may have favoured spiders that feed on cursorial prey and thus could help explain the concurrent increase in diversification in the RTA clade, mygalomorphs, and non-orb weaving araneoids such as cobweb weavers (Dziki et al., 2015).
Taken together, this new evidence on character evolution, divergence estimates, and rates of diversification indicates that previous conclusions regarding the timing and rate of spider evolution were imprecise. Our data support an ancient orb web hypothesis that is further bolstered by a wealth of fossil data showing that a cribellate deinopoid stem group likely diversified during the early Mesozoic. Molecular divergence clock estimates are consistent with the placement of the orb web further down the tree as well as suggesting that some of the greatest rates of species diversification coincided with the KTR. The latter suggests that spiders took advantage of increased abundance of cursorial prey.
These findings likely diminish the hypothesis proposed byBond & Opell (1998)that the vertically oriented orb web represented a key innovation, particularly in light of the fact that over half of araneoid species do not build an orb web (e.g. Theridiidae and Linyphiidae; noted byGriswold et al., 1998;Fernández, Hormiga & Giribet, 2014). We already knew that major orb web-weaving groups are very successful in spite of abandoning the orb (Blackledge et al., 2009).
Spider systematics
Although our results show that many classical ideas in spider systematics require revision (e.g., mygalomorph families, Haplogynae, paleocribellates, higher araneoids, and RTA+
dionychan lineages), they also robustly support many classical taxonomic concepts.
Mygalomorphae relationships
SinceRaven (1985), Mygalomorphae (Table 1, Node 4) has continuously represented a challenge to spider systematics. As discussed byHedin & Bond (2006)andBond et al. (2012), nearly half the families are probably non-monophyletic. While our sampling here and previously (Bond et al., 2014) is far greater than any other published phylogenomic study (e.g.,Fernández, Hormiga & Giribet (2014)included just one theraphosid), taxon sampling remains insufficient to address major issues aside from deeper level phylogenetic problems. However, the data (Fig. 2) support Euctenizidae as a monophyletic family, but not Nemesiidae. As indicated inBond et al. (2014), the once controversial Atypoidina (Node 5) consistently has strong statistical support in all analyses. Alternatively, the placement of paratropidids, ctenizids, and idiopids remains questionable and warrants further sampling.
Haplogynae relationships
Node 9) as sister to Haplogynae. Filistatidae (Kukulcania), which is placed as sister to the ecribellate haplogynes (Synspermiata lineage as proposed in Michalik & Ramírez, 2014), pairs with Hypochilusas in Bond et al. (2014). This arrangement suggests that characters formerly considered ‘‘primitive’’ to araneomorphs, for example, mobile leg three cribellate silk carding, might instead be a synapomorphy for the new hypochilid-filistatid clade. Remaining haplogyne relationships are somewhat congruent with previously published analyses (Ramírez, 2000;Michalik & Ramírez, 2014). However, one of the more intriguing results is the placement of the morphologically intermediate ‘‘haplogyne’’ (Table 1)Calileptoneta(Leptonetidae) as sister to Entelegynae, suggesting that leptonetids may represent intermediate genitalic forms between haplogyne and the relatively more complex entelegyne condition (Ledford & Griswold, 2010). As outlined by Ledford & Griswold (2010), a number of previous analyses (Platnick et al., 1991;Ramírez, 2000;
Griswold et al., 2005) discussed the ‘‘rampant’’ homoplasy required to place leptonetids (sister to Telemidae) among haplogynes and suggest two possible scenarios—leptonetids are proto-entelegynes, or they are the sister group to the remaining Haplogynae. Our phylogenomic analyses support the former hypothesis favored by Ledford & Griswold (2010), and puts the discovery of the cribellateArcholeptonetainto better phylogenetic context. Additionally, these results provide further support for the concept of Synspermiata as proposed byMichalik & Ramírez (2014)and represent a robust phylogenetic framework for understanding the evolution of entelegyne genitalia.
Araneoidea relationships
Our reconstruction of araneoid relationships departs dramatically from the traditional classification scheme and a number of recently published molecular systematic studies (e.g.,
Blackledge et al., 2009; Dimitrov et al., 2012). Theridiidae (cobweb spiders) is sister to the remaining araneoids as opposed to occupying a more derived position within that clade. Comparisons toDimitrov et al. (2012)should be viewed with caution: that analysis contained a large suite of taxa not included here, and many results of that analysis had only weak support. Nevertheless, our phylogenomic data agree in supporting the close relationship between Mysmenidae, Mimetidae, and Tetragnathidae. We also retain the more inclusive linyphioids as close relatives of Araneidae+Nephilidae as inDimitrov
et al. (2012). Unlike that study, we recover nesticids sister to linyphioids (Pimoidae plus Linyphiidae) rather than theridiids: Theridioid (Theridiidae and Nesticidae) diphyly is a surprising result, which has already been shown with standard markers byAgnarsson, Coddington & Kuntner (2013). Theridioids have strikingly similar spinning organs and tarsus IV comb for throwing silk, but are otherwise genitalically distinct. Clearly relationships among the derived araneoids require more intensive sampling, especially of missing families (Theridiosomatidae, Malkaridae, Anapidae, etc.) to adequately resolve their phylogeny.
Deinopoidea relationships
data, is polyphyletic (see alsoDimitrov et al., 2012). Instead, a new clade, Uloboridae+
Oecobiidae, is sister to Deinopidae+the RTA clade. Bootstrap support was consistently low
for the node dividing these two groupings in all analyses except matrix 6 (Fig. 2), which omits the eresid exemplarStegodyphusand matrix 8, the ASTRAL analysis. The placement of the two eresoid taxa (Table 1),StegodyphusandOecobiuscontinues to present difficulties here as in previous published phylogenomic studies (Miller et al., 2010).Fernández, Hormiga & Giribet (2014)found alternative placements forOecobius(their only eresoid) whereasBond et al. (2014)typically recoveredStegodyphusas the sister group to all entelegynes (recovered here as the sister group to araneoids) andOecobiusas a member of a clade comprising uloborid and deinopid exemplars, but with notably lower support. Disparities between the two analyses may be attributed to differences in taxon sampling, which, as noted above, was far greater inBond et al. (2014). On the other hand, increased taxon sampling across the tree diminished node support in some places. However, it is worth noting that support was very strong in the ASTRAL species tree analysis, suggesting that while there may be some conflict among individual data partitions there is an overwhelming amount of signal in the data for a Deinopoidea +RTA relationship. This trend was noted byBond et al.
(2014)who found that only 2.4% of all bootstrap replicates recovered a monophyletic Orbiculariae. Based on these data and the putative rapid diversification that occurred once the orb web was abandoned, it is clear that resolving relationships at this point in spider evolutionary history remains a challenge. Finally,Bond et al. (2014)andAgnarsson, Coddington & Kuntner (2013)recovered an unexpected relationship between eresoid taxa and deinopoids that consistently rendered the Deinopoidea paraphyletic or polyphyletic if
Oecobiuswas included in the analysis. Our results, here including an additional uloborid
exemplar, still confirm Deinopoidea polyphyly. Perhaps careful examination ofOecobius
web morphology and spinning behavior will provide independent corroboration of this molecular signal.
RTA and Dionycha relationships
Although all of our analyses recover a monophyletic RTA clade, relationships among its members reflect some departure from the traditional view of RTA phylogeny but are largely consistent with a more recent morphology-based study. We recover a clade that comprises a mix of agelenoids (Agelenidae, Desidae, and Amphinectidae) as a sister group to Dictynidae
+Hahniidae and Amaurobiidae. The taxonomic composition of Dictynidae, Hahniidae
and Amaurobiidae, as well as their phylogenetic placement, remains problematic and in a state of flux (Coddington, 2005;Spagna, Crews & Gillespie, 2010;Miller et al., 2010). The typical hahniines have been difficult to place due to their long branches (Spagna & Gillespie, 2008;Miller et al., 2010).Calymmaria, has been moved into ‘‘Cybaeidae s.l.’’ bySpagna, Crews & Gillespie (2010), suggesting that the relationships among hahniids, cybaeids, and dictynids need further scrutiny.
grouping corroborates previous findings (Miller et al., 2010;Spagna, Crews & Gillespie, 2010). Dictynids on the other hand were considered one of the unresolved sister groups to amaurobioids, zodarioids, and dionychans (Spagna, Crews & Gillespie, 2010). Here the placement of our dictynid exemplarCicurinais more precise: sister group to the hahniid
Calymmaria(as inMiller et al., 2010).
We also recover Homalonychidae (representing Zodarioidea) as the sister group to dionychans and lycosoids, once again, mirroring the results ofAgnarsson, Coddington & Kuntner (2013). Previously Zodarioidea was placed closer to the base of the RTA clade (Miller et al., 2010). Dionychans here include salticids, anyphaenids, corinnids, and gnaphosids whereas crab spiders (Thomisidae) nest with the lycosoids containing a paraphyletic Pisauridae. Placement of Thomisidae within Lycosoidea goes back at least toHomann (1971)and was formally established byBayer & Schönhofer (2013)and the total evidence analysis ofPolotow, Carmichael & Griswold (2015). AlthoughRamírez (2014)
placed Thomisidae outside of Lycosoidea, in one of his slightly suboptimal results thomisids were included in Lycosoidea. The relationships we recover among dionychan and lycosoid taxa are largely congruent with those inferred byRamírez (2014)in a massive morphological study of Dionycha and RTA exemplars. Given the general incongruence among previous morphological and molecular spider systematic studies, it will be interesting to see howRamírez (2014)phylogeny and familial-level reevaluations compare as phylogenomic studies expand.Raven (1985)was a landmark study for mygalomorphs; perhapsRamírez (2014)may serve in the same capacity for one of the most diverse branches on the spider tree of life.
CONCLUSIONS
Following Coddington & Levi (1991), higher-level spider classification underwent a series of challenges from quantitative studies of morphology, producing provocative but weakly-supported hypotheses (Griswold et al., 1998; Griswold et al., 2005). Total evidence studies, for example,Wood, Griswold & Gillespie (2012a);Wood et al. (2012b)
webless hunting. Our results and those of others like Ramírez (2014)show that spider systematics still remains a work in progress with many questions yet unanswered.
ACKNOWLEDGEMENTS
This is contribution 730 of the Auburn University Museum of Natural History. The authors would like to thank an anonymous reviewer, S Edwards, F Labarque, P Michalik, J Miller, MJ Ramirez, and R Raven for insightful comments on earlier drafts of this manuscript.
ADDITIONAL INFORMATION AND DECLARATIONS
Funding
This work was partially funded by Auburn University and National Science Foundation grant DEB 1256139. The funders had no role in study design, data collection and analysis, decision to publish, or preparation of the manuscript.
Grant Disclosures
The following grant information was disclosed by the authors:
Auburn University and National Science Foundation grant: DEB 1256139.
Competing Interests
The authors declare there are no competing interests.
Author Contributions
• Nicole L. Garrison conceived and designed the experiments, performed the experiments,
analyzed the data, wrote the paper, prepared figures and/or tables, reviewed drafts of the paper.
• Juanita Rodriguez and Kevin M. Kocot conceived and designed the experiments,
performed the experiments, analyzed the data, wrote the paper, reviewed drafts of the paper.
• Ingi Agnarsson reviewed drafts of the paper.
• Jonathan A. Coddington wrote the paper, reviewed drafts of the paper.
• Charles E. Griswold and Marshal Hedin contributed reagents/materials/analysis tools,
wrote the paper, reviewed drafts of the paper.
• Christopher A. Hamilton analyzed the data, reviewed drafts of the paper.
• Joel M. Ledford contributed reagents/materials/analysis tools, reviewed drafts of the
paper.
• Jason E. Bond conceived and designed the experiments, performed the experiments,
DNA Deposition
The following information was supplied regarding the deposition of DNA sequences: Illumina transcriptome sequence data are available from NCBI database archive under accession numbers SAMN04453329–SAMN04453350. Phylogenomics data matrices were deposited on 5 February 2016 in the Dryad Digital Repository at doi:10.5061/dryad.6p072
Data Availability
Dryad data doi:10.5061/dryad.6p072.
Supplemental Information
Supplemental information for this article can be found online athttp://dx.doi.org/10.7717/ peerj.1719#supplemental-information.
REFERENCES
Agnarsson I, Coddington JA, Kuntner M. 2013. Systematics—progress in the study of spider diversity and evolution. In: Penney D, ed.Spider research in the 21st century: trends and perspectives. Manchester: Siri Scientific Press, 58–111.
Altenhoff AM, Gil M, Gonnet GH, Dessimoz C. 2013.Inferring hierarchical orthologous groups from orthologous gene pairs.PLoS ONE8(1):e53786
DOI 10.1371/journal.pone.0053786.
Altschul SF, Gish W, Miller W, Myers EW, Lipman DJ. 1990.Basic local alignment search tool.Journal of Molecular Biology215:403–410
DOI 10.1016/S0022-2836(05)80360-2.
Bayer S, Schönhofer AL. 2013.Phylogenetic relationships of the spider family psechridae inferred from molecular data, with comments on the lycosoidea (arachnida:
Araneae).Invertebrate Systematics27(1):53–80DOI 10.1071/IS12017.
Beaulieu JM, O’Meara BC, Donoghue MJ. 2013.Identifying hidden rate changes in the evolution of a binary morphological character: the evolution of plant habit in cam-panulid angiosperms.Systematic Biology 62(5):725–737DOI 10.1093/sysbio/syt034.
Blackledge TA, Kuntner M, Agnarsson I. 2011. The form and function of spider orb webs: evolution from silk to ecosystems. In: Casas J, ed.Advances in insect physiology. Vol. 41. Burlington: Academic Press, 175–262.
Blackledge TA, Scharff N, Coddington JA, Szüts T, Wenzel JW, Hayashi CY, Agnarsson I. 2009.Reconstructing web evolution and spider diversification in the molecular era.Proceedings of the National Academy of Sciences of the United States of America
106(13):5229–5234DOI 10.1073/pnas.0901377106.
Bond JE, Garrison NL, Hamilton CA, Godwin RL, Hedin M, Agnarsson I. 2014.
Phylogenomics resolves a spider backbone phylogeny and rejects a prevailing paradigm for orb web evolution.Current Biology24(15):1765–1771
DOI 10.1016/j.cub.2014.06.034.
on three nuclear genes and morphology.PLoS ONE7(6):e38753
DOI 10.1371/journal.pone.0038753.
Bond JE, Opell BD. 1998.Testing adaptive radiation and key innovation hypotheses in spiders.Evolution52(2):403–414 DOI 10.2307/2411077.
Brandley MC, Bragg JG, Singhal S, Chapple DG, Jennings CK, Lemmon AR, Lemmon EM, Thompson MB, Moritz C. 2015.Evaluating the performance of anchored hybrid enrichment at the tips of the tree of life: a phylogenetic analysis of Aus-tralian Eugongylus group scincid lizards.BMC Evolutionary Biology15(62)
DOI 10.1186/s12862-015-0318-0.
Coddington J. 1986. The monophyletic origin of the orb web. In: Shear W, ed.Spiders: webs, behavior, and evolution. Stanford, California: Stanford University Press, 319–363.
Coddington JA. 1991.Cladistics and spider classification: araneomorph phylogeny and the monophyly of orbweavers (Araneae: Araneomorphae; Orbiculariae).Acta Zoologica Fennica190:75–87.
Coddington JA. 2005. Phylogeny and classification of spiders. In: Ubick P, Paquin P, Cushing P, Roth V, eds.Spiders of North America: an identification manual. American Arachnological Society, 18–24.
Coddington JA, Levi HW. 1991.Systematics and evolution of spiders (Araneae).Annual Review of Ecology and Systematics22:565–592
DOI 10.1146/annurev.es.22.110191.003025.
Conesa A, Götz S, García-Gómez JM, Terol J, Talón M, Robles M. 2005.Blast2go: a universal tool for annotation, visualization and analysis in functional genomics research.Bioinformatics21(18):3674–3676DOI 10.1093/bioinformatics/bti610.
Crane P. 1987. The origin of angiosperms and their biological consequences. In: Friis E, Chaloner W, Crane P, eds.Vegetational consequences of the angiosperm diversification. Cambridge: Cambridge University Press, 105–144.
Dell’Ampio E, Meusemann K, Szucsich NU, Peters RS, Meyer B, Borner J, Petersen M, Aberer AJ, Stamatakis A, Walzl MG, Minh BQ, Von Haeseler A, Ebersberger I, Pass G, Misof B. 2014.Decisive data sets in phylogenomics: lessons from studies on the phylogenetic relationships of primarily wingless insects.Molecular Biology and
Evolution31(1):239–249DOI 10.1093/molbev/mst196.
Dicko C, Porter D, Bond J, Kenney JM, Vollrath F. 2008.Structural disorder in silk proteins reveals the emergence of elastomericity.Biomacromolecules9(1):216–221
DOI 10.1021/bm701069y.
Dimitrov D, Lopardo L, Giribet G, Arnedo MA, Alvarez-Padilla F, Hormiga G. 2012.
Tangled in a sparse spider web: single origin of orb weavers and their spinning work unravelled by denser taxonomic sampling.Proceedings of the Royal Society B:
Biological Sciences279(1732):1341–1350DOI 10.1098/rspb.2011.2011.
Drummond AJ, Ho S Y W, Phillips MJ, Rambaut A. 2006.Relaxed phylogenetics and dating with confidence.PLoS Biology4(5):e88DOI 10.1371/journal.pbio.0040088.
Drummond AJ, Suchard MA, Xie D, Rambaut A. 2012.Bayesian phylogenetics with BEAUti and the BEAST 1.7.Molecular Biology and Evolution29(8):1969–1973
DOI 10.1093/molbev/mss075.
Dziki A, Binford G, Coddington JA, Agnarsson I. 2015.Spintharus flavidus in the caribbean–a 30 million year biogeographical history and radiation of a ‘widespread species’.PeerJ PrePrints3:e1639DOI 10.7287/peerj.preprints.1332v1.
Ebersberger I, Strauss S, Von Haeseler A. 2009.HaMStR: profile hidden markov model based search for orthologs in ESTs.BMC Evolutionary Biology9(1):157
DOI 10.1186/1471-2148-9-157.
Eddy SR. 2011.Accelerated profile HMM searches.PLoS Computational Biology
7(10):e1002195DOI 10.1371/journal.pcbi.1002195.
Eskov KY, Zonstein S. 1990.First Mesozoic mygalomorph spiders from the Lower Cretaceous of Siberia and Mongolia, with notes on the system and evolution of the infraorder Mygalomorphae (Chelicerata: Araneae).Neues Jahrbuch für Geologie und
Paläontologie, Abhandlungen178:325–368.
Fernández R, Hormiga G, Giribet G. 2014.Phylogenomic analysis of spiders reveals nonmonophyly of orb weavers.Current Biology24(15):1772–1777
DOI 10.1016/j.cub.2014.06.035.
Garb J. 2013. Spider silk: an ancient biomaterial for the 21st century. In: Penney D, ed.Spider research in the 21st century: trends and perspectives. Manchester, UK: Siri Scientific Press, 252–281.
Gertsch WJ. 1979.American spiders. Second edition. New York: Van Nostrand Reinhold Co.
Grabherr MG, Haas BJ, Yassour M, Levin JZ, Thompson DA, Amit I, Adiconis X, Fan L, Raychowdhury R, Zeng Q, Chen Z, Mauceli E, Hacohen N, Gnirke A, Rhind N, Di Palma F, Birren BW, Nusbaum C, Lindblad-Toh K, Friedman N, Regev A. 2011.
Full-length transcriptome assembly from RNA-Seq data without a reference genome.
Nature Biotechnology29(7):644–652DOI 10.1038/nbt.1883.
Griswold CE, Coddington JA, Hormiga G, Scharff N. 1998.Phylogeny of the orb-web building spiders (Araneae, Orbiculariae: Deinopoidea, Araneoidea).Zoological
Journal of the Linnean Society123(1):1–99DOI 10.1111/j.1096-3642.1998.tb01290.x.
Griswold CE, Ramírez M, Coddington J, Platnick N. 2005.Atlas of phylogenetic data for entelegyne spiders (Araneae: araneomorphae: Entelegynae), with comments on their phylogeny.Procceedings of the California Academy of Sciences56:1–324.
Haas BJ, Papanicolaou A, Yassour M, Grabherr M, Blood PD, Bowden J, Couger MB, Eccles D, Li B, Lieber M, MacManes MD, Ott M, Orvis J, Pochet N, Strozzi F, Weeks N, Westerman R, William T, Dewey CN, Henschel R, LeDuc RD, Friedman N, Regev A. 2013.De novo transcript sequence reconstruction from RNA-seq using the Trinity platform for reference generation and analysis.Nature Protocols
8(8):1494–1512DOI 10.1038/nprot.2013.084.
current system of classification.Molecular Phylogenetics and Evolution41(2):454–471
DOI 10.1016/j.ympev.2006.05.017.
Homann H. 1971.Die Augen der Araneae.Zeitschrift für Morphologie der Tiere
69(3):201–272DOI 10.1007/BF00277623.
Hormiga G, Griswold CE. 2014.Systematics, phylogeny, and evolution of orb-weaving spiders.Annual Review of Entomology59(1):487–512
DOI 10.1146/annurev-ento-011613-162046.
Hölldobler B, Wilson EO. 1990.The ants. Cambridge: Belknap Press.
Ihaka R, Gentleman R. 1996.R: a language for data analysis and graphics.Journal of Computational and Graphical Statistics5(3):299–314.
Jarvis ED, Mirarab S, Aberer AJ, Li B, Houde P, Li C, Ho SY, Faircloth BC, Nabholz B, Howard JT, Suh A, Weber CC, Da Fonseca RR, Li J, Zhang F, Li H, Zhou L, Narula N, Liu L, Ganapathy G, Boussau B, Bayzid MS, Zavidovych V, Subramanian S, Gabaldon T, Capella-Gutierrez S, Huerta-Cepas J, Rekepalli B, Munch K, Schierup M, Lindow B, Warren WC, Ray D, Green RE, Bruford MW, Zhan X, Dixon A, Li S, Li N, Huang Y, Derryberry EP, Bertelsen MF, Sheldon FH, Brumfield RT, Mello CV, Lovell PV, Wirthlin M, Schneider MPC, Prosdocimi F, Samaniego JA, Velazquez AMV, Alfaro-Nunez A, Campos PF, Petersen B, Sicheritz-Ponten T, Pas A, Bailey T, Scofield P, Bunce M, Lambert DM, Zhou Q, Perelman P, Driskell AC, Shapiro B, Xiong Z, Zeng Y, Liu S, Li Z, Liu B, Wu K, Xiao J, Yinqi X, Zheng Q, Zhang Y, Yang H, Wang J, Smeds L, Rheindt FE, Braun M, Fjeldsa J, Orlando L, Barker FK, Jonsson KA, Johnson W, Koepfli K-P, O’Brien S, Haussler D, Ryder OA, Rahbek C, Willerslev E, Graves GR, Glenn TC, McCormack J, Burt D, Ellegren H, Alstrom P, Edwards SV, Stamatakis A, Mindell DP, Cracraft J, Braun EL, Warnow T, Jun W, Gilbert MTP, Zhang G. 2014.Whole-genome analyses resolve early branches in the tree of life of modern birds.Science346(6215):1320–1331
DOI 10.1126/science.1253451.
Katoh K. 2005.MAFFT version 5: improvement in accuracy of multiple sequence alignment.Nucleic Acids Research33(2):511–518DOI 10.1093/nar/gki198.
Kergoat GJ, Soldati L, Anne-Laure C, Jourdan H, Jabbour-Zahab R, Genson G, Bouchard P, Condamine FL. 2014.Higher level molecular phylogeny of darkling beetles (Coleoptera: Tenebrionidae): Darkling beetle phylogeny.Systematic Entomol-ogy39(3):486–499DOI 10.1111/syen.12065.
King GF, Hardy MC. 2013.Spider-venom peptides: structure, pharmacology, and potential for control of insect pests.Annual Review of Entomology58(1):475–496
DOI 10.1146/annurev-ento-120811-153650.
Knowles LL, Kubatko LS. 2011.Estimating species trees: practical and theoretical aspects. John Wiley and Sons.
Kocot ML, Citarella M, Halanych K. 2013.PhyloTreePruner: a phylogenetic tree-based approach for selection of orthologous sequences for phylogenomics.Evolutionary
Bioinformatics9:429–435DOI 10.4137/EBO.S12813.
Kozlov AM, Aberer AJ, Stamatakis A. 2015.ExaML version 3: a tool for phy-logenomic analyses on supercomputers.Bioinformatics31(15):2577–2579
DOI 10.1093/bioinformatics/btv184.
Kück P. 2009.ALICUT: a Perlscript which cuts ALISCORE identified RSS. version, 2. Bonn, Germany: Department of Bioinformatics, Zoologisches Forschungsmuseum A. Koenig (ZFMK).
Kück P, Meusemann K. 2010.FASconCAT: convenient handling of data matrices.
Molec-ular Phylogenetics and Evolution56(3):1115–1118DOI 10.1016/j.ympev.2010.04.024.
Kück P, Struck TH. 2014.BaCoCa—a heuristic software tool for the parallel assessment of sequence biases in hundreds of gene and taxon partitions.Molecular Phylogenetics
and Evolution70:94–98DOI 10.1016/j.ympev.2013.09.011.
LaPolla JS, Dlussky GM, Perrichot V. 2013.Ants and the fossil record.Annual Review of
Entomology58(1):609–630DOI 10.1146/annurev-ento-120710-100600.
Leache AD, Rannala B. 2011.The accuracy of species tree estimation under simulation: a comparison of methods.Systematic Biology60(2):126–137
DOI 10.1093/sysbio/syq073.
Ledford JM, Griswold CE. 2010.A study of the subfamily Archoleptonetinae (Araneae, Leptonetidae) with a review of the morphology and relationships for the
Leptoneti-dae.Zootaxa2391:1–32.
Legendre F, Nel A, Svenson GJ, Robillard T, Pellens R, Grandcolas P. 2015.Phylogeny of dictyoptera: dating the origin of cockroaches, praying mantises and termites with molecular data and controlled fossil evidence.PLoS ONE10(7):e0130127
DOI 10.1371/journal.pone.0130127.
Lehtinen PT. 1967. Classification of the cribellate spiders and some allied families, with notes on the evolution of the suborder Araneomorpha. In:Annales zoologici fennici. Societas Zoologica Botanica Fennica Vanamo, 199–468.
Lemmon AR, Brown JM, Stanger-Hall K, Lemmon EM. 2009.The effect of ambiguous data on phylogenetic estimates obtained by maximum likelihood and Bayesian inference.Systematic Biology 58(1):130–145DOI 10.1093/sysbio/syp017.
Lemmon EM, Lemmon AR. 2013.High-throughput genomic data in systematics and phylogenetics.Annual Review of Ecology, Evolution, and Systematics44(1):99–121
DOI 10.1146/annurev-ecolsys-110512-135822.
Levi HW. 1980.Orb-webs: primitive or specialized. In: Gruber J,ed.Proceedings of the 8th international congress of arachnology, 367–370.
Li L, Stoeckert CJ, Roos DS. 2003.OrthoMCL: identification of ortholog groups for eukaryotic genomes.Genome Research13(9):2178–2189DOI 10.1101/gr.1224503.
Liu L, Yu L. 2011.Estimating species trees from unrooted gene trees.Systematic Biology
60(5):661–667DOI 10.1093/sysbio/syr027.
National Academy of Sciences of the United States of America106(17):7083–7088
DOI 10.1073/pnas.0810618106.
Mckenna DD, Wild AL, Kanda K, Bellamy CL, Beutel RG, Caterino MS, Farnum CW, Hawks DC, Ivie MA, Jameson ML, Leschen RAB, Marvaldi AE, Mchugh JV, Newton AF, Robertson JA, Thayer MK, Whiting MF, Lawrence JF, lipiski A, Maddison DR, Farrell BD. 2015.The beetle tree of life reveals that coleoptera survived end-permian mass extinction to diversify during the cretaceous terrestrial revolution.Systematic Entomology40(4):835–880DOI 10.1111/syen.12132.
Meyer B, Meusemann K, Misof B. 2011.MARE: MAtrix REduction—a tool to select optimized data subsets from supermatrices for phylogenetic inference.Bonn
(Germany): Zentrum fuur molekulare Biodiversitätsforschung (zmb) am ZFMK.
Version 01.2-rc.Available athttp:// mare.zfmk.de.
Michalik P, Ramírez MJ. 2014.Evolutionary morphology of the male reproductive system, spermatozoa and seminal fluid of spiders (Araneae, Arachnida) – Current knowledge and future directions.Arthropod Structure & Development 43(4):291–322
DOI 10.1016/j.asd.2014.05.005.
Miller JA, Carmichael A, Ramírez MJ, Spagna JC, Haddad CR, Řezáč M, Johan-nesen J, Král J, Wang X-P, Griswold CE. 2010.Phylogeny of entelegyne spi-ders: Affinities of the family Penestomidae (NEW RANK), generic phylogeny of Eresidae, and asymmetric rates of change in spinning organ evolution (Araneae, Araneoidea, Entelegynae).Molecular Phylogenetics and Evolution55(3):786–804
DOI 10.1016/j.ympev.2010.02.021.
Mirarab S, Reaz R, Bayzid MS, Zimmermann T, Swenson MS, Warnow T. 2014.
ASTRAL: genome-scale coalescent-based species tree estimation.Bioinformatics
30(17):i541–i548DOI 10.1093/bioinformatics/btu462.
Misof B, Liu S, Meusemann K, Peters RS, Donath A, Mayer C, Frandsen PB, Ware J, Flouri T, Beutel RG, Niehuis O, Petersen M, Izquierdo-Carrasco F, Wappler T, Rust J, Aberer AJ, Aspock U, Aspock H, Bartel D, Blanke A, Berger S, Bohm A, Buckley TR, Calcott B, Chen J, Friedrich F, Fukui M, Fujita M, Greve C, Grobe P, Gu S, Huang Y, Jermiin LS, Kawahara AY, Krogmann L, Kubiak M, Lanfear R, Letsch H, Li Y, Li Z, Li J, Lu H, Machida R, Mashimo Y, Kapli P, McKenna DD, Meng G, Nakagaki Y, Navarrete-Heredia JL, Ott M, Ou Y, Pass G, Podsiadlowski L, Pohl H, Von Reumont BM, Schutte K, Sekiya K, Shimizu S, Slipinski A, Stamatakis A, Song W, Su X, Szucsich NU, Tan M, Tan X, Tang M, Tang J, Timelthaler G, Tomizuka S, Trautwein M, Tong X, Uchifune T, Walzl MG, Wiegmann BM, Wilbrandt J, Wipfler B, Wong TKF, Wu Q, Wu G, Xie Y, Yang S, Yang Q, Yeates DK, Yoshizawa K, Zhang Q, Zhang R, Zhang W, Zhang Y, Zhao J, Zhou C, Zhou L, Ziesmann T, Zou S, Li Y, Xu X, Zhang Y, Yang H, Wang J, Wang J, Kjer KM, Zhou X. 2014.Phylogenomics resolves the timing and pattern of insect evolution.Science
346(6210):763–767DOI 10.1126/science.1257570.
Misof B, Misof K. 2009.A monte carlo approach successfully identifies randomness in multiple sequence alignments: a more objective means of data exclusion.Systematic