Article
Associations between Dietary Acid-Base Load and
Cardiometabolic Risk Factors in Adults: The Tehran Lipid
and Glucose Study
Zahra Bahadoran1, Parvin Mirmiran2, Hadise Khosravi1, Fereidoun Azizi3
1Nutrition and Endocrine Research Center and Obesity Research Center, Research Institute for Endocrine Sciences, 2Department
of Nutrition and Clinical Dietetics, Faculty of Nutrition Sciences and Food Technology, National Nutrition and Food Technology Research Institute, 3
Endocrine Research Center, Research Institute for Endocrine Sciences, Shahid Beheshti University of Medical Sciences, Tehran, Iran
Background: In this study we investigated the associations of dietary acid-base load, identified by potential renal acid load (PRAL) and protein to potassium (Pro:K) ratio, with cardiometabolic risk factors in Tehranian adults.
Methods: A cross-sectional study was conducted within the framework of the fourth phase of the Tehran Lipid and Glucose Study (2009 to 2011) on 5,620 men and women aged 19 to 70 years. Dietary data were collected by a trained dietitian using a validated, 147-food item, semi-quantitative food frequency questionnaire, and dietary PRAL and Pro:K ratio were calculated. Multiple linear regression models with adjustment for potential confounding variables were used to evaluate the associations of dietary acid-base load with anthropometric measures, blood pressure, serum triglycerides, high density lipoprotein cholesterol (HDL-C), serum creatinine, and fasting blood glucose.
Results: The mean±SD age of the participants was 39.8±12.8 years and 54% of participants were women. Mean ±SD PRAL was –22.0±29.1; mean PRAL was –15.6 in men and –26.8 in women. Dietary PRAL was associated with weight (β=0.098, P<0.001), waist circumference (β=0.062, P<0.01), serum triglycerides (β=0.143, P<0.01), HDL-C (β=–0.11, P<0.01), diastolic blood pres-sure (β=0.062, P<0.01), and serum creatinine (β=0.142, P<0.001). Pro:K ratio was associated with weight (β=0.055, P<0.001), waist circumference (β=0.04, P<0.01), serum HDL-C (β=–0.06, P<0.01), serum triglycerides (β=0.03, P<0.05), diastolic blood pressure (β=0.026, P<0.05), and serum creatinine (β=0.07, P<0.01).
Conclusion: A more acidic dietary acid-base load may be a risk factor for the development of metabolic disorders.
Keywords: Dietary acid-base load; Potential renal acid load; Protein to potassium ratio; Cardiometabolic risk factors
Received: 21 May 2014, Revised: 9 July 2014,
Accepted: 19 August 2014
Corresponding author: Parvin Mirmiran
Department of Nutrition and Clinical Dietetics, Faculty of Nutrition Sciences and Food Technology, National Nutrition and Food Technology Research Institute, Shahid Beheshti University of Medical Sciences, No 46 Arghavan-e-gharbi St, Farahzadi Blvd, Shahrak-e-Ghods. Tehran 19395-4741, Iran
Tel: +98-21-223-57-484, Fax: +98-21-224-16-264,
E-mail: mirmiran@endocrine.ac.ir
Copyright © 2015 Korean Endocrine Society
INTRODUCTION
Metabolic syndrome (MetS) is a complex metabolic disorder in-volving abdominal fat accumulation, impaired glucose homeo-stasis, dyslipidemia, and hypertension that can lead to diabetes and cardiovascular disease. The global prevalence of MetS in adults is estimated to be about 20% to 25% and it is usually caused by obesity and decreased physical activity [1]. The Prev-alence of MetS in United States adults according to the The Na-tional Health and Nutrition Examination Survey decreased from 25.5% to 22.9% between 1999/2000 and 2009/2010 [2]. The prevalence of MetS in Iranian men and women has been report-ed to be 30.1% and 55%, respectively [3]. Lifestyle factors, es-pecially physical activity and dietary intakes, are considered major factors contributing to the incidence of MetS [4,5]. Dietary acid-base load is a dietary factor that was recently considered as a possible risk factor for metabolic disorders and cardiovascular disease [6]. Mild metabolic acidosis, caused by poor dietary intakes and impaired balance of calcium and ci-trate, and cortisol-induced acidosis have been identified as risk factors for the development of obesity, lipid disorders, and subsequent cardiovascular disease [7]. Associations of imbal-anced dietary acid-base load with hypertension, chronic kidney dysfunction, and defects in bone metabolism have also been documented [8]. For the first time, Remer and Manz [9] devel-oped an equation for estimating potential renal acid load (PRAL) using dietary intake. PRAL and protein to potassium (Pro:K) ratios have been introduced as indicators of dietary ac-id-base load. PRAL reflects the intestinal absorption rates con-tributing to nutrient ionic balance for protein, potassium, calci-um, and magnesicalci-um, and dissociation of phosphate at pH 7.4 [10-14]. Both indexes have been previously validated through comparison with 24-hours urinary acid-base load [10]. Both acidogenic foods (protein-containing foods including meat, fish, eggs, cereals, and dairy products) and alkalinogenic foods (fruits and vegetables) contribute to dietary acid-base load [9]. To our knowledge, few studies have examined the relation-ship between dietary acid-base load and cardiovascular risk factors, and there are some controversies. In this study we in-vestigated the associations of PRAL and Pro:K ratio with car-diometabolic risk factors in Tehranian adults.
METHODS
Participants
This study was conducted within the framework of the Tehran
Lipid and Glucose Study (TLGS). Briefly, the TLGS is an on-going community-based prospective study being conducted to investigate and prevent noncommunicable diseases, in a repre-sentative sample of residents, aged ≥3 years, from district 13 of Tehran, the capital city of Iran. The first phase of the TLGS began in March 1999 and data collection, at 3-year intervals, is ongoing [11]. During the fourth phase of the TLGS (2009 to 2011) 7,956 of a total of 12,823 subjects completed dietary questionnaires. For the current analysis, participants aged 20 to 70 years were recruited. Participants were excluded from the analysis if they were on specific diets or were diagnosed as under-reporters (≤800 kcal/day) or over-reporters (≥4,200 kcal/day) of energy intake (n=420). Data on 5,620 individuals
were considered for analysis. The study protocol was ap-proved by the Ethics Committee of the Research Institute for Endocrine Sciences, Shahid Beheshti University of Medical Sciences, and informed written consent was obtained from all participants.
Dietary assessment and calculation of dietary acid-base load
Dietary data were collected by a trained dietitian using a vali-dated semiquantitative food frequency questionnaire (FFQ) with 147 food items. The reliability and relative validity of the FFQ, developed for the TLGS for nutrient intakes in Tehranian adults, have been documented. The validity and reliability of the FFQ were assessed in a random sample (based on sex and age groups) by comparing the data from two FFQs completed 1 year apart and by comparing the data from the FFQs and re-peated 24-hour dietary recall, respectively. The validity and reliability of the FFQ for dietary intakes were acceptable: for male and female participants, respectively; the correlation co-efficients for FFQ and repeated 24-hour recall were 0.59 and 0.38 and those for the two FFQs were 0.43 and 0.42 [15]. The interviewer asked participants to give their consump-tion frequency for each food item during the past year on a daily, weekly, or monthly basis. Portion sizes of consumed foods reported in household measures were then converted to grams. The USDA food composition table (FCT) was used to calculated energy and nutrient intakes. The Iranian FCT was also used for some traditional foods that are not listed in the USDA FCT [16].
Dietary acid-base load was evaluated by two indexes: PRAL and Pro:K ratio. PRAL was calculated using the fol-lowing formula: PRAL (mEq/day)=0.4888×dietary protein
di-etary potassium (mg/day)–0.0125×calcium (mg/day)
–0.0263×magnesium (mg/day). Pro:K ratio was calculated as
dietary protein (g/day) divided by dietary potassium (mg/day) [7,8]. PRAL and Pro:K ratio were both calculated using resid-ual energy-adjusted nutrient intake data estimated from the FFQ. Higher values of PRAL and Pro:K ratio were considered to indicate a more acidic dietary acid-base load [9].
Anthropometrics, blood pressure, and biochemical assessment
Anthropometric measurements were taken by a trained inter-viewer. Weight was measured to the nearest 100 g using digi-tal scale, with minimal clothing and without shoes. Height was measured to the nearest 0.1 cm, in a standing position without shoes, using a tape measure. Waist circumference (WC) was measured at the level of the umbilicus to the nearest 0.1 cm using an unstretched tape meter without pressure. Body mass index (BMI) was calculated as body weight (kg) divided by the square of body height (m).
Two measurements of blood pressure were taken on the right arm in a sitting position using a standardized mercury sphygmomanometer. The mean of the two measurements was considered as the participant’s blood pressure.
Fasting blood samples were collected from all participants after 12 to 14 hours. Fasting plasma glucose was measured by an enzymatic colorimetric method using glucose oxidase. Tri-glyceride level was measured by enzymatic colorimetric anal-ysis with glycerol phosphate oxidase. High density lipoprotein cholesterol (HDL-C) was measured after precipitation of apo-lipoprotein B-containing apo-lipoprotein with phosphotungstic acid. The analysis was done using kits from Pars Azmoon Inc. (Tehran, Iran) and a Selectra 2 auto-analyzer (Vital Scientific, Spankeren, the Netherlands). Serum creatinine (mg/dL) was measured according to the standard colorimetric Jaffe kinetic reaction method (Pars Azmoon Inc.). Interassay and and intra-assay coefficients of variation of all intra-assays were <5%.
Definition of cardiometabolic risk factors and MetS
Cardiometabolic risk factors were defined according to the di-agnostic criteria proposed by NCEP ATP III [17]: (1) hyper-glycemia was defined as fasting plasma glucose ≥100 mg/dL (5.6 mM) or drug treatment of impaired fasting glucose; (2) hyperglyceridemia was defined as serum triglycerides ≥150 mg/dLII
(1.69 mmol/L) or drug treatment; (3) low HDL-C was defined as <40 mg/dL (1.04 mmol/L) for men and <50 mg/dL
(1.29 mmol/L) for women or drug treatment; and (4)
hyper-tension was defined as blood pressure ≥135/85 mm Hg or drug treatment for hypertension.
Since central obesity is commonly assessed by gender- and ethnicity-specific WC cutoff values, abdominal obesity was defined based on the Iranian adult cutoff for WC ≥95 cm for both sexes [18].
Statistical methods
Participants’ general characteristics and the prevalence of MetS and its components were compared across quartiles of dietary PRAL index using analysis of variance for continuous variables and chi-square test for numerical variables. Mean di-etary intakes were compared across quartiles of PRAL index using a general linear model adjusted for sex, age (years, con-tinuous), and energy intake (kcal/day). To identify associations of PRAL index and Pro:K ratio with MetS components, multi-variate regression models were created with adjustment for age, sex, BMI, smoking status, menopause status (in women), daily energy intake, dietary fat and saturated fat, carbohy-drates, and dietary fiber. All statistical analyses were conduct-ed using SPSS version 16.0 (SPSS Inc., Chicago, IL, USA). P
values <0.05 were considered significant.
RESULTS
The mean±SD age of the participants was 39.8±12.8 years
and 54% of participants were women. Mean±SD PRAL was
–22.0±29.1; mean PRAL was –15.6 in men and –26.8 in
women). PRAL index in the first, second, third, and fourth quartiles was <–35.8, –35.8 to –18, –18 to –4, and >–4,
re-spectively. General characteristics of the participants are shown in Table 1. Participants in the highest quartile of PRAL index were significantly younger (37.1 years vs. 41.9 years,
P<0.01). The percent of women was significantly lower in the
highest, as compared to the lowest quartile of PRAL index (41.7% vs. 68.8%). Participants in the highest PRAL quartile had higher BMI (27.3 kg/m2
vs. 27.0 kg/m2
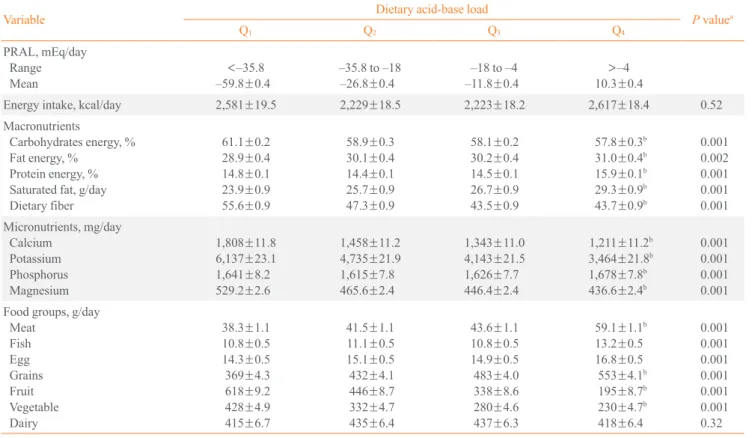
) and WC (92.8 cm vs. 91.0 cm) and a higher rate of abdominal obesity (42.8% vs. 40.5%) compared to the lowest quartile. Mean dietary intakes of participants across quartiles of PRAL are shown in Table 2. There was no significant difference in energy intake across PRAL quartiles. Dietary intakes of fat, protein, phosphorus, animal protein sources, and grains were significantly higher in participants with highest values for PRAL index (P<0.01).
vegetables with increasing PRAL index (P<0.01).
Associa-tions of dietary PRAL with MetS components are shown in
Table 3. PRAL was associated with weight (β=0.1, P<0.01), WC (β=0.7, P<0.01), serum triglyceride concentration (β=0.03, P<0.05), serum HDL-C (β=–0.08, P<0.01), systol-ic (β=0.05, p<0.01), and diastolic blood pressure (β=0.05,
P<0.01), and serum creatinine (β=0.13, P<0.01).
Associa-tions of Pro:K ratio with MetS components are shown in Table
4. Pro:K ratio was associated with WC (β=0.03, P<0.01), se-rum HDL-C (β=–0.06, P<0.01), serum triglycerides (β=0.03,
P<0.05), and systolic blood pressure (β=0.03, P<0.01).
DISCUSSION
The results of this study provide further evidence regarding the possible associations of dietary acid-base load with cardio-metabolic risk factors. In agreement with previous studies, higher intakes of meat, grains, egg, fish, and dairy products were associated with higher PRAL, while higher intakes of
vegetables and fruit were related to lower PRAL [19-22]. Moreover, dietary PRAL was highly correlated with Pro:K ra-tio (r=0.47, P<0.01). Mean PRAL and Pro:K ratio values in
this population (–22.0 mEq/day and 0.02 g/mEq, respectively) showed lower acidity, as compared to other populations, in-cluding British middle-aged women (27.6 mEq/day and 1.0 g/ mEq, respectively) and young Japanese women (10.4 mEq/ day and 1.2 g/mEq, respectively). Consistent with a previous study [6], PRAL was strongly associated with K (r=–0.88,
P<0.001), Ca (r=–0.58, P<0.001), and Mg (r=–0.44,
P<0.001), while it had a weak association with dietary protein
(r=0.13, P<0.01); there was no significant correlation
be-tween PRAL and phosphorus (r=0.01, P=0.30).
The observed associations between dietary PRAL and car-diometabolic risk factors in this study were independent of po-tential confounding variables including demographic, anthro-pometric, and dietary factors. An investigation by Murakami et al. [6] found an independent positive association between BMI/ WC and Pro:K ratio, but not PRAL. In that study, after
adjust-Table 1. Characteristics of Participants across Quartiles of Potential Renal Acid Load: The Tehran Lipid and Glucose Study (n=1,405)
Variable Dietary acid-base load P value
Q1 Q2 Q3 Q4
PRAL, mEq/day Range Mean
<–35.8 –59.85±0.37
–35.8 to –18 –26.67±0.37
–18 to –4 –11.80±0.37
>–4 10.28±0.37
Age, yr 41.9±13 40.9±12.7 39.36±12.8 37.12±12.5 0.01
Female sex, % 57.2 61.2 56.7 41.7 0.01
Menopause in women, % 19.9 18.3 14.7 12.9 0.01
Weight, kg 73.4±0.4 74.0±0.4 72.5±0.4 74.0±0.4 0.30
BMI, kg/m2
27.0±0.13 27.18±0.13 26.72±0.12 27.3±0.12 0.01
WC, cm 91.0±0.3 92.0±0.3 91.3±0.3 92.8±0.3 0.04
SBP, mm Hg 112.3±0.4 113±0.4 112±0.4 113±0.4 0.27
DBP, mm Hg 75.5±0.3 75.9±0.3 75.4±0.3 75.6±0.3 0.53
TG, mg/dL 139±2.6 136.4±2.5 133±2.45 138±2.5 0.44
FBS, mg/dL 105.9±3.05 109.7±2.87 110.5±3.33 112.9±3.41 0.48
Abdominal obesity, % 40.5 42 37 42.8 0.01
Low HDL-C, % 43.9 44.1 43.2 41.4 0.47
High TGs, % 31.4 33.1 30 33.5 0.16
High FBS, % 22.9 22.9 19.55 19.2 0.20
Hypertension, % 26.05 26.16 21.24 22.63 0.11
Metabolic syndrome, % 27.93 29.09 23.36 26.4 0.14
Values are expressed as mean±SD unless indicated otherwise. Chi-square test or analysis of variance was used.
Table 2. Dietary Intakes of Participants across Quartiles of Potential Renal Acid Load: The Tehran Lipid and Glucose Study (n=1,405)
Variable Dietary acid-base load P valuea
Q1 Q2 Q3 Q4
PRAL, mEq/day Range Mean
<–35.8 –59.8±0.4
–35.8 to –18
–26.8±0.4
–18 to –4 –11.8±0.4
>–4 10.3±0.4
Energy intake, kcal/day 2,581±19.5 2,229±18.5 2,223±18.2 2,617±18.4 0.52
Macronutrients
Carbohydrates energy, % Fat energy, %
Protein energy, % Saturated fat, g/day Dietary fiber
61.1±0.2 28.9±0.4 14.8±0.1 23.9±0.9 55.6±0.9
58.9±0.3 30.1±0.4 14.4±0.1 25.7±0.9 47.3±0.9
58.1±0.2 30.2±0.4 14.5±0.1 26.7±0.9 43.5±0.9
57.8±0.3b
31.0±0.4b
15.9±0.1b
29.3±0.9b
43.7±0.9b
0.001 0.002 0.001 0.001 0.001 Micronutrients, mg/day Calcium Potassium Phosphorus Magnesium 1,808±11.8 6,137±23.1 1,641±8.2 529.2±2.6
1,458±11.2 4,735±21.9 1,615±7.8 465.6±2.4
1,343±11.0 4,143±21.5 1,626±7.7 446.4±2.4
1,211±11.2b
3,464±21.8b
1,678±7.8b
436.6±2.4b
0.001 0.001 0.001 0.001
Food groups, g/day Meat Fish Egg Grains Fruit Vegetable Dairy 38.3±1.1 10.8±0.5 14.3±0.5 369±4.3 618±9.2 428±4.9 415±6.7
41.5±1.1 11.1±0.5 15.1±0.5 432±4.1 446±8.7 332±4.7 435±6.4
43.6±1.1 10.8±0.5 14.9±0.5 483±4.0 338±8.6 280±4.6 437±6.3
59.1±1.1b
13.2±0.5 16.8±0.5 553±4.1b
195±8.7b
230±4.7b
418±6.4
0.001 0.001 0.001 0.001 0.001 0.001 0.32
Values are expressed as mean±SE.
PRAL, potential renal acid load.
aAnalysis of covariance was used with adjustment for age, sex, and energy intake; bSignificant difference among the four quartiles (P<0.05;
Bonfer-roni pairwise comparisons were done).
Table 3. Multivariate Associations between Potential Renal Acid Load and Cardiometabolic Risk Factors: The Tehran Lipid and Glucose Study
Factor Standardized β coefficient P valuea
Weight 0.098 0.001
Waist circumference 0.062 0.001
Systolic blood pressure 0.043 0.054
Diastolic blood pressure 0.061 0.006
Triglyceride 0.143 0.002
HDL-C –0.110 0.001
Fasting blood pressure 0.02 0.260
Creatinine 0.142 0.001
HDL-C, high density lipoprotein cholesterol.
aA linear regression model was created with adjustment for age, sex,
body mass index, smoking, menopause status (in women), energy in-take, dietary fat, carbohydrates, protein, saturated fat, and dietary fi-ber.
Table 4. Multivariate Associations between PRO:K Ratio and Cardiometabolic Risk Factors: The Tehran Lipid and Glucose Study
Factor Standardized β coefficient P valuea
Weight 0.055 0.001
Waist circumference 0.04 0.002
Systolic blood pressure 0.009 0.56
Diastolic blood pressure 0.026 0.046
Triglyceride 0.031 0.021
HDL-C –0.060 0.001
Fasting blood pressure 0.01 0.43
Creatinine 0.07 0.001
HDL-C, high density lipoprotein cholesterol.
aA linear regression model was created with adjustment for age, sex,
ment for potential confounding factors, PRAL also had an inde-pendent positive association with total cholesterol and LDL-C [6]. The associations of dietary PRAL with anthropometric mea-sures may be attributed to the effect of dietary acid-base load on muscle metabolism: previous studies showed that mild metabol-ic acidosis induced by an acidogenmetabol-ic diet led to loss of muscle tissue via decreased synthesis and increased proteolysis and amino acid oxidation [23]. In a cross-sectional study, Welch et al. [24] investigated the association of dietary acid-base load with free fat mass (FFM), percentage FFM (FFM%), and FFM index (FFMI, weight/height2), measured by dual-energy X-ray absorptiometry in women aged 18 to 79 years. Mean dietary PRAL was –9.24 mEq/day and ranged from –24.44 mEq/day in the first quartile (most alkaline) to 4.83 mEq/day in the fourth quartile. Participants with the most alkaline diets had higher FFM values, and FFMI was significantly lower in participants with more acidic diets. In that study, the optimal ratio of alka-linogenic to acidogenic foods (fruits and vegetables versus meat, fish, eggs, dairy products, and cereals) in relation to anthropo-metric measures was 1.4 [24].
Our findings suggest that higher PRAL may cause high sys-tolic and diassys-tolic blood pressure, one of the most important cardiometabolic risk factors. Some previous experimental stud-ies found that mild metabolic acidosis induced by diet signifi-cantly increased blood pressure. However, findings in relation to dietary PRAL index and blood pressure are inconsistent: in a cross-sectional study, Murakami et al. [6] showed that higher dietary PRAL and Pro:K ratio (more acidic dietary acid-base loads) were associated with higher systolic and diastolic blood pressure. A prospective analysis of 2,241 adults in the Rotter-dam Study showed that there was no significant association between dietary acid load and risk of hypertension; median di-etary acid load ranged from –14.6 to 19.9 mEq/day across ter-tiles of PRAL and the multivariate hazard ratio (95% confi-dence interval) in the highest, as compared to the lowest tertile of dietary PRAL, was 1.02 (0.88 to 1.18). Some proposed mechanisms explain how higher dietary acid-base load may contribute to the development of hypertension. A more acidic diet could increase renal acid excretion, and ammonia synthe-sis as a compensatory mechanism, and could also increase cor-tisol production and reduce citrate excretion [14,17,18]. The major limitation of the current study is its cross-sec-tional design, which precluded the determination of a causal relationship. Therefore, the possible associations need to be tested directly in future investigations.
In conclusion, findings from this study show that higher
PRAL and Pro:K ratio (more acidic dietary acid-base loads) were associated with elevated blood pressure in a Tehranian population. We also found that PRAL and Pro:K ratio have in-dependent positive associations with weight, WC, serum tri-glycerides, and serum creatinine, and a negative association with HDL-C.
CONFLICTS OF INTEREST
No potential conflict of interest relevant to this article was re-ported.
ACKNOWLEDGMENTS
We thank the Tehran Lipid and Glucose Study (TLGS) partici-pants and the field investigators of the TLGS for their cooper-ation and assistance with physical examincooper-ations, biochemical and nutritional evaluations, and database management. This study was supported by grant no. 121 from the National search Council of the Islamic Republic of Iran and the Re-search Institute for Endocrine Sciences of Shahid Beheshti University of Medical Sciences. We would like to thank Ms. N. Shiva for language editing of the manuscript.
REFERENCES
1. de Carvalho Vidigal F, Bressan J, Babio N, Salas-Salvado J. Prevalence of metabolic syndrome in Brazilian adults: a systematic review. BMC Public Health 2013;13:1198.
2. Beltran-Sanchez H, Harhay MO, Harhay MM, McElligott S. Prevalence and trends of metabolic syndrome in the adult U.S. population, 1999-2010. J Am Coll Cardiol 2013;62:697-703.
3. Azimi-Nezhad M, Herbeth B, Siest G, Dade S, Ndiaye NC, Esmaily H, Hosseini SJ, Ghayour-Mobarhan M, Vis-vikis-Siest S. High prevalence of metabolic syndrome in Iran in comparison with France: what are the components that explain this? Metab Syndr Relat Disord 2012;10:181-8.
4. Zhu S, St-Onge MP, Heshka S, Heymsfield SB. Lifestyle behaviors associated with lower risk of having the meta-bolic syndrome. Metabolism 2004;53:1503-11.
6. Murakami K, Sasaki S, Takahashi Y, Uenishi K, Japan Di-etetic Students’ Study for N, Biomarkers G. Association between dietary acid-base load and cardiometabolic risk factors in young Japanese women. Br J Nutr 2008;100:642-51.
7. Reddy ST, Wang CY, Sakhaee K, Brinkley L, Pak CY. Ef-fect of low-carbohydrate high-protein diets on acid-base balance, stone-forming propensity, and calcium metabo-lism. Am J Kidney Dis 2002;40:265-74.
8. Frassetto LA, Todd KM, Morris RC Jr, Sebastian A. Esti-mation of net endogenous noncarbonic acid production in humans from diet potassium and protein contents. Am J Clin Nutr 1998;68:576-83.
9. Remer T, Manz F. Estimation of the renal net acid excre-tion by adults consuming diets containing variable amounts of protein. Am J Clin Nutr 1994;59:1356-61.
10. Remer T, Dimitriou T, Manz F. Dietary potential renal acid load and renal net acid excretion in healthy, free-living children and adolescents. Am J Clin Nutr 2003;77:1255-60.
11. Azizi F, Rahmani M, Emami H, Mirmiran P, Hajipour R, Madjid M, Ghanbili J, Ghanbarian A, Mehrabi Y, Saadat N, Salehi P, Mortazavi N, Heydarian P, Sarbazi N, Allahverd-ian S, Saadati N, Ainy E, Moeini S. Cardiovascular risk factors in an Iranian urban population: Tehran lipid and glucose study (phase 1). Soz Praventivmed 2002;47:408-26.
12. Remer T. Estimates of renal net acid excretion and bone health. Am J Clin Nutr 2004;80:786.
13. Macdonald HM, New SA, Fraser WD, Campbell MK, Reid DM. Low dietary potassium intakes and high dietary estimates of net endogenous acid production are associated with low bone mineral density in premenopausal women and increased markers of bone resorption in postmeno-pausal women. Am J Clin Nutr 2005;81:923-33.
14. Welch AA, Bingham SA, Reeve J, Khaw KT. More acidic dietary acid-base load is associated with reduced calcaneal broadband ultrasound attenuation in women but not in men: results from the EPIC-Norfolk cohort study. Am J Clin Nutr 2007;85:1134-41.
15. Mirmiran P, Esfahani FH, Mehrabi Y, Hedayati M, Azizi F. Reliability and relative validity of an FFQ for nutrients in
the Tehran lipid and glucose study. Public Health Nutr 2010;13:654-62.
16. Hosseini-Esfahani F, Jessri M, Mirmiran P, Bastan S, Azizi F. Adherence to dietary recommendations and risk of met-abolic syndrome: Tehran Lipid and Glucose Study. Metab-olism 2010;59:1833-42.
17. Grundy SM, Cleeman JI, Daniels SR, Donato KA, Eckel RH, Franklin BA, Gordon DJ, Krauss RM, Savage PJ, Smith SC Jr, Spertus JA, Fernando C. Diagnosis and man-agement of the metabolic syndrome: an American Heart Association/National Heart, Lung, and Blood Institute sci-entific statement: executive summary. Crit Pathw Cardiol 2005;4:198-203.
18. Azizi F, Hadaegh F, Khalili D, Esteghamati A, Hosseinpa-nah F, Delavari A, Larijani B, Mirmiran P, Zabetian A, Mehrabi Y, Kelishadi R, Aghajani H. Appropriate defini-tion of metabolic syndrome among Iranian adults: report of the Iranian National Committee of Obesity. Arch Iran Med 2010;13:426-8.
19. van den Berg E, Hospers FA, Navis G, Engberink MF, Brink EJ, Geleijnse JM, van Baak MA, Gans RO, Bakker SJ. Dietary acid load and rapid progression to end-stage renal disease of diabetic nephropathy in Westernized South Asian people. J Nephrol 2011;24:11-7.
20. Fagherazzi G, Vilier A, Bonnet F, Lajous M, Balkau B, Boutron-Rualt MC, Clavel-Chapelon F. Dietary acid load and risk of type 2 diabetes: the E3N-EPIC cohort study. Diabetologia 2014;57:313-20.
21. Engberink MF, Bakker SJ, Brink EJ, van Baak MA, van Rooij FJ, Hofman A, Witteman JC, Geleijnse JM. Dietary acid load and risk of hypertension: the Rotterdam Study. Am J Clin Nutr 2012;95:1438-44.
22. Zhang L, Curhan GC, Forman JP. Diet-dependent net acid load and risk of incident hypertension in United States women. Hypertension 2009;54:751-5.
23. Dawson-Hughes B, Harris SS, Ceglia L. Alkaline diets favor lean tissue mass in older adults. Am J Clin Nutr 2008;87:662-5.