Inverse Correlation between Heart Rate
Variability and Heart Rate Demonstrated by
Linear and Nonlinear Analysis
Syed Zaki Hassan Kazmi1,2*, Henggui Zhang1, Wajid Aziz2,4, Oliver Monfredi5, Syed Ali Abbas2, Saeed Arif Shah2, Syeda Sobia Hassan Kazmi2, Wasi Haider Butt3
1School of Physics & Astronomy, University of Manchester, Manchester, United Kingdom,2Department of CS&IT, University of Azad Jammu and Kashmir, Muzaffarabad, Pakistan,3College of Electrical and Mechanical Engineering, National University of Sciences and Technology, Rawalpindi, Pakistan, 4Department of Computer Science Faculty of Computing &IT, University of Jeddah, Jeddah, Kingdom of Saudi Arabia,5Institute of Cardiovascular Sciences, University of Manchester, Manchester, United Kingdom
Abstract
The dynamical fluctuations in the rhythms of biological systems provide valuable informa-tion about the underlying funcinforma-tioning of these systems. During the past few decades analy-sis of cardiac function based on the heart rate variability (HRV; variation in R wave to R wave intervals) has attracted great attention, resulting in more than 17000-publications (PubMed list). However, it is still controversial about the underling mechanisms of HRV. In this study, we performed both linear (time domain and frequency domain) and nonlinear analysis of HRV data acquired from humans and animals to identify the relationship between HRV and heart rate (HR). The HRV data consists of the following groups: (a) human normal sinus rhythm (n = 72); (b) human congestive heart failure (n = 44); (c) rabbit sinoatrial node cells (SANC; n = 67); (d) conscious rat (n = 11). In both human and animal data at variant pathological conditions, both linear and nonlinear analysis techniques showed an inverse correlation between HRV and HR, supporting the concept that HRV is dependent on HR, and therefore, HRV cannot be used in an ordinary manner to analyse autonomic nerve activity of a heart.
Introduction
Greek Physicians and scientists were the pioneers who measured pulse rate; however, it was not much accurate till the invention of pulse watch in 1707 [1]. The correlation between heart rate variability, blood pressure and respiratory rate was first observed by Stephen Hales in 1733 [1]. His observation was confirmed by Carl Ludwig in 1847[1], who noted increase in heart rate and blood pressure with inspiration and a decrease in these two parameters with expira-tion. The advances in digital signal processing techniques and long term ambulatory ECG recording opened a new arena for HRV analysis and its linkages to health and disease [1]. The
a11111
OPEN ACCESS
Citation:Kazmi SZH, Zhang H, Aziz W, Monfredi O, Abbas SA, Shah SA, et al. (2016) Inverse Correlation between Heart Rate Variability and Heart Rate Demonstrated by Linear and Nonlinear Analysis. PLoS ONE 11(6): e0157557. doi:10.1371/journal. pone.0157557
Editor:Maria Cristina Vinci, Centro Cardiologico Monzino, ITALY
Received:February 7, 2016
Accepted:June 1, 2016
Published:June 23, 2016
Copyright:© 2016 Kazmi et al. This is an open access article distributed under the terms of the
Creative Commons Attribution License, which permits unrestricted use, distribution, and reproduction in any medium, provided the original author and source are credited.
Data Availability Statement:Animal data are from the author Dr. Oliver Monfredi study "Biophysical Characterization of the Underappreciated and Important Relationship Between Heart Rate Variability and Heart Rate", whose authors may be contacted at
study of heart rate variability (HRV) is a research area that has attracted more and more researchers, causing significant increase in the number of publications in this field. According to PubMed present list of publications in this research area exceeds 17000 research articles [2].
The autonomic nervous system (ANS) controls heart rate, hear rate variability (HRV) and breathing. Heart Rate Variability (HRV) analysis is a non-invasive technique used to evaluate the balancing action of sympathetic and parasympathetic branches of the autonomic nervous system [3,4,5]. Over the last four decades advances in the data acquisition systems and their associated computational tools have resulted into fast and robust application methods to extract valuable information from heart rate signals. HRV reflects the cardiac autonomic con-trol of the ANS and its measurement can provide additional information about the concon-trolling mechanism of ANS compared to the measurements of heart rate alone.
Over the last 35 years, various linear and non-linear techniques have been developed to extract the valuable information from cardiac interbeat interval time series data, aiming to help clinician for prognostication of illness and assessing malfunctioning of the autonomic nervous system. However, often contradictory results have left clinicians skeptical and there exists no clear consensus about HRV analysis measures [6]. In 1996, the Task force of the ESC/NASPE published standards in the measurement, interpretation and clinical use of HRV in cardiology [7]. The time domain measures are predominantly being used for long term profile of HRV and frequency domain HRV measures are being used for analysis of short term HRV data [7]. Heart is not a periodic oscillator under normal physiologic conditions [7] and standard time and frequency domain HRV measures may not be able to transient changes in the RR-interval time series data. The use of nonlinear measures may lead to substantial improvements in understanding transient changes in heart period and their physiological and pathophysiologi-cal correlates [7,8]. The HRV analysis have been used in investigating wide spectrum of cardiac and non-cardiac disease, however, its practical use in adult medicine has been reached in two clinical scenarios only. The reduced HRV has been attributed to the risk stratification after acute myocardial infarction (MI) and as an early warning sign of diabetic neuropathy.
The main purpose of this study is to identify the relationship of HR with both linear and nonlinear metrics of HRV. The human and animal data sets were analysed under following conditions: (a) human normal sinus rhythm (n = 72); (b) human congestive heart failure (n = 44); (c) rabbit sinoatrial node cell (SANC) (n = 67); and (d) conscious rat (n = 11). Both nonlinear and linear methods showed that HRV is primarily dependent on HR. There is an inverse correlation between the HRV and HR: a larger HRV (R-R interval) was correlated with a lower HR, and the vice versa. Such a correlation was observed both in the human data at vari-ant pathological conditions and varivari-ant animal species. This study provided support to the con-cept of a previous study[2] on that HRV cannot not be simply used as a biological marker for cardiac autonomic nervous system activity, and the association between a variation in HRV and altered mortality and coronary heart disease may be significantly attributable to the varia-tion in HR [2,9,10].
Materials and Methods
HRV Analysis
HRV analysis can be done by many ways and a wide range list of techniques explored since 1960 are described in detail by the North American Society of Pacing Electrophysiology and the task force for European Society of Cardiology [7]. This study investigated both linear (fre-quency domains and time domain) and nonlinear HRV parameters.
Funding:The authors received no specific funding for this work.
Linear HRV techniques
Measures included in linear time domain parameters are derived from direct RR interval mea-surement for standard deviation of all normal to normal RR intervals (SDNN), and from differ-ences of RR interval for root mean square of successive NN interval differdiffer-ences (RMSSD) (RMSSD) [7]. Specifically, SDNN are calculated as
SDNN ¼ ffiffiffiffiffiffiffiffiffiffiffiffiffiffiffiffiffiffiffiffiffiffiffiffiffiffiffiffiffiffiffiffiffiffiffiffiffiffi 1 N 1 X N
n¼2
½IðnÞ I
s
2
In which‘I’is RR intervals,0I0is the mean of RR intervals and‘N’is the total number of RR
intervals. RMSSD are calculated as
RMSSD¼ ffiffiffiffiffiffiffiffiffiffiffiffiffiffiffiffiffiffiffiffiffiffiffiffiffiffiffiffiffiffiffiffiffiffiffiffiffiffiffiffiffiffiffiffiffiffiffiffiffiffiffiffiffiffiffi 1 N 2 X N
n¼3
½IðnÞ Iðn 1Þ2
s
Where‘I’is RR intervals and‘N’is the total number of RR intervals.
The frequency domain measures used in this study included: Very low frequency (VLF), low frequency (LF), high frequency (HF) and total power. VLF is a band of power spectrum range0.04 Hz. Normally this measure shows overall activity of numerous slow mechanisms of sympathetic activity. LF is a band of power spectrum ranging between 0.04 and 0.15 Hz. This parameter reflects both sympathetic and parasympathetic function. HF is a band of power spectrum range between 0.15 and 0.4 Hz. Generally this measure reflects parasympathetic function. Total power is a short term estimate of the total power of power spectral density in the range of frequencies between 0 and 0.4 Hz. In this parameter sympathetic activity is a main contributor when its shows overall autonomic activity [11].
Data Sets
The data sets used in the study comprised of both human and animal data and inTable 1
details of the data used are illustrated.
Results
Time Domain Analysis
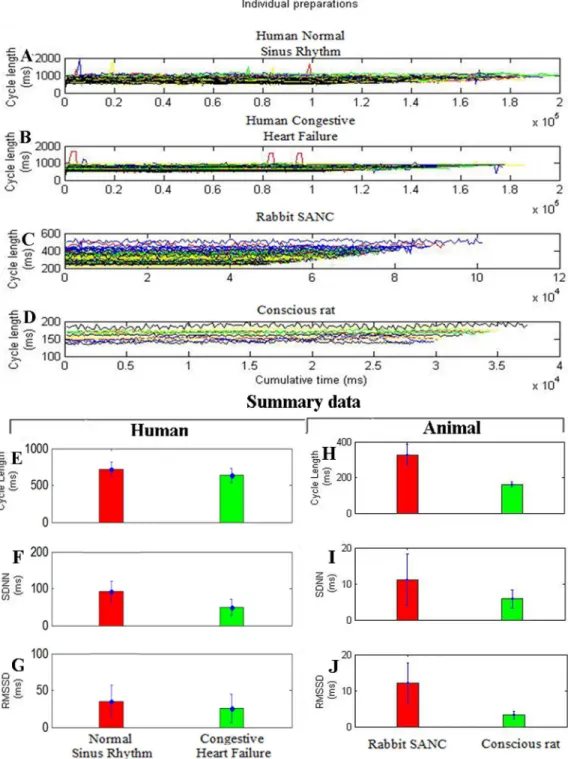
We used RR-interval time series data of human normal sinus rhythm (n = 72), human conges-tive heart failure(n = 44), rabbit SANC(sinoatrial node cell; n = 67) and conscious rat(n = 11) subjects.Fig 1A–1Dshows tachograms for the different preparations, demonstrating marked differences in HRV under baseline conditions; the data are summarized inFig 1E–1J.
In human groups, HRV in terms of SDNN and RMSSD is high in normal sinus rhythm (Fig 1A, 1F and 1G) then in congestive heart failure (Fig 1B, 1F and 1G) respectively. Similarly in animal groups, HRV in terms of SDNN and RMSSD is high in rabbit SANC (Fig 1C, 1I and 1J) then conscious rat (Fig 1D, 1I and 1J). The baseline cycle length (CL; same as R-R or NN inter-val) also varied widely between preparations (Fig 1E and 1H). In human groups preparation with the longest CL is normal sinus rhythm (713±95 ms) then congestive heart failure (657±97 ms) (Fig 1E). Similarly in animal groups preparation with the longest CL is rabbit SANC(326 ±58 ms) then conscious rat(160±14 ms) (Fig 1H). Below we argue that HRV is strongly depen-dent on CL: the shorter the CL, the less the HRV. This explains the low HRV(SDNN and RMSSD) in the human congestive heart failure (Fig 1F and 1G) and conscious rat (Fig 1I and 1J), which has the shortest CL (Fig 1F and 1I).
Frequency Domain Analysis
In frequency domain analysis we used Total Power(TP) (high frequency (HF)+low frequency (LF)+very low frequency (VLF)) to analyse RR-interval time series data of human normal
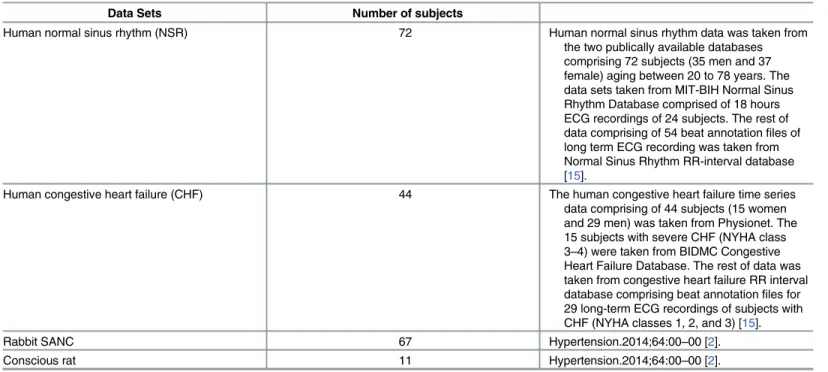
Table 1. R-wave to R-wave interval data sets used in the study.
Data Sets Number of subjects
Human normal sinus rhythm (NSR) 72 Human normal sinus rhythm data was taken from
the two publically available databases comprising 72 subjects (35 men and 37 female) aging between 20 to 78 years. The data sets taken from MIT-BIH Normal Sinus Rhythm Database comprised of 18 hours ECG recordings of 24 subjects. The rest of data comprising of 54 beat annotationfiles of long term ECG recording was taken from Normal Sinus Rhythm RR-interval database [15].
Human congestive heart failure (CHF) 44 The human congestive heart failure time series data comprising of 44 subjects (15 women and 29 men) was taken from Physionet. The 15 subjects with severe CHF (NYHA class 3–4) were taken from BIDMC Congestive Heart Failure Database. The rest of data was taken from congestive heart failure RR interval database comprising beat annotationfiles for 29 long-term ECG recordings of subjects with CHF (NYHA classes 1, 2, and 3) [15].
Rabbit SANC 67 Hypertension.2014;64:00–00 [2].
Conscious rat 11 Hypertension.2014;64:00–00 [2].
Fig 1. Differences in heart rate variability (HRV) among different cardiac preparations (baseline conditions).A to D, Tachograms from: (a) human normal sinus rhythm (n = 72); (b) human congestive heart failure (n = 44);(c) rabbit SANC(sinoatrial node cell; n = 67);(d) conscious rat(n = 11) subjects. Individual experiments are plotted in unique colours. E to J, Summary of baseline differences in cycle length (CL) and HRV among cardiac preparations. Mean (+SEM) CL (E,H), SD of normal beat to normal beat intervals (SDNN; F,I), and root mean square of successive differences (RMSSD) (G,J) for different preparations.
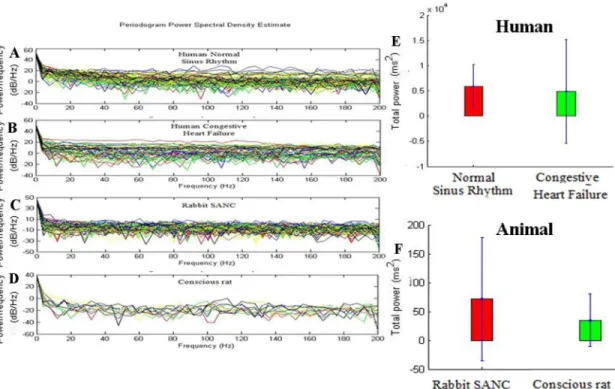
sinus rhythm (n = 72),human congestive heart failure(n = 44), rabbit SANC(sinoatrial node cell; n = 67) and conscious rat(n = 11).Fig 2A–2D: Power spectra under baseline conditions from all four species studied to show difference in power present at frequencies.
HRV in terms of Total Power in human groups is high in the normal sinus rhythm(Fig 2E) then congestive heart failure (Fig 2E). Similarly, HRV in terms of Total Power in animal groups is high in the rabbit SANC (Fig 2F) then conscious rat (Fig 2F). The baseline cycle length (CL; same as R-R or NN interval) also varied widely between preparations (Fig 1E and 1H). In human groups preparation with the longest CL is normal sinus rhythm (713±95 ms) then congestive heart failure (657±97 ms) (Fig 1E). Similarly in animal groups preparation with the longest CL is rabbit SANC(326±58 ms) then conscious rat(160±14 ms) (Fig 1H). Below we argue that HRV is strongly dependent on CL: the shorter the CL, the less the HRV. This explains the low HRV(Total Power) in the human congestive heart failure (Fig 2E)and con-scious rat (Fig 2F), which has the shortest CL (Fig 1E and 1H).
Nonlinear Time Series Analysis
In nonlinear time series analysis we used Approximate Entropy and Sample Entropy to analyse RR-interval time series data of human normal sinus rhythm (n = 72),human congestive heart failure(n = 44), rabbit SANC(sinoatrial node cell; n = 67) and conscious rat(n = 11). In human groups, HRV in terms of Approximate Entropy and Sample Entropy is high in normal sinus rhythm (Fig 3A and 3B) then congestive heart failure (Fig 3A and 3B). Similarly in animal groups, HRV in terms of Approximate Entropy and Sample Entropy is high in rabbit SANC (Fig 3C and 3D) then conscious rat(Fig 3C and 3D).
Fig 2. Differences in heart rate variability (HRV) among different cardiac preparations (baseline conditions) using frequency domain analysis.A toD, Tachograms from: (a) human normal sinus rhythm (n = 72); (b) human congestive heart failure (n = 44);(c) rabbit SANC(sinoatrial node cell; n = 67);(d) conscious rat(n = 11) subjects. E and F shows the total power among different cardiac preparations.
The baseline cycle length (CL; same as R-R or NN interval) also varied widely between prep-arations (Fig 1F and 1I). In human groups preparation with the longest CL is normal sinus rhythm (713±95 ms) then congestive heart failure (657±97 ms) (Fig 1E). Similarly in animal groups preparation with the longest CL is rabbit SANC (326±58 ms) then conscious rat(160 ±14 ms) (Fig 1H). Below we argue that HRV is strongly dependent on CL: the shorter the CL, the less the HRV. This explains the low HRV(Approximate Entropy and Sample Entropy) in the Human Congestive Heart Failure (Fig 3A and 3B) and Conscious Rat (Fig 3C and 3D), which has the shortest CL (Fig 1E and 1H).
Relationship between HRV and HR
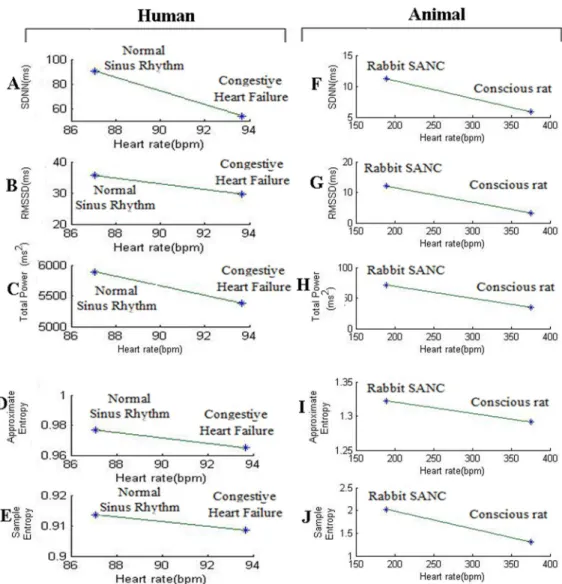
In the Figs1and3, indirect method has been used to identify the relation between HR and HRV, which first finds the relationships of cycle length (CL) with HRV. HRV is directly pro-portional to the CL, i.e. with increase in cycle length HRV also increases and vice versa. Since cycle length is inversely proportional to HR, it can be inferred that HRV is inversely propor-tional to that HR. In theFig 4, the direct method is used to identify relationship of HR and vari-ous linear and nonlinear HRV metrics.
Fig 4A–4Epresent the results of HRV linear (SDNN, RMSSD and total power) nonlinear (approximate entropy and sample entropy) measures plotted against HR for the human NSR and CHF groups. The results indicated that both linear and nonlinear metrics of HRV showed a decreasing with increasing HR. Similar results were obtained for the animal data as shown in theFig 4F–4J. Thus the findings clearly demonstrate an inverse relation of HRV metrics with HR using both direct and indirect methods.
Discussion
Heart rate variability analysis is a non-invasive technique used to assess the cardiac autonomic control under physiological and pathophysiological conditions [3,4,7]. The Task force of the ESC/NASPE in 1996 published standards in the measurement, interpretation and clinical use of HRV in cardiology [7]. Numerous studies reported that decreased HRV is associated with cardiovascular morbidity [3,4,7]. It has been well established in numerous studies that HR has
Fig 3. Differences in heart rate variability (HRV) among different cardiac preparations (baseline conditions) using Approximate Entropy and Sample Entropy, a nonlinear time series analysis.
significant effect on HRV [2,16,17]. Mangin et al [16], studied the relationship between HR and HRV parameters (SDNN, RMSSD and sum of LF and HF power). They found that HRV parameters were significantly correlated with cycle length and hence the heart rate. In another study conducted by Coumel et al [17], demonstrated a significant relation SDNN and HR (cor-relation coefficient 0.79). However, both of these studies did not show the quantitative (cor- relation-ship between HRV and HR.
Monfredi et al [2], used linear HRV parameters (SDNN, RMSSD) from variety of cardiac preparations in diverse species to establish a quantitative relationship between HR and HRV. They found exponetially decreasing trend in HRV with increasing heart rate. By using two bio-physical models they confirmed that HRV is primarily dependent on HR and cannot be used to independently assess the cardiac autonomic function. However, the study investigated the relationship of heart rate with linear HRV parameters only. Heart is not a periodic oscillator under normal physiologic conditions [7], the use of nonlinear HRV measures may provide bet-ter information to understand transient changes in heart period and their physiological and pathophysiological correlates [7]. In this study, relationship of both linear (SDNN, RMSSD,
Fig 4. Relationship between HRV metrics (SDNN, RMSSD, total power, approximate entropy, sample entropy) and heart rate.
Total Power) and nonlinear (Approximate Entropy and Sample Entropy) HRV parameters with HR was investigated using indirect and direct methods. In indirect method, we first iden-tified the relationship between cycle length and HRV parameters as shown in Figs1and3, it was found that HRV has directly correlated with cycle length i.e. with increase in cycle length HRV also increased and vice versa. As cycle length is inversely correlated to HR, we concluded that HRV can also be inversely correlated to HR. In direct method we have directly plotted HRV (SDNN, RMSSD, Total Power, Approximate Entropy, Sample Entropy) against HR (Fig 4). The simulations indicate that HRV is primarily dependent on HR. There is an inverse corre-lation between the HRV and HR: a larger HRV (R-R interval) was correlated with a lower HR, and the vice versa. Such a correlation was observed both in the human data at variant patholog-ical conditions and variant animal species.
Conclusion
In this study, we investigated the relationship of linear (time domain and frequency domain) and nonlinear HRV parameters with heart rate using RR-interval time series data from human and animals. The RR-interval time series comprised of human (72 NSR and 44 CHF subjects) and animal subjects (67 rabbit sinoatrial node cells data and 11 conscious rats). The research findings indicate that both linear and nonlinear HRV methods showed an inverse correlation between the HRV and HR: a larger HRV (R-R interval) was correlated with a lower HR, and the vice versa. Such a correlation was observed both in the human data at variant pathological conditions and in different animal species. The inverse correlation of nonlinear HRV measures along with linear ones with HR is the salient feature of this study. The outcomes of this study strong the evidence of relationship between HRV with HR and are in line with outcomes of Monfredi and co-authors. It is suggested that in future studies HR should be taken into consid-eration at which HRV analysis is being performed.
Author Contributions
Conceived and designed the experiments: SZHK HZ WA. Performed the experiments: SZHK HZ WA SAA. Analyzed the data: SZHK HZ WA OM. Contributed reagents/materials/analysis tools: SZHK HZ WA OM. Wrote the paper: SZHK SSHK SAA. Designed and implemented the experimental software: SZHK SAS WHB.
References
1. Billman GE (2011) Heart rate variability—a historical perspective. Front Physiol. 2:86. doi:10.3389/ fphys.2011.00086PMID:22144961
2. Monfredi O, Lyashkov A, Johnsen A, Inada S, Schneider H, Wang R, Nirmalan M, Wisloff U, Maltsev V, Lakatta E, Zhang H, Boyett M (2014) Biophysical characterization of the underappreciated and impor-tant relationship between heart rate variability and heart rate. Hypertension. 64(6): 1334–43. doi:10. 1161/HYPERTENSIONAHA.114.03782PMID:25225208
3. Aziz W, Schlindwein F S, Wailoo M, Biala T, Cardona Rocha F (2012) Heart rate variability analysis of normal and growth restricted children. Clin. Auto. Res. 22, 91–97.
4. Aziz W, Biala T, Habib N, Abbasi M S, Wailoo M, Schlindwein F S (2013) Heart rate variability in low birth weight growth restricted children during sleep and wake stages. Meas. 46, 2300–2305. 5. Ramirez-Villegas JF, Lam-Espinosa E, Ramirez-Moreno DF, Calvo-Echeverry PC, Agredo-Rodriguez
W (2011) Heart Rate Variability Dynamics for the Prognosis of Cardiovascular Risk. PLoS ONE 6(2): e17060. doi:10.1371/journal.pone.0017060PMID:21386966
6. Acharya UR, Joseph KP, Kannathal N, Lim CM, Suri S J (2006) Heart rate variability: a review. Med. Bio. Eng. Comput. 44, 1031–1051.
8. Biala T, Aziz W, Wailoo M, Schlindwein F S (2012) Heart rate variability analysis: Linear and nonlinear analysis of pre-awake period for normal and intrauterine growth restricted children at 10 year. Meas. 45, 2096–2102.
9. Dekker JM, Schouten EG, Klootwijk P, Pool J, Swenne CA, Kromhout D (1997) Heart rate variability from short electrocardiographic recordings predicts mortality from all causes in middle-aged and elderly men. The Zutphen Study. Am J Epidemiol. 145:899–908. PMID:9149661
10. Dekker JM, Crow RS, Folsom AR, Hannan PJ, Liao D, Swenne CA,Schouten EG(2000) Low heart rate variability in a 2-minute rhythm strip predicts risk of coronary heart disease and mortality from several causes:the ARIC Study. Atherosclerosis Risk In Communities. Circulation. 102:1239–1244. PMID:
10982537
11. Malliani A, Pagani M, Lombardi F and Cerutti S (1991). Cardiovascular neural regula-tion explored in the frequency domain. Circulation 84: 482–492. PMID:1860193
12. Pincus SM (1991). Approximate entropy as a measure of system complexity. Proceedings of the National academy of sciences, USA, pp 2297–2301.
13. Richman JS, Moorman JR (2000). Physiological time-series analysis using approximate entropy and sample entropy. Am J Physiol Heart and Circ Physiol 278:H2039–H2049.
14. Costa M, Goldberger AL, Peng CK (2005) Multi-scale entropy analysis of biological signals. Phys. Rev. E 71, 021906.
15. Goldberger AL, Amaral LAN, Glass L, Hausdorff JM, Ivanov PCh, Mark RG, Mietus JE, Moody GB, Peng CK, Stanley HE. PhysioBank, PhysioToolkit, and PhysioNet (2000) Components of a New Research Resource for Complex Physiologic Signals. Circulation 101(23):e215–e220. PMID:
10851218
16. Mangin L, Swynghedauw B, Benis A, Thibault N, Lerebours G, Carré F (1998). Relationships between heart rate and heart rate variability: study in conscious rats. J Cardiovasc Pharmacol. 32:601–607. PMID:9781928