Symbolic analysis of heart rate variability and its interaction
with p-value of normality tests applied on RR intervals
Andrey A. PortoI, Celso FerreiraI, Luiz Carlos de AbreuIII, David M. GarnerIV, Luana GonzagaII, Vitor E. ValentiII
DOI: 10.5935/MedicalExpress.2016.02.04
I Universidade Federal de São Paulo, Departamento de Medicina, Disciplina de Cardiologia, São Paulo, SP, Brazil.
II Universidade Estadual Paulista, Faculdade de Ciências e Tecnologia, Centro de Estudos do Sistema Nervoso Autônomo, Programa de Pós-Graduação em
Fisio-terapia, Presidente Prudente, SP, Brazil.
III Faculdade de Medicina do ABC, Departamento de Morfologia e Fisiologia, Santo André, SP, Brazil.
IV Cardiorespiratory Research Group, Department of Biological and Medical Sciences, Faculty of Health and Life Sciences, Oxford Brookes University, Gipsy Lane,
Oxford, United Kingdom.
OBJECTIVE: A previous study suggested that the p-value of normality test applied to RR intervals is an index able to quantify Heart Rate Variability (HRV) through correlation of traditional time and frequency domain indices. We investigate the association between the p-value of normality test applied in RR intervals and symbolic analysis of HRV.
METHOD: We evaluated 32 healthy women between 18 and 30 years old. RR intervals were used for HRV analysis and we performed symbolic analysis, where RR intervals are joined by symbols. Sets of three consecutive symbols (RR intervals) were grouped into four types of clusters, as follows: 1. Three equal symbols (zero variation); 2: two equal, one divergent symbol (one variation); 3. Three diferent symbols monotonically ascending or descending (two like variations); 4. Three diferent symbols, forming a peak or a trough (two unlike variations). Frequency of occurrence of each type of cluster was calculated. Normality tests were applied to all RR intervals and the p-value was calculated. We computed the correlations between the p-value of normality test and symbolic analysis of HRV.
RESULTS: Correlation coeicients between the p-value of normality test from Kolmorogov-Smirnov test and the four types of clusters showed no correlation for any of them. Likewise, the correlation coeicient index between the p-value of normality test calculated from the Shapiro-Wilk test and symbolic analysis produced no signiicant results for any of the four types of clusters.
CONCLUSION: There was no signiicant correlation between the p-value of normality test and HRV symbolic analysis. The physiological signiicance of this result is that the PNT is not related to chaotic behavior of HRV.
KEYWORDS: Autonomic nervous system; Cardiovascular system; Cardiovascular physiology; Gaussian distribution.
Porto AA, Ferreira C, Abreu LC, Garner DM, Gonzaga L, Valenti VE. Symbolic analysis of heart rate variability and its interaction with p-value of normality tests applied on RR intervals. MedicalExpress (São Paulo, online). 2016;3(2):M160204.
Received for Publication on November 6, 2015; First review on December 3, 2015; Accepted for publication on January 19, 2016; Online on March 8, 2016
E-mail: [email protected]
■
INTRODUCTIONHeart Rate Variability (HRV) has proven to be an attractive, practical, non-invasive and cheap method to assess autonomic modulation and is used widely in medical and life sciences. Fluctuations in HRV patterns are related to sensitive and early indicators of pathological states.1 A complex analysis of HRV
fluctuations can be applied to indirectly assess the
Autonomic Nervous System.2 The sympathetic and
parasympathetic components of the Autonomic Nervous System exert a partial control over myocardial function and play an important role in homeostasis.3
A previous study modelled HRV as a linear combination of Gaussians.4 On the other hand, non-linear
methods applied to investigate HRV are proposed to be more responsive to changes in the HRV patterns compared to standard linear indices.5 Studies using pharmacological
blockade6 and autonomic testing7 have shown that the
6:00 and 9:00 PM. Volunteers were instructed to remain at rest and avoiding conversation during the experiment.
After initial evaluation, the heart monitor belt was placed over the thorax, aligned with the distal third of the sternum and the Polar RS800cx heart rate receiver (Polar Electro, Finland) was placed on the wrist. Heart rate was recorded at rest, seated for 10 minutes.10
HRV analysis
We followed the recommendations set by the Task Force Guidelines established by European Society of Cardiology and the North American Society of Pacing and Electrophysiology.9 The RR intervals were recorded
by the Portable RS800CX heart rate monitor; with a sampling rate of 1000 Hz. They were downloaded to the Polar Precision Performance program (v.3.0, Polar Electro, Finland). The software enabled the visualization of heart rate and the extraction of a cardiac period (RR interval) file in “txt” format. After digital filtering assisted by manual filtering for the elimination of premature ectopic beats and artifacts, 500 RR intervals were made available for the data analysis. Only series with more than 95% sinus rhythm were included. To allow the calculation of the linear indices we applied the HRV Analysis software (Kubios HRV v.1.1 for Windows, Biomedical Signal Analysis Group, Department of Applied Physics, University of Kuopio, Finland).
Symbolic Analysis
For the purpose of symbolic analysis, RR intervals were joined by groups, a group of RR interval forming a group of symbols.
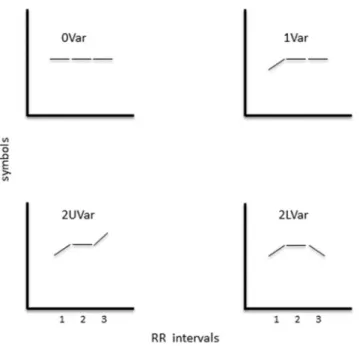
Symbolic analysis was undertaken by grouping the patterns with 3 symbols into four types of clusters: (1) no variation (0-Var: all the symbols are equal, e.g. 2,2,2 or 4,4,4); (2) one variation (1-Var: 2 consecutive symbols are equal and the remaining symbol is different, e.g. 4,2,2 or 4,4,3); (3) two like variations (2-LVar: the 3 symbols form an ascending or descending ramp, e.g. 5,4,2 or 1,3,4); and (4) two unlike variations (2-ULVar: the three symbols form a peak or a trough, e.g. 4,1,2 or 3,5,3). The rate of occurrence for each pattern was defined as 0-Var%, 1-Var%, 2-LV%, and 2-UlVar%. It has been previously reported that 0-Var% reflects only sympathetic modulation, 1-Var% reflects sympathetic and parasympathetic modulation, 2-LVar% and 2-UL-Var% reflect, exclusively, vagal modulation.7 Figure 1
schematically illustrates possible symbol patterns.
Normality of distribution of RR intervals (PNT)
We applied normality tests (Kolmorogov-Smirnov and Shapiro-Wilk tests) to each RR interval recording; the tests generated p-values, which we considered as the PNT.8
Nevertheless, it is important to establish new indices to assess HRV. A recent article8 proposed the p-value of
normality test (PNT) applied to RR intervals as an index, providing information regarding HRV. The authors found
significant correlations between the PNT and traditional
indices of the time and frequency domain. Nonetheless, it is unclear whether the PNT is associated with other non-linear analyses. Accordingly, we aimed to evaluate the association between the PNT and the symbolic analysis of HRV.
■
METHODStudy Population
We assessed 32 healthy women aged between 18 and 30 years old, 1.64 ± 0.06 m tall, weighing 58.68 ± 9.48 kg, with 21.95 ± 3.69 kg/m2 of body mass index, 83.40 ± 13.09
bpm, RR intervals of 742 ± 131.3 ms, 109.37 ± 7.87 mmHg (systolic arterial pressure) and 69.31 ± 2.49 mmHg (diasto-lic arterial pressure). Every volunteer was informed about the procedures and objectives of the study. After agreeing, they signed a consent form. The entire study procedures were approved by the Ethics Committee in Research of the Faculty of Sciences of the Universidade Estadual Paulista, Campus of Marilia (case # 554/2012) and adhered to the resolution 196/96 of the Brazilian National Health Council of 10/10/1996.
Non-inclusion criteria
We excluded subjects under the following condi-tions: body mass index (BMI) > 35 kg/m2; systolic blood
pressure (SBP) > 140 mmHg or diastolic blood pressure (DBP) > 90 mmHg (at rest); reported cardiorespiratory, neurological and endocrine disorders; smoking, treatment
with drugs that influence cardiac autonomic regulation.
For example, medications such as adrenergic, beta--blockers, angiotensin agonists and antagonists and
wo-men between 10-15 and 20-25 days after the first day of
menstrual cycle to avoid luteal and follicular phase.
Initial Evaluation
Prior to the study, baseline criteria included: age, gender, mass, height and Body Mass Index (BMI). Mass was determined using a digital scale (W 200/5, Welmy, Brazil) with a precision of 0.1 kg. Height was determined using a stadiometer (ES 2020, Sanny, Brazil) with a precision of 0.1 cm and 220 cm of extension. BMI was calculated as mass/ height2, with mass in kilograms and height in meters.
Protocol
Figure 1. Schematic variations for symbols used to represent variations occurring between sets of consecutive RR intervals, namely constant, increasing, decreasing. 0Var: three consecutive similar RR intervals; 1Var: two similar, one dissimilar RR intervals; 2UVar: three dissimilar monotonically varying RR intervals; 2LVar: three dissimilar non-monotonically varying intervals.
analysis (0-Var, 1-Var, 2-LVar and 2-UVar). To calculate the PNT we used the Biostat Software v5.8.4 for Windows.
Statistical Analysis
Normal Gaussian distribution of the data was verified by the Shapiro-Wilk goodness-of-fit test (z value > 1.0). We
performed correlations between the PNT and components of the HRV symbolic analysis. For parametric distributions we applied the Pearson correlation test. For non-parametric distributions we used the Spearman correlation test. We considered weak correlation for r < 0.3, moderate correlation for r between 0.31 and 0.49 and robust correlation for r > 0.5. We performed correlations between the p-values of the normality tests and the symbolic analysis
of HRV. Significance was assumed important when the
probability of a Type I error was less than 5% (p < 0.05). We used Biostat Software v5.8.4 for Windows.
■
RESULTSTable 1 shows that the p-value of the normality test (PNT) analyzed through the Kolmorogov-Smirnov normality test applied in RR intervals presented no
significant correlation with symbolic analysis of HRV.
According to Table 2, we observe that the PNT analyzed through Shapiro-Wilk normality test applied in RR
intervals was not significantly correlated with the symbolic
analysis of HRV.
Table 1 - Correlation between the p-value for the Kolmorogov-Smirnov test and the HRV indices
Symbol Correlation coeicients p
0-Var (abs) 0.04 0.85
1-Var (abs) 0.12 0.59
2-LVar (abs) -0.07 0.76
2-UVar (abs) 0.19 0.41
0-Var (%) 0.01 0.94
1-Var (%) -0.02 0.90
2-LVar (%) -0.09 0.69
2-UVar (%) 0.18 0.44
0-Var: three identical symbols; 1-Var: two identical one dissimilar symbols; 2-LVar: three dissimilar symbols varying monotonically; 2UVar: three dissimilar symbols varying non monotonically; Abs: number of occurrences;
Table 2 - Correlation between the p-value for the Shapiro-Wilk test and the HRV indices
Symbol Correlation coeicients p
0-Var (abs) -0.08 0.71
1-Var (abs) -0.05 0.80
2-LVar (abs) -0.10 0.64
2-UVar (abs) 0.16 0.48
0-Var (%) -0.09 0.69
1-Var (%) 0.16 0.48
2-LVar (%) -0.16 0.49
2-UVar (%) 0.15 0.50
■
DISCUSSIONThe study objective was to assess the association between the values of symbolic analysis of HRV and the normality of distribution of RR intervals (PNT) in order to check the existence of additional information regarding
the new proposed index to analysis HRV. The major finding of this study is the absence of any significant correlation
between the variables.
According to our conclusions the 0-Var component did not correlate with the PNT. This component in whch no variation is noted between the three symbols corresponds to the sympathetic modulation of the heart.7 In a study by
Valenti et al.,8 the association between the value of PNT and
linear indices of HRV was initiated. This study established a very low correlation of the PNT of the Shapiro-Wilk test and Kolmorogov-Smirnov with LF/HF ratio, and LF indices.
Regarding this both indices had significant influence of the
sympathetic component.1
In the same report8 a moderate correlation was
correlation of the PNT with the SDNN/RMSSD ratio, which represents the cardiac sympatho-vagal balance.
Consequently, we propose that there is no correlation between the PNT and the indexes representing the cardiac sympathetic regulation.
The 1V and 2LV components of the HRV symbolic
analysis reflect overall modulation of heart rate. According
to our results there was no connection between these two variables and the PNT.
According to Tulppo et al,11 the sympathetic and
parasympathetic components of the autonomic nervous system behave in a reciprocal manner, so that an increase in one of them leads to a decrease in the other.
In Valenti et al.8 the SDNN and SD2 global indexes
were robustly correlated with the PNT in the Shapiro-Wilk test analysis. However, the global components of the symbolic analysis were not interconnected with the PNT in our investigation.
We report that the parasympathetic component 2UV do not correlate with the PNT. In the aforesaid study8
RMSSD, pNN50 and SD1 indices were strongly correlated with the PNT. These three indices indicate cardiac parasympathetic regulation.1
We believe that the parasympathetic component of the symbolic analysis did not correlate with PNT because PNT does not provide information regarding the complex behavior of heart rate dynamics.
In this context, it is proposed that the PNT presents linear characteristics, because it is powerfully associated with the traditional linear analysis of HRV. This highlights the hypothesis that the PNT index failed to present nonlinear characteristic because it is extracted from a parametric calculation.
Through our data, we suggest that the PNT through Kolmorogov-Smirnov and Shapiro-Wilk tests applied in RR intervals were not associated with symbolic analysis of
HRV. In this context, the parametric profile of this test may
be related to the absence of association, because symbolic analysis is a non-linear method that investigates chaotic behavior of heart rate dynamics.7
■
CONCLUSIONThere was no correlation between the p-value of normality test and HRV symbolic analysis. Consequently, this indicates that the new proposed HRV analysis index
has no affiliation with the mentioned non-linear technique.
■
CONFLICT OF INTERESTAuthors declare no conflicts of interest related to
this project
■
AUTHOR PARTICIPATIONPorto AA, Gonzaga L and Valenti VE participated in the acquisition of data. Porto AA, Gonzaga L and Valenti VE determined the design and performed the statistical analysis. Valenti VE, Abreu LC and Ferreira C interpreted the data and drafted the manuscript. All authors participated
in revision of the manuscript read and gave final approval
for the version submitted for publication.”
ANÁLISE SIMBÓLICA DA VARIABILIDADE DA FREQUÊNCIA CARDÍACA E SUA INTERAÇÃO COM VALOR-P DE TESTES DE NORMALIDADE APLICADO EM INTERVALOS RR
OBJETIVO: Um estudo anterior sugeriu que o valor “p” do teste de normalidade (PNT) aplicado a intervalos RR
é um índice capaz de quantificar variabilidade da frequência
cardíaca através da correlação tradicional dos índices de
tempo e frequência. Investigamos a associação entre o
teste PNT aplicado a intervalos RR e a análise simbólica da
variabilidade da frequência cardíaca.
MÉTODO: Foram avaliadas 32 mulheres saudáveis entre 18 e 30 anos de idade. Os intervalos RR foram
utilizados para análise da variabilidade da frequência
cardíaca; foi realizada uma análise simbólica, onde
intervalos RR são unidos por símbolos. Grupos de três
símbolos consecutivos foram agrupados em quatro tipos
de aglomerados, a saber: 1: três símbolos iguais (variação
zero); 2: dois símbolos iguais, um divergente (uma
variação); 3: três símbolos diferentes, monotonicamente
crescentes ou decrescentes (duas variações iguais); 4:
três símbolos diferentes, formando um pico ou uma calha (duas variações desiguais). Foi calculada a frequência de ocorrência de cada tipo de cluster. Testes de normalidade
foram aplicados a todos os intervalos RR e o valor de “p” foi calculado. Calculamos as correlações entre o PNT e análise simbólica de HRV.
RESULTADOS: Os coeficientes de correlação entre
PNT de teste Kolmorogov-Smirnov e os quatro tipos de clusters não mostraram correlação com qualquer um
deles. Da mesma forma, o coeficiente de correlação entre
o índice PNT calculado a partir do teste de Shapiro-Wilk e
a análise simbólica não produziu resultados significativos
para qualquer dos quatro tipos de aglomerados.
CONCLUSÃO: Não houve correlação significativa
entre o PNT e análise simbólica da variabilidade da
frequência cardíaca. O significado fisiológico deste resultado
é que o PNT não está relacionado ao comportamento caótico da VFC.
■
REFERENCES1. Vanderlei LC, Pastre CM, Hoshi RA, Carvalho TD, Godoy MF. Basic notions of heart rate variability and its clinical applicability. Rev Bras Cir Cardiovasc. 2009;24(2):205-17. http://dx.doi.org/10.1590/S0102-76382009000200018.
2. Prumprla J, Howorka K,Groves D, Chester M, Nolan J, Functional as-sessment of heart rate variability: physiological basic and practical application. Int J Cardiol. 2002;84(1):1-14. http://dx.doi.org/10.1016/ S0167-5273(02)00057-8.
3. Abreu LC. Heart rate variability as a functional marker of development. J Human Growth and Development. 2012;22(3):279-81.
4. Costa T, Coccignone G, Ferraro M. Gaussian mixture model of heart rate variability. Plos One. 2012; 7:1e37731. http://dx.doi.org/10.1371/ journal.pone.0037731
5. Sá JCF, Costa EC, Silva E, Tamburús NY, Porta A, Medeiros LF, et al. Aerobic exercise improves cardiac autonomic modulation in women with polycystic ovary syndrome. Int J Cardiol. 2016;202(1):356-61. http://dx.doi.org/10.1016/j.ijcard.2015.09.031
6. Guzzetti S, Borroni E, Garbelli PE, Ceriani E, Della Bella P, Montano N. Symbolic dynamics of heart rate variability: a probe to investigate cardiac autonomic modulation. Circulation. 2005;112 (4):465–70. http://dx.doi.org/10.1161/CIRCULATIONAHA.104.518449
7. Porta A, Tobaldini E, Guzzetti S, Furlan R, Montano N, Gnecchi-Ruscone T. Assessment of cardiac autonomic modulation during graded head-up tilt by symbolic analysis of heart rate variability. Am J Physiol-Heart Circ Physiol. 2007;293(1):H702-8. http:// dx.doi.org/10.1152/ajpheart.00006.2007
8. Valenti VE, Cardoso MA, Oliveira LS, Moreira PSG, Amaral JAT, Ferreira C, et al. Application of p-value from statistical normal-ity tests in RR intervals for short recordings. Health Med. 2015; 9(3):106-13.
9. Camm AJ, Malik M, Bigger JT, Breithardt G, Cerutti S, Cohen RJ, et al. Heart rate variability: standards of measurement, physiological interpretation and clinical use. Task Force of the European Soci-ety of Cardiology and the North American SociSoci-ety of Pacing and Electrophysiology. Circulation. 1996;93:1043-65. http://dx.doi. org/10.1161/01.CIR.93.5.1043
10. Tulppo MP, Kiviniemi AM, Hautala AJ, Kallio M, Seppänen T, Mäkikal-lio TH, et al. Physiological background of the loss of fractal heart rate dynamics. Circulation. 2005;112:314–9. http://dx.doi.org/10.1161/ CIRCULATIONAHA.104.523712